Review
. 2017 Oct 11;81(4):e00002-17.
doi: 10.1128/MMBR.00002-17. Print 2017 Dec.

Stochastic Community Assembly: Does It Matter in Microbial Ecology?

Affiliations
Review

Stochastic Community Assembly: Does It Matter in Microbial Ecology?

Jizhong Zhou et al. Microbiol Mol Biol Rev. .

Abstract

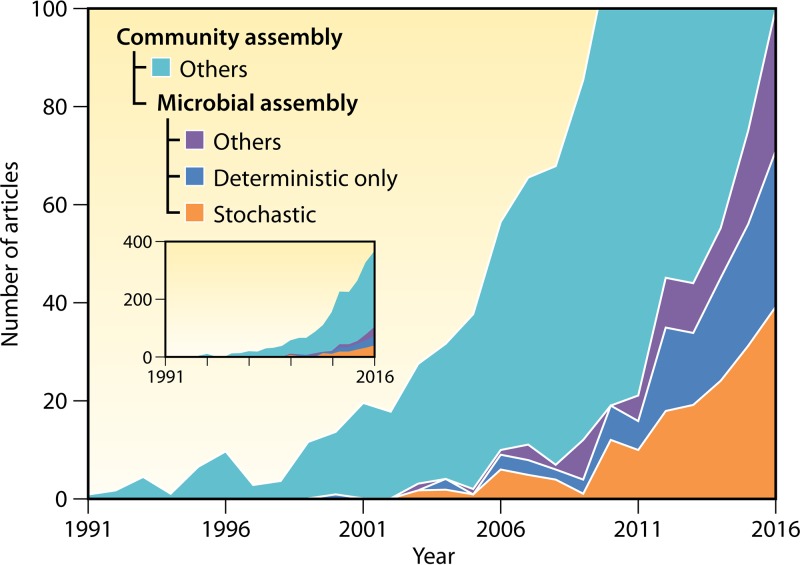
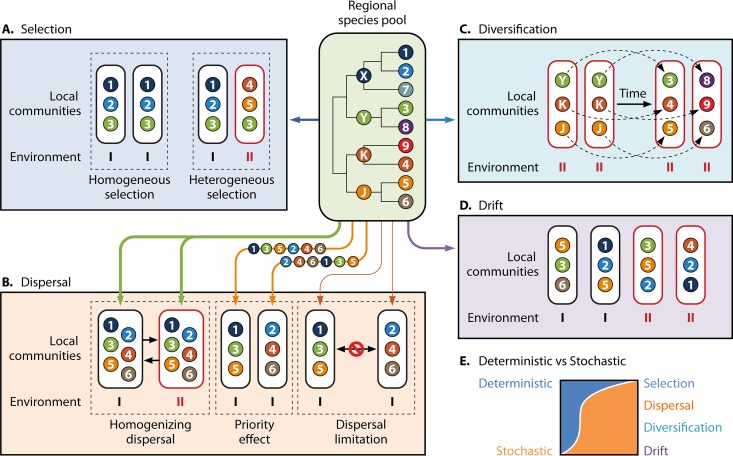
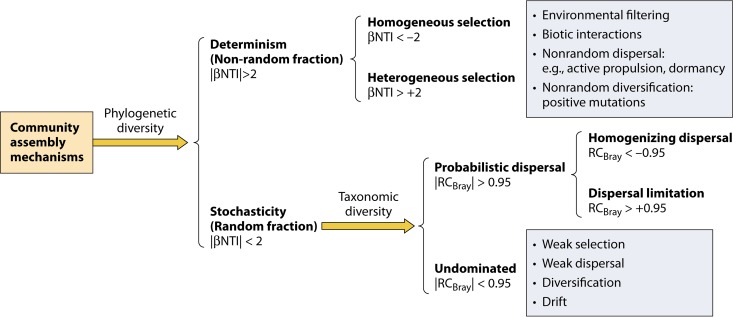
Understanding the mechanisms controlling community diversity, functions, succession, and biogeography is a central, but poorly understood, topic in ecology, particularly in microbial ecology. Although stochastic processes are believed to play nonnegligible roles in shaping community structure, their importance relative to deterministic processes is hotly debated. The importance of ecological stochasticity in shaping microbial community structure is far less appreciated. Some of the main reasons for such heavy debates are the difficulty in defining stochasticity and the diverse methods used for delineating stochasticity. Here, we provide a critical review and synthesis of data from the most recent studies on stochastic community assembly in microbial ecology. We then describe both stochastic and deterministic components embedded in various ecological processes, including selection, dispersal, diversification, and drift. We also describe different approaches for inferring stochasticity from observational diversity patterns and highlight experimental approaches for delineating ecological stochasticity in microbial communities. In addition, we highlight research challenges, gaps, and future directions for microbial community assembly research.

Keywords: community assembly; ecological drift; ecological processes; ecological stochasticity; microbial communities.


Figures

FIG 1
FIG 1
Trends in studying community assembly mechanisms. The data shown are based on the annual number of articles on community assembly (any organisms, including microorganisms [inset]), articles on microbial community assembly, articles about only deterministic microbial assembly, and articles involving stochastic microbial assembly. We searched articles from 1990 to 2016 in the Web of Science Core Collection database on 10 January 2017. To find articles on “community assembly,” we searched by topic = “community assembly” and Indexes = SCI-EXPANDED and ESCI. To find articles on “microbial assembly,” we searched by topic = (microbi* or bacteri* or fungi or fungus or fungal or archaea* or protist or metazoa* or mycorrhiza) in addition to “community assembly.” For articles on “stochastic,” we searched by topic = (neutral or stochast* or dispersal or migration or immigration or (priority effect) or (historical contingency) or drift or diversification or speciation) in articles on “microbial assembly.” For articles on “deterministic only,” we searched by topic = (niche or deterministic or selection or filtering or competiti* or facilitati* or mutualism or predation or interaction) in articles on “microbial assembly,” except for those related to “stochastic.”
FIG 2
FIG 2
Schematic representation of microbial community assembly processes. The middle panel represents the metacommunity species pool in a region. Each ball with a number is a contemporary species, while each ball with a letter is an ancestral species. The tree in the middle panel shows the phylogenetic relationships among different species. Species 1, 2, and 7 and their ancestor, species X, prefer environment I, while species 4 to 6, 9, K, and J prefer environment II, and species 3, 8, and Y live well in both environments I and II. (A to D) Extreme examples of the four different ecological processes. (A) Selection. The four local communities are strongly controlled by niche selection. While the local communities in environment I consist of only those species (species 1 to 3) that prefer environment I, the community in environment II is composed of only those species (species 3 to 5) that prefer environment II. The two local communities at the left have the same structure because of selection under the same type of environment (environment I), so-called homogeneous selection. The two communities at the right have different structures due to selection under different environments (environments I and II), so-called heterogeneous selection. (B) Dispersal. In the two communities at the left, there is very strong dispersal without any limitation between these two local communities. Even though the two communities are in different environments (environments I and II), they have exactly the same species (species 1 to 6) due to very strong dispersal, so-called homogenizing dispersal. In the middle two communities, species (species 1 to 6) moving along the arrow lines from the metacommunity have different orders of immigration to these two local communities. Due to priority effects, two different communities are formed even under identical environmental conditions. Species 1, 3, and 5 occupy the niches of one community because they arrive earlier than others, while species 2, 4, and 6 arrive earlier and dominate the other community. In the two local communities at the right, the arrow lines show immigration from the metacommunity, and there is very limited dispersal between these two local communities, so-called dispersal limitation. As a result, these two local communities have different structures even though they are in the same environment (environment I). (C) Diversification. This example of diversification assumes that there is no influence of either selection or dispersal. The two local communities (left) under the same environment, environment II, have the same ancestral species, species Y, K, and J, in the beginning. Due to diversification (speciation and extinction) in different communities, different new species could emerge from random mutations of the same ancestor (e.g., species 5 and 6 from species J). Consequently, the structures of these two communities could be different even under identical environmental conditions. (D) Drift. Species from the metacommunity occupy environmental niches only by chance due to random birth, death, and reproduction, etc., without any relevance to their niche preferences. For instance, taxon 5 prefers environment II, but because of drift, it is randomly present in communities in environments I and II. (E) Determinism versus stochasticity. The widths of the blue and orange parts represent the relative importances of determinism and stochasticity associated with each ecological process. Selection is solely deterministic, whereas drift is purely stochastic. In microbial ecology, dispersal and diversification are often considered stochastic processes but could be deterministic in some cases, although an example of deterministic dispersal or deterministic diversification is not shown.
FIG 3
FIG 3
Ecological processes shaping microbial community diversity in the context of the determinism-versus-stochasticity dichotomy. This scheme shows different steps in partitioning various ecological processes based on both phylogenetic and taxonomic diversity under the assumptions discussed in text. βNTI (β nearest-taxon index) is based on a null model test of the phylogenetic β-diversity index βMNTD (β mean nearest-taxon distance), and RCBray (modified Raup-Crick index) is based on a null model test of the Bray-Curtis taxonomic β-diversity index. The two boxes indicate the major components of deterministic selection and the undominated fraction, respectively. Besides less-influential selection, the weak selection in the undominated fraction may also result from counteracting influential selective factors and/or a contrasting selection of different taxa. The diagram was made primarily based on data reported previously by Stegen et al. (37, 109).
None
None

References

    1. Lyashevska O, Farnsworth KD. 2012. How many dimensions of biodiversity do we need? Ecol Indic 18:485–492. doi: 10.1016/j.ecolind.2011.12.016. - DOI
    1. Gaston KJ. 2000. Global patterns in biodiversity. Nature 405:220–227. doi: 10.1038/35012228. - DOI - PubMed
    1. Cardinale BJ, Duffy JE, Gonzalez A, Hooper DU, Perrings C, Venail P, Narwani A, Mace GM, Tilman D, Wardle DA, Kinzig AP, Daily GC, Loreau M, Grace JB, Larigauderie A, Srivastava DS, Naeem S. 2012. Biodiversity loss and its impact on humanity. Nature 486:59–67. doi: 10.1038/nature11148. - DOI - PubMed
    1. IPCC Core Writing Team, Pachauri RK, Meyer LA (ed). 2014. Climate change 2014: synthesis, report. Contribution of Working Groups I, II and III to the fifth assessment report of the Intergovernmental Panel on Climate Change. IPCC, Geneva, Switzerland.
    1. Wang Z, Brown JH, Tang Z, Fang J. 2009. Temperature dependence, spatial scale, and tree species diversity in eastern Asia and North America. Proc Natl Acad Sci U S A 106:13388–13392. doi: 10.1073/pnas.0905030106. - DOI - PMC - PubMed

Publication types