. 2017 Oct;10(10):e004140.
doi: 10.1161/CIRCHEARTFAILURE.117.004140.

Activation of Autophagy Ameliorates Cardiomyopathy in Mybpc3-Targeted Knockin Mice

Affiliations

Activation of Autophagy Ameliorates Cardiomyopathy in Mybpc3-Targeted Knockin Mice

Sonia R Singh et al. Circ Heart Fail. 2017 Oct.

Abstract

Background: Alterations in autophagy have been reported in hypertrophic cardiomyopathy (HCM) caused by Danon disease, Vici syndrome, or LEOPARD syndrome, but not in HCM caused by mutations in genes encoding sarcomeric proteins, which account for most of HCM cases. MYBPC3, encoding cMyBP-C (cardiac myosin-binding protein C), is the most frequently mutated HCM gene.

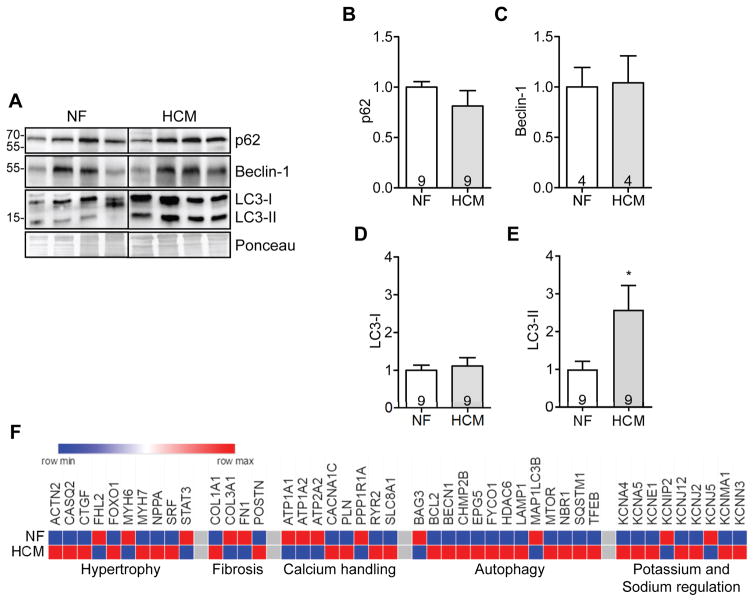
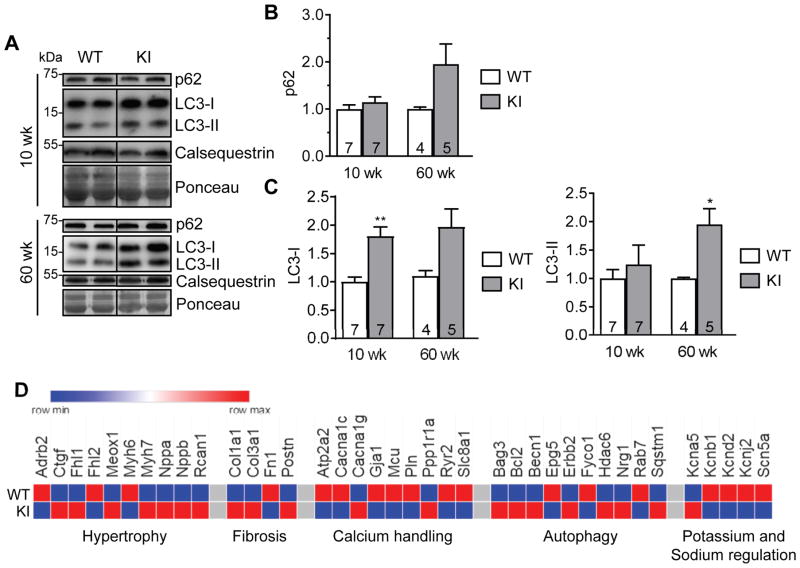
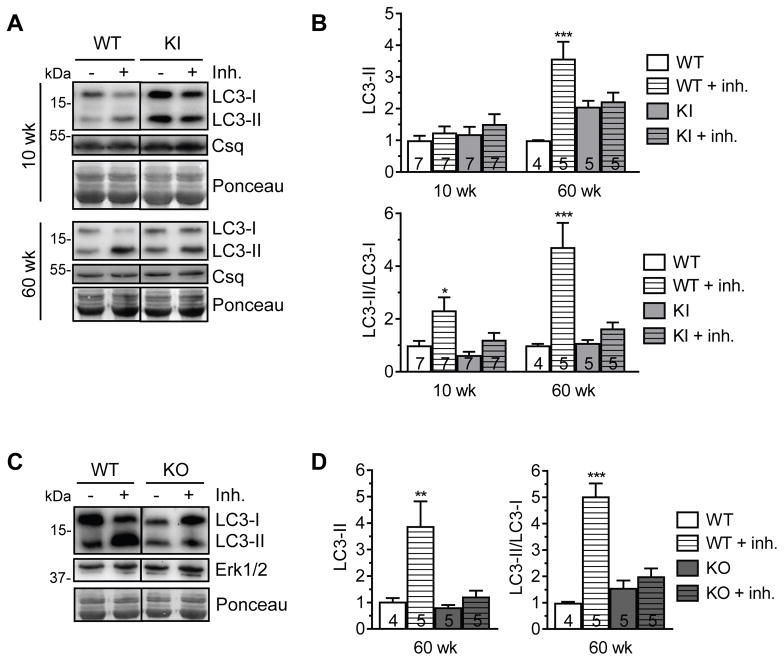
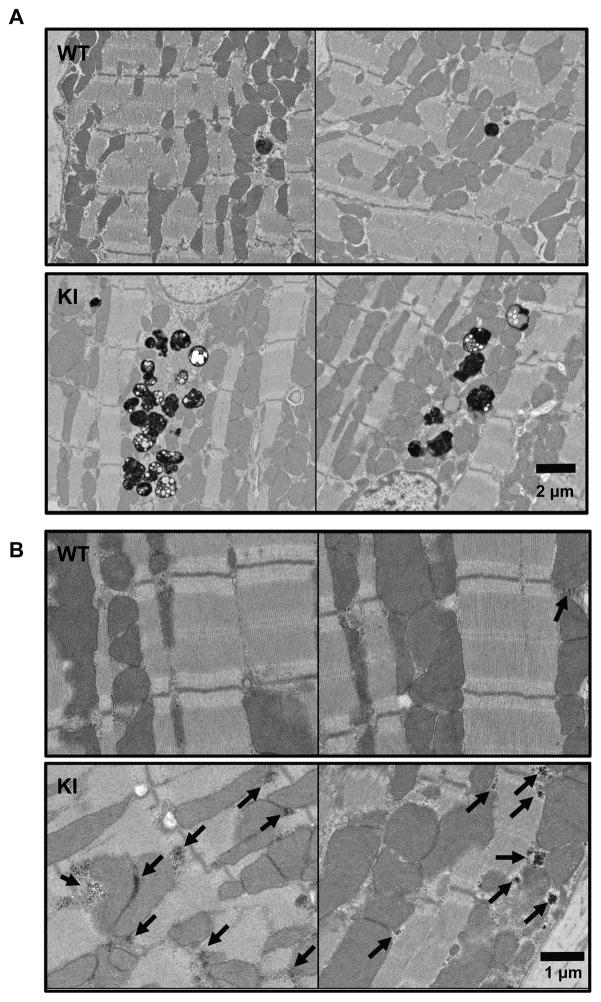
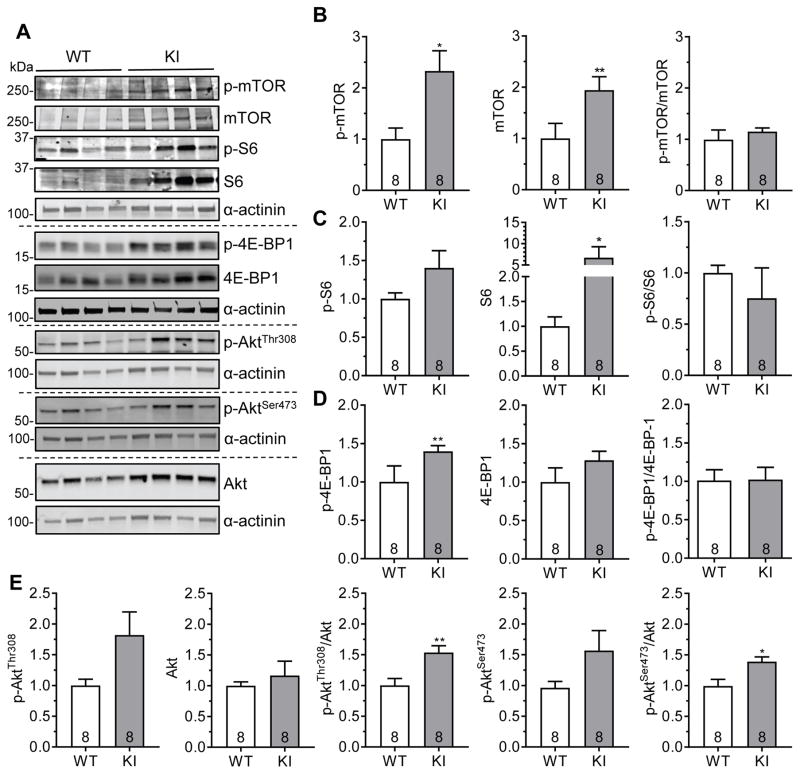
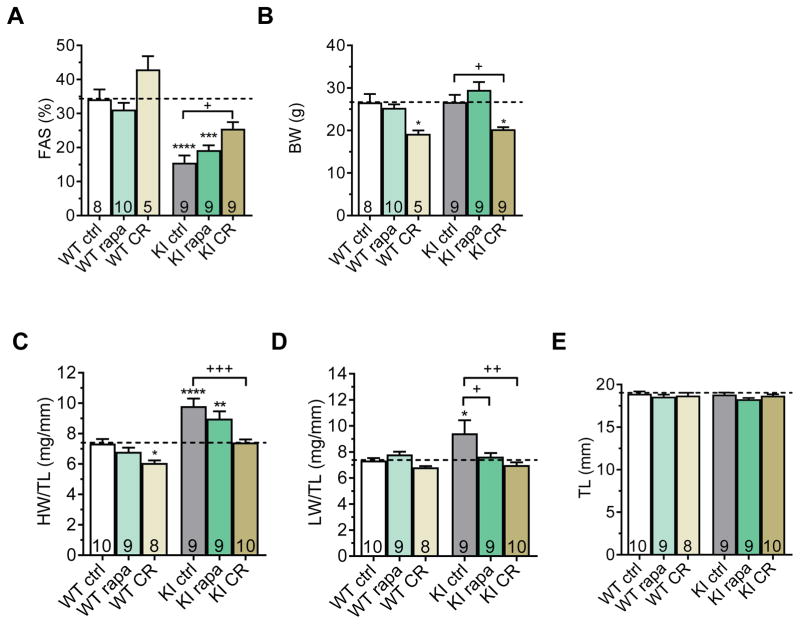
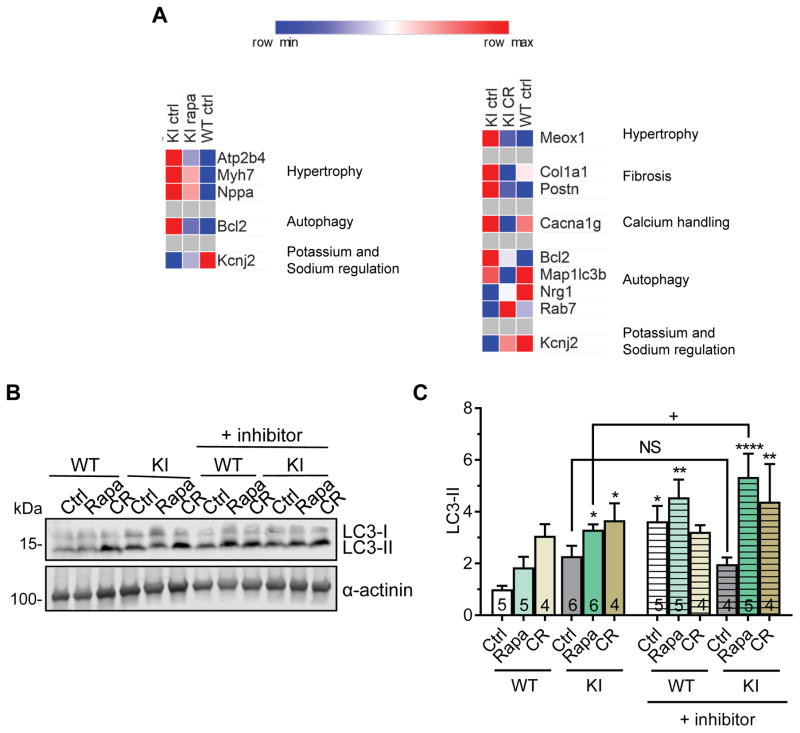
Methods and results: We evaluated autophagy in patients with HCM carrying MYBPC3 mutations and in a Mybpc3-targeted knockin HCM mouse model, as well as the effect of autophagy modulators on the development of cardiomyopathy in knockin mice. Microtubule-associated protein 1 light chain 3 (LC3)-II protein levels were higher in HCM septal myectomies than in nonfailing control hearts and in 60-week-old knockin than in wild-type mouse hearts. In contrast to wild-type, autophagic flux was blunted and associated with accumulation of residual bodies and glycogen in hearts of 60-week-old knockin mice. We found that Akt-mTORC1 (mammalian target of rapamycin complex 1) signaling was increased, and treatment with 2.24 mg/kg·d rapamycin or 40% caloric restriction for 9 weeks partially rescued cardiomyopathy or heart failure and restored autophagic flux in knockin mice.

Conclusions: Altogether, we found that (1) autophagy is altered in patients with HCM carrying MYBPC3 mutations, (2) autophagy is impaired in Mybpc3-targeted knockin mice, and (3) activation of autophagy ameliorated the cardiac disease phenotype in this mouse model. We propose that activation of autophagy might be an attractive option alone or in combination with another therapy to rescue HCM caused by MYBPC3 mutations.

Keywords: autophagy; caloric restriction; cardiomyopathy; hypertrophy; rapamycin.


Conflict of interest statement

Conflict of Interest Disclosures: None.

Figures

Figure 1
Figure 1. Dysregulation of autophagy in HCM patients with MYBPC3 mutations
Myectomy samples of HCM patients or heart samples from non-failing (NF) individuals were analyzed. A, Representative Western blots of p62, beclin-1 and LC3. Ponceau was used as loading control. Quantification of B, p62, C, beclin-1, D, LC3-I and E, LC3-II. Data are expressed as mean + s.e.m with *P<0.05 vs. NF, unpaired Student’s t-test. Number of individuals is indicated in the bars. F, Heatmap of selected genes comparing gene expression of proteins modulating hypertrophy, fibrosis, calcium handling, autophagy and potassium handling in NF and HCM (threshold <0.8- or >1.2-fold change to NF).
Figure 2
Figure 2. Dysregulation of autophagy in KI mice
Protein levels of p62 and LC3 in 10- and 60-week-old KI and WT mouse hearts. A, Representative Western blots of indicated proteins from mouse ventricular protein extracts (membrane-enriched fraction) of indicated ages. Calsequestrin and Ponceau were used as loading controls. Quantification of B, p62 and C, LC3-I and LC3-II protein levels normalized to Ponceau and related to WT. Data are expressed as mean + s.e.m. with *P<0.05 and **P<0.01 vs. WT, unpaired Student’s t-test (Welch’s test). Number of animals is indicated in the bars. D, Heatmap of selected genes (threshold <0.8 or >1.2 fold change to WT) comparing gene expression of hypertrophy, fibrosis, calcium handling, autophagy and potassium and sodium regulation between WT and KI mice.
Figure 3
Figure 3. Impaired autophagic flux in KI and KO mice
Evaluation of the autophagic flux in hearts of KI and WT mice. Either 40 mg/kg leupeptin (inh., inhibitor) or sodium chloride was injected i.p. into mice. After 1 h, hearts were extracted. A, Representative Western blots of indicated proteins from ventricular protein extracts of KI and WT mice of indicated ages. Calsequestrin and Ponceau were used as loading controls. B, Quantification of LC3-II (normalized to calsequestrin) and LC3-II/LC3-I ratio of KI and WT mice of indicated ages. C, Evaluation of the autophagic flux in hearts of KO and WT mice. Representative Western blots of indicated proteins from ventricular protein extracts of 60-week-old KO and WT mice. Ponceau and Erk1/2 were used as loading controls. D, Quantification of LC3-II (normalized to Erk1/2) of 60-week-old KO and WT mice. Quantifications are related to WT control. Data are expressed as mean + s.e.m. with *P<0.05, **P<0.01 and ***P<0.001 vs. corresponding control, one-way ANOVA (Welch’s test) plus Tukey’s post-test. Number of animals is indicated in the bars.
Figure 4
Figure 4. Accumulation of residual bodies and glycogen granula in KI mice
Electron microscope images of (osmium-stained) left ventricular tissues of 60-week-old WT and KI mice. Electron-dense structures like lipids stain dark. A, Residual bodies (black vesicular structures). B, Glycogen granula (indicated by arrows).
Figure 5
Figure 5. Increased Akt-mTORC1 signaling in KI mice
Protein levels of phosphorylated mTOR (p-mTOR), mTOR, phosphorylated S6 (p-S6), S6, phosphorylated 4E-BP1 (p-4E-BP1), 4E-BP1, phosphorylated Akt (p-AktThr308 and p-AktSer473) and Akt in 60-week-old KI and WT mouse hearts. A, Representative Western blots of indicated proteins from mouse ventricular protein extracts (cytosolic fraction). α-actinin was used as loading control. Quantification of B, p-mTOR, mTOR and p-mTOR/mTOR, C, p-S6, S6 and p-S6/S6, D, p-4E-BP1, 4E-BP1 and p-4E-BP1/4E-BP1 and E, p-AktThr308, Akt, p-AktThr308/Akt, p-AktSer473 and p-AktSer473/Akt. Protein levels were normalized to α-actinin and related to WT. Data are expressed as mean + s.e.m. with *P<0.05, **P<0.01 vs. WT, unpaired Student’s t-test. Number of animals is indicated in the bars.
Figure 6
Figure 6. Partial rescue of cardiomyopathy by 9-week rapamycin treatment or caloric restriction in KI mice
Determination of cardiac function by echocardiography and parameters of hypertrophy and heart failure in KI and WT mice after 9-week rapamycin treatment (rapa), 40% caloric restriction (CR) or control treatment (ctrl). Mice were fed with chow containing either 2.24 mg/kg rapamycin or coating material (control). Mice on caloric restriction were fed with 60% of control diet. A, Fractional area shortening (FAS). B, Body weight (BW). C, Heart weight-to-tibia length ratio (HW/TL). D, Lung weight-to-tibia length ratio (LW/TL) E, Tibia length (TL). Data are expressed as mean + s.e.m. with *P<0.05, **P<0.01, and ****P<0.0001 vs. WT ctrl, and +P<0.05, ++P<0.01 and +++P<0.001 vs. KI ctrl, one-way ANOVA plus Tukey’s post-test. Number of animals is indicated in the bars.
Figure 7
Figure 7. Gene expression analysis and autophagic flux in rapamycin-treated or calorie-restricted KI and WT mice
KI and WT mice were treated for 9 weeks with either 2.24 mg/kg rapamycin (rapa), 40% caloric restriction (CR) or control treatment (ctrl). A, Heatmap of selected genes (threshold <0.8 or >1.2 fold change to KI ctrl) comparing gene expression of hypertrophy, fibrosis, calcium handling, autophagy and potassium and sodium regulation between KI ctrl, KI rapa or KI CR and WT ctrl mice. B, Representative Western blots of indicated proteins from mouse ventricular protein extracts (membrane-enriched fraction). α-actinin was used as loading control. C, LC3-II quantification (normalized to α-actinin) related to WT ctrl. Data are expressed as mean + s.e.m. with *P<0.05, **P<0.01 and ****P<0.0001 vs. WT ctrl, one-way ANOVA plus Dunnett’s post-test, and non-significant (NS) and +P<0.05 vs. indicated group (comparing with and without inhibitor), unpaired Student’s t-test. Number of animals is indicated in the bars.

References

    1. Rubinsztein DC. The roles of intracellular protein-degradation pathways in neurodegeneration. Nature. 2006;443:780–6. - PubMed
    1. Ravikumar B, Sarkar S, Davies JE, Futter M, Garcia-Arencibia M, Green-Thompson ZW, Jimenez-Sanchez M, Korolchuk VI, Lichtenberg M, Luo S, Massey DC, Menzies FM, Moreau K, Narayanan U, Renna M, Siddiqi FH, Underwood BR, Winslow AR, Rubinsztein DC. Regulation of mammalian autophagy in physiology and pathophysiology. Physiol Rev. 2010;90:1383–435. - PubMed
    1. Menzies FM, Fleming A, Rubinsztein DC. Compromised autophagy and neurodegenerative diseases. Nat Rev Neurosci. 2015;16:345–57. - PubMed
    1. Nishino I, Fu J, Tanji K, Yamada T, Shimojo S, Koori T, Mora M, Riggs JE, Oh SJ, Koga Y, Sue CM, Yamamoto A, Murakami N, Shanske S, Byrne E, Bonilla E, Nonaka I, DiMauro S, Hirano M. Primary LAMP-2 deficiency causes X-linked vacuolar cardiomyopathy and myopathy (Danon disease) Nature. 2000;406:906–10. - PubMed
    1. Danon MJ, Oh SJ, DiMauro S, Manaligod JR, Eastwood A, Naidu S, Schliselfeld LH. Lysosomal glycogen storage disease with normal acid maltase. Neurology. 1981;31:51–7. - PubMed