. 2017 Nov 30;91(24):e01080-17.
doi: 10.1128/JVI.01080-17. Print 2017 Dec 15.

Quiescence Promotes Latent HIV Infection and Resistance to Reactivation from Latency with Histone Deacetylase Inhibitors

Affiliations

Quiescence Promotes Latent HIV Infection and Resistance to Reactivation from Latency with Histone Deacetylase Inhibitors

Mark M Painter et al. J Virol. .

Abstract

Human immunodeficiency virus type 1 (HIV-1) establishes transcriptionally silent latent infections in resting memory T cells and hematopoietic stem and progenitor cells (HSPCs), which allows the virus to persist in infected individuals despite antiretroviral therapy. Developing in vitro models of HIV-1 latency that recapitulate the characteristics of latently infected cells in vivo is crucial to identifying and developing effective latency-reversing therapies. HSPCs exist in a quiescent state in vivo, and quiescence is correlated with latent infections in T cells. However, current models for culturing HSPCs and for infecting T cells in vitro require that the cells be maintained in an actively proliferating state. Here we describe a novel culture system in which primary human HSPCs cultured under hypothermic conditions are maintained in a quiescent state. We show that these quiescent HSPCs are susceptible to predominantly latent infection with HIV-1, while actively proliferating and differentiating HSPCs obtain predominantly active infections. Furthermore, we demonstrate that the most primitive quiescent HSPCs are more resistant to spontaneous reactivation from latency than more differentiated HSPCs and that quiescent HSPCs are resistant to reactivation by histone deacetylase inhibitors or P-TEFb activation but are susceptible to reactivation by protein kinase C (PKC) agonists. We also demonstrate that inhibition of HSP90, a known regulator of HIV transcription, recapitulates the quiescence and latency phenotypes of hypothermia, suggesting that hypothermia and HSP90 inhibition may regulate these processes by similar mechanisms. In summary, these studies describe a novel model for studying HIV-1 latency in human primary cells maintained in a quiescent state.IMPORTANCE Human immunodeficiency virus type 1 (HIV-1) establishes a persistent infection for which there remains no feasible cure. Current approaches are unable to clear the virus despite decades of therapy due to the existence of latent reservoirs of integrated HIV-1, which can reactivate and contribute to viral rebound following treatment interruption. Previous clinical attempts to reactivate the latent reservoirs in an individual so that they can be eliminated by the immune response or viral cytopathic effect have failed, indicating the need for a better understanding of the processes regulating HIV-1 latency. Here we characterize a novel in vitro model of HIV-1 latency in primary hematopoietic stem and progenitor cells isolated from human cord blood that may better recapitulate the behavior of latently infected cells in vivo This model can be used to study mechanisms regulating latency and potential therapeutic approaches to reactivate latent infections in quiescent cells.

Keywords: 17-AAG; HIV; HSP90; NF-κB; P-TEFb; bryostatin; histone deacetylase inhibitors; latency; quiescence; stem cells.


Figures

FIG 1
FIG 1
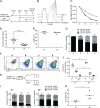
HSPCs cultured in vitro under hypothermic conditions are maintained in a quiescent state. (A) Schematic demonstrating the experimental process for panels B, C, F, and G. (B) Representative histogram for one donor, demonstrating the intensity of PKH26 staining in HSPCs following 6 days of culture as assessed by flow cytometry, where dilution of the PKH26 stain represents proliferation. Day 0, cells harvested immediately following PKH26 staining, prior to any dilution; unstained, cells never stained with PKH26 and harvested at 6 days postisolation. (C) Summary graph of flow cytometric data from 3 independent experiments performed as described for panel B, with the median fluorescence intensity of PKH26 normalized to that for condition A. (D) Summary graph depicting the fold change in cell number at each temperature over a 3-day culture period (****, P < 0.0001; Wilcoxon signed-rank test). (E) Summary graph depicting the viability of HSPCs, calculated as the percentage of events falling within both FSC/SSC and 7-AAD viability gates following 6 days of culture at the respective temperature. (F) Representative flow cytometric analysis of HSPCs cultured as shown in panel A and stained for the indicated surface markers. (G) Summary graph of flow cytometric data from 3 experiments performed as described for panel F, demonstrating the frequency of each of the indicated cellular subsets in the whole population. Mean values are shown, with error bars indicating standard deviations. (H) Schematic demonstrating the experimental process for panels I to K. (I) Summary graph of flow cytometric data from 3 experiments, demonstrating the frequency of each of the indicated cellular subsets in the whole population of HSPCs cultured at 30°C or 37°C postexpansion. Mean values are shown, with error bars indicating standard deviations. (J) Summary graph of flow cytometric data from HSPCs cultured as shown in panel H and harvested on day 4. HSPCs were stained with DAPI, and the frequency of each cell cycle phase was determined using FlowJo software (*, P < 0.05; Mann-Whitney tests). Each symbol represents an independent experiment using cells from a unique donor. (K) Summary graph of normalized flow cytometric data from panel J, displaying the ratio of cells in G1 phase to those in S phase (*, P < 0.05; Mann-Whitney test).
FIG 2
FIG 2
Assessing postintegration latency in HSPCs. (A) Schematic depicting the NL4-3-ΔGPE-GFP HIV-1 construct expressing GFP from the env open reading frame. (B) Schematic of the experimental setup for Fig. 3. (C) Representative flow cytometric plots of the latency reactivation assay used for Fig. 3, in which HSPCs infected at the indicated temperatures were sorted to remove actively infected cells and treated with TNF-α or a solvent control in the presence of raltegravir to ensure that the assay exclusively measured postintegration latency reactivation. (D) Representative flow cytometric plots for HSPCs infected as shown in panel B, with the addition of raltegravir at the time of infection. Numbers in the lower right corners represent frequencies of GFP+ cells at 3 days postinfection.
FIG 3
FIG 3
Quiescent HSPCs are susceptible to predominantly latent HIV-1 infections in vitro. (A) Summary graph of flow cytometric data from 15 experiments as in Fig. 2, where active infection is the frequency of GFP+ cells at 3 dpi and inducible latent infection is the frequency of GFP+ cells at 4 dpi following 24 h of TNF-α and raltegravir treatment. For this analysis, the frequency of spontaneous reactivation occurring in control cells treated with raltegravir and run in parallel was subtracted. (***, P < 0.001; ****, P < 0.0001; Wilcoxon signed-rank test). (B) Summary graph of flow cytometric data as in Fig. 2, comparing total frequencies of active and inducible latent infections in HSPCs cultured at the indicated temperatures (****, P < 0.0001; Wilcoxon signed-rank test). (C) Summary graph depicting the frequency of spontaneous reactivation in raltegravir-only samples normalized to the frequency of inducible infection resulting from 24 h of TNF-α stimulation (****, P < 0.0001; Wilcoxon signed-rank test). (D) Summary graph showing spontaneous reactivation, normalized as described for panel C, in each subset of HSPCs at the indicated temperatures. Numbers above the symbols indicate fold reductions in spontaneous reactivation frequency (****, P < 0.0001; Wilcoxon signed-rank test) (n = 15 for panels D to G).
FIG 4
FIG 4
Postintegration latency in quiescent cells is sustained for extended culture periods but easily reversible with removal from the quiescent state. (A) Schematic representation of the experimental workflow for panel B. (B) Summary graph of the frequencies of spontaneous reactivation 24 h after isolating GFP cells by FACS, normalized to TNF-α-inducible reactivation run in parallel, as shown in panel A (n = 5 or 6 distinct donors) (**, P < 0.01; Mann-Whitney tests). (C) Schematic representation of the experimental workflow for panel D. NT, no treatment. (D) Summary graph depicting the frequencies of inducible latent infection in HSPCs treated as shown in panel C. For this analysis, the frequency of spontaneous reactivation occurring in control cells treated with raltegravir and run in parallel was subtracted.
FIG 5
FIG 5
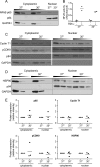
Expression and cellular localization of P-TEFb, NF-κB, and HSP90 fail to explain latency in quiescent HSPCs in vitro. (A, C, and D) Representative Western blots of lysates from HSPCs cultured at the indicated temperatures for 4 days postexpansion. The antibody to pCDK9 recognizes the activating phosphorylation at Thr186 (n = 4 distinct donors in separate experiments). p84 and GAPDH served as controls for separation of the nuclear and cytoplasmic fractions, respectively. Where indicated, fractions were loaded as serial dilutions for enhanced comparison. (B) Summary data from NF-κB p65 DNA-binding ELISA with whole-cell lysates from HSPCs cultured at the indicated temperatures for 4 days postexpansion and receiving no treatment (−) or stimulated with TNF-α (+) for 6 h (n = 2 or 3). Each symbol represents an independent experiment using cells from a unique donor. (E) Summary graphs of Western blot band intensity quantifications for Western blots performed as described for panels A, C, and D. The average pixel density of the band was normalized to the pixel density of the loading control for that sample and subsequently normalized to the relative intensity of the 37°C condition. Each symbol within a condition represents a band from a different gel for a distinct donor (n = 3 or 4 donors).
FIG 6
FIG 6
Inhibition of HSP90 by use of 17-AAG recapitulates latency and quiescence phenotypes of hypothermia. (A) Representative flow plots (upper panels) and summary graphs (lower panels) of PKH26 staining following 2 (left) or 4 (right) days of culture at the indicated temperature, with or without 17-AAG, as indicated. For the summary graphs, values were normalized to the 30°C plus 17-AAG condition (P < 0.05 for all comparisons; Mann-Whitney tests). (B) Summary graph depicting the fold change in cell number for each condition over a 3-day culture period (***, P < 0.001; Mann-Whitney tests). (C) Summary plots of flow cytometric data, depicting the frequency of viable cells after 2 or 4 days under each condition, based on inclusion in both FSC/SSC and 7-AAD viability gates. Each symbol represents an independent experiment using cells from a unique donor. (D) Summary graph of flow cytometric data from 3 experiments, demonstrating the frequency of each of the indicated cellular subsets in the whole population after 3 days under the corresponding conditions. Mean values are shown, with error bars indicating standard deviations. (E and F) Summary graphs of frequencies of spontaneous reactivation for cells cultured at the indicated temperatures for 3 days and treated as indicated for 24 h. Values were normalized to the amount of inducible infection by dividing the frequency of GFP+ cells in the solvent control by the frequency in TNF-α-stimulated cells run in parallel. (E) Connecting lines indicate samples from the same donor (n = 5 or 6). (F) Comparison of the effects of 24 h of treatment with 17-AAG or hypothermia on spontaneous reactivation. Temperature switching was performed as shown in Fig. 4A (n.s., not significant; **, P < 0.01; Mann-Whitney tests).
FIG 7
FIG 7
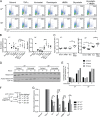
Latent HIV-1 infections in quiescent HSPCs are resistant to reactivation by HDAC inhibitors and HMBA but can be reactivated with bryostatin. (A) Representative flow cytometric plots of latently infected HSPCs treated for 24 h with the indicated latency-reversing compounds, as in Fig. 2. The frequency of GFP+ HSPCs is depicted in bold at the bottom right of each plot, with the mean fluorescence intensity (MFI) of GFP in the GFP+ cells shown in italics at the top right (n = at least 4 experiments). (B) Summary graphs of flow cytometric data as described for panel A. Spontaneous reactivation, as assessed by the frequency of GFP+ cells in the solvent control, was subtracted prior to normalization to the frequency of GFP+ cells in the TNF-α-stimulated sample (n.s., not significantly different from the solvent control; ****, P < 0.0001; Mann-Whitney tests). (C) Summary graphs of flow cytometric data as described for panel A, depicting the GFP MFI in the indicated GFP+ gate for each condition normalized to that of TNF-α-stimulated HSPCs (*, P < 0.05; **, P < 0.01; ****, P < 0.0001; Mann-Whitney tests). (D) Western blot of lysates of HSPCs cultured at the indicated temperatures for 3 days postexpansion and then treated with DMSO (solvent) or vorinostat and lysed at the indicated time posttreatment. (E) Quantification of the bands in panel D, performed by measuring the pixel density of each band for acetylated histone H4 and dividing it by that of total histone H4 for each sample. Data were normalized to the baseline proportion of acetylated histone H4 2 h after treatment with the solvent control for the respective temperature. (F) Schematic of the experimental setup used for panel G. (G) Summary graph of flow cytometric data from cells treated as shown in panel F, stimulated with the indicated reactivation regimen for 24 h, adjusted for spontaneous reactivation, and normalized as described for panel B. Columns indicate means, and error bars indicate standard deviations (n = at least 4) (n.s., not significant; *, P < 0.05; ****, P < 0.0001; Mann-Whitney tests). Solvent, matched DMSO sample.
FIG 8
FIG 8
Quiescence following inhibition of HSP90 restricts reactivation in the same way as that for hypothermia-induced quiescence. The summary graph shows flow cytometric data from cells cultured at the indicated temperature for 3 days and treated with the indicated latency reactivator for 24 h, as shown in Fig. 2. Background reactivation in the DMSO solvent control was subtracted from the value for each sample prior to normalization to the frequency of GFP+ cells in the TNF-α-stimulated control. Columns indicate means, and error bars indicate standard deviations (n = at least 3) (n.s., not significant; **, P < 0.01; Mann-Whitney tests).

References

    1. Chun T-W, Carruth L, Finzi D, Shen X, DiGiuseppe JA, Taylor H, Hermankova M, Chadwick K, Margolick J, Quinn TC. 1997. Quantification of latent tissue reservoirs and total body viral load in HIV-1 infection. Nature 387:183–188. doi:10.1038/387183a0. - DOI - PubMed
    1. Finzi D, Hermankova M, Pierson T, Carruth LM, Buck C, Chaisson RE, Quinn TC, Chadwick K, Margolick J, Brookmeyer R. 1997. Identification of a reservoir for HIV-1 in patients on highly active antiretroviral therapy. Science 278:1295–1300. doi:10.1126/science.278.5341.1295. - DOI - PubMed
    1. Finzi D, Blankson J, Siliciano JD, Margolick JB, Chadwick K, Pierson T, Smith K, Lisziewicz J, Lori F, Flexner C. 1999. Latent infection of CD4+ T cells provides a mechanism for lifelong persistence of HIV-1, even in patients on effective combination therapy. Nat Med 5:512–517. doi:10.1038/8394. - DOI - PubMed
    1. Zack JA, Arrigo SJ, Weitsman SR, Go AS, Haislip A, Chen IS. 1990. HIV-1 entry into quiescent primary lymphocytes: molecular analysis reveals a labile, latent viral structure. Cell 61:213–222. doi:10.1016/0092-8674(90)90802-L. - DOI - PubMed
    1. Brooks DG, Kitchen SG, Kitchen CM, Scripture-Adams DD, Zack JA. 2001. Generation of HIV latency during thymopoiesis. Nat Med 7:459–464. doi:10.1038/86531. - DOI - PubMed

MeSH terms

Substances

LinkOut - more resources