. 2017 Oct 11;8(1):861.
doi: 10.1038/s41467-017-00911-y.

HDAC6 inhibition reverses axonal transport defects in motor neurons derived from FUS-ALS patients

Affiliations

HDAC6 inhibition reverses axonal transport defects in motor neurons derived from FUS-ALS patients

Wenting Guo et al. Nat Commun. .

Abstract

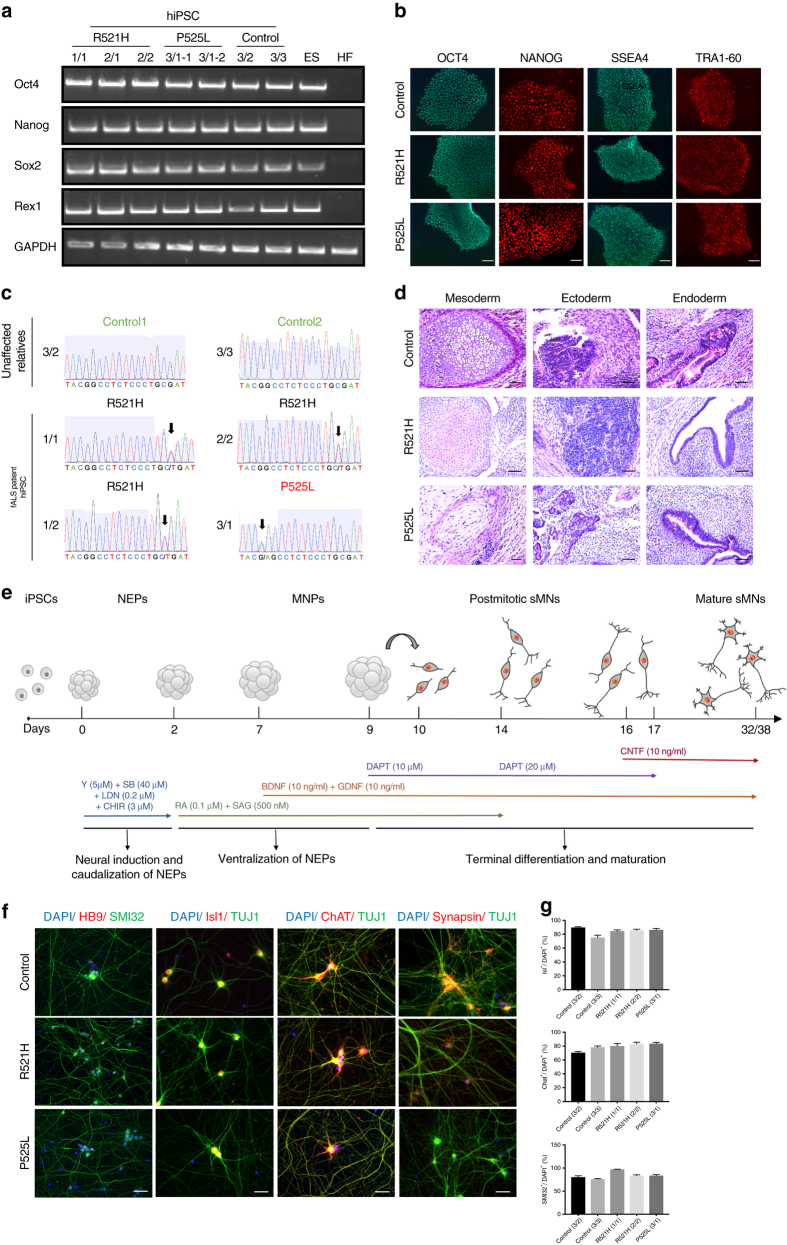
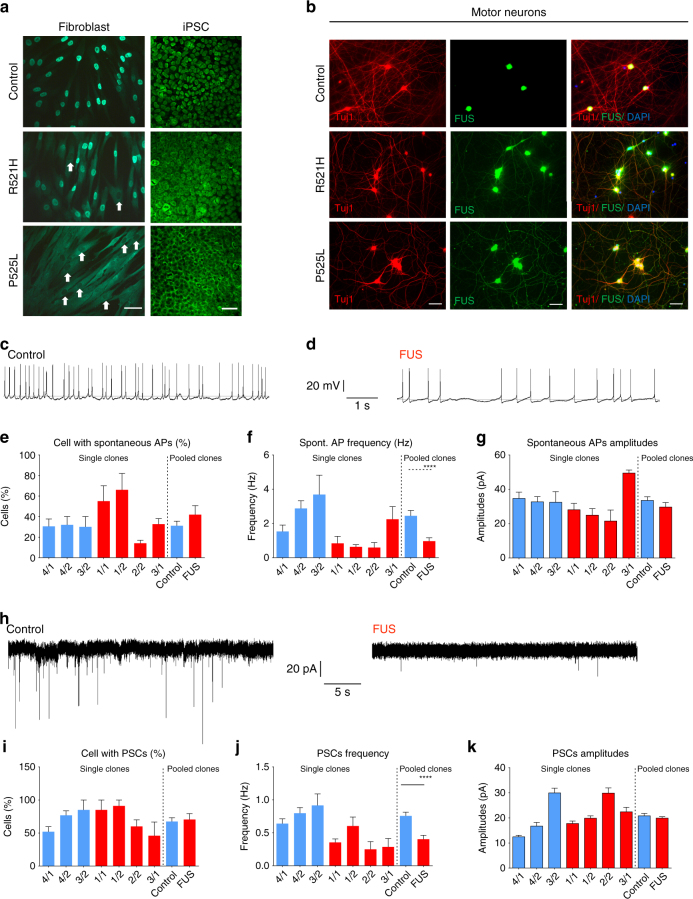
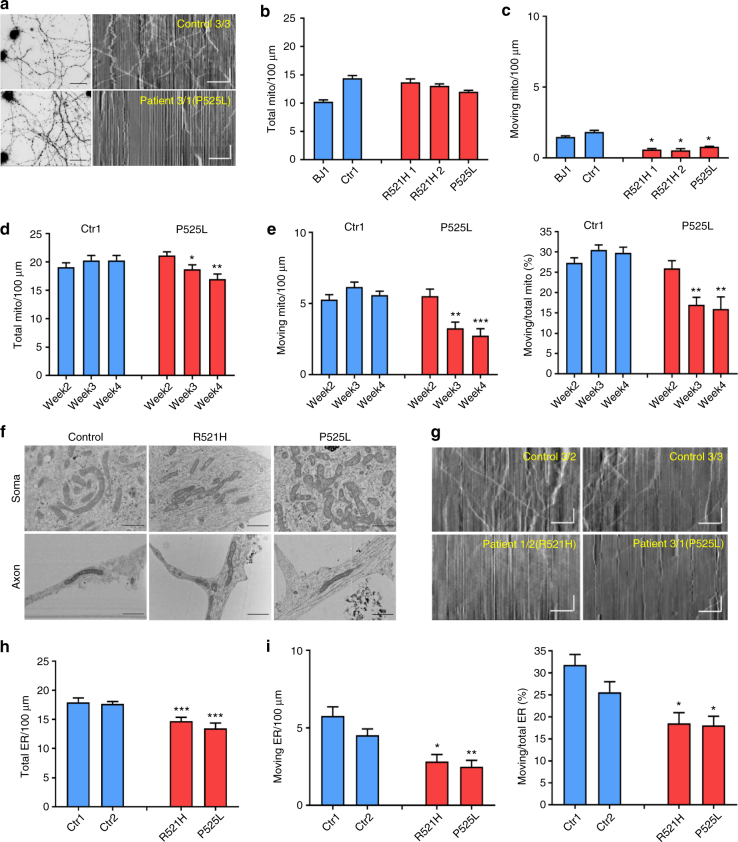
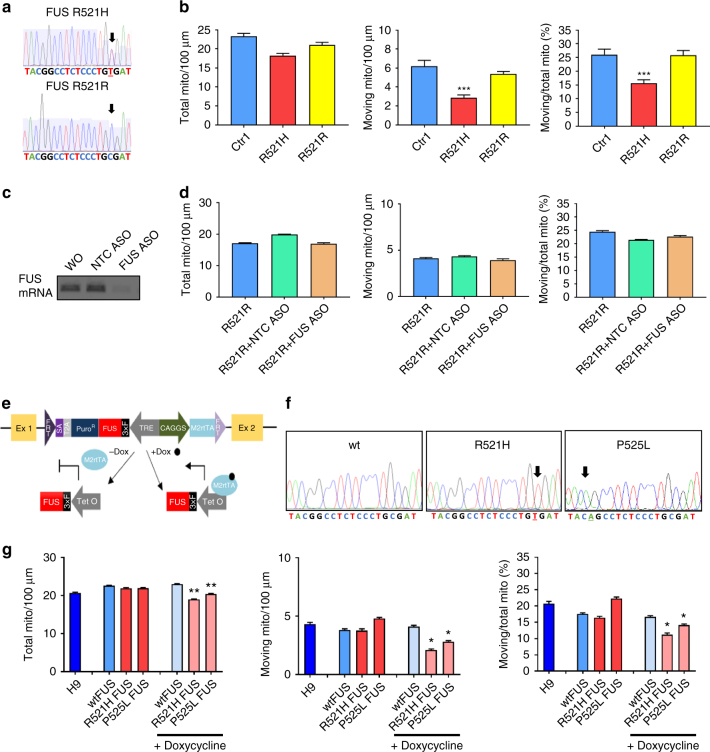
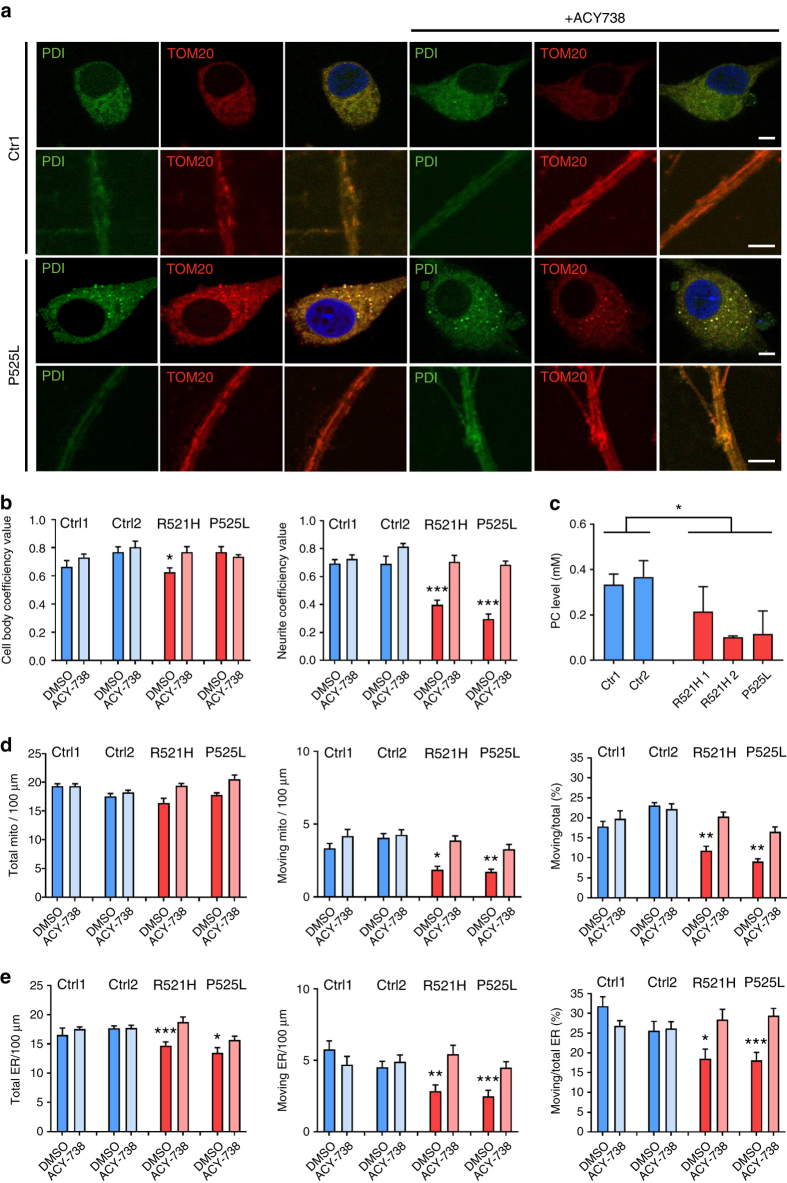
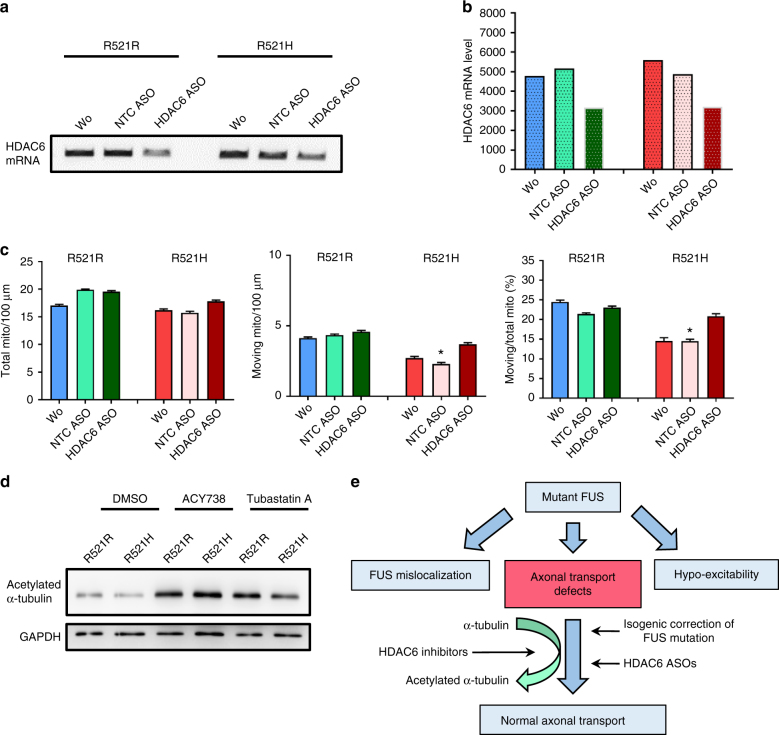
Amyotrophic lateral sclerosis (ALS) is a rapidly progressive neurodegenerative disorder due to selective loss of motor neurons (MNs). Mutations in the fused in sarcoma (FUS) gene can cause both juvenile and late onset ALS. We generated and characterized induced pluripotent stem cells (iPSCs) from ALS patients with different FUS mutations, as well as from healthy controls. Patient-derived MNs show typical cytoplasmic FUS pathology, hypoexcitability, as well as progressive axonal transport defects. Axonal transport defects are rescued by CRISPR/Cas9-mediated genetic correction of the FUS mutation in patient-derived iPSCs. Moreover, these defects are reproduced by expressing mutant FUS in human embryonic stem cells (hESCs), whereas knockdown of endogenous FUS has no effect, confirming that these pathological changes are mutant FUS dependent. Pharmacological inhibition as well as genetic silencing of histone deacetylase 6 (HDAC6) increase α-tubulin acetylation, endoplasmic reticulum (ER)-mitochondrial overlay, and restore the axonal transport defects in patient-derived MNs.Amyotrophic lateral sclerosis (ALS) leads to selective loss of motor neurons. Using motor neurons derived from induced pluripotent stem cells from patients with ALS and FUS mutations, the authors demonstrate that axonal transport deficits that are observed in these cells can be rescued by HDAC6 inhibition.


Conflict of interest statement

The authors declare no competing financial interests.

Figures

Fig. 1
Fig. 1
Generation and characterization of iPSCs and MNs from ALS patients and controls. a Semi-quantitative PCR of Oct4, Nanog, Sox2, and Rex1 in patient iPSCs, control iPSCs, human ESC (ES), and human fibroblasts (HF). b Immunocytochemical characterization of iPSCs for the pluripotency markers Tra1-60, SSEA4, Oct-4, and Nanog from 2/2, 3/1-2, and 3/2 lines. Scale bar = 50 µm. c Sequencing confirming the heterozygeous R521H and P525L FUS mutations in patient-derived iPSCs and the absence of FUS mutations in the control iPSC lines. d Hematoxylin–eosin staining identifying three germ layers in teratomas formed after iPSC injections in immunodeficient mice. Neural-like tissues represent ectoderm, cartilage represents mesoderm, and gut epithelium represents endoderm. e Schematic protocol of motor neuron differentiation. Y Y-27632, SB SB 431542, LDN LDN-193189, CHIR CHIR99021, RA retinoic acid, SAG smoothened agonist, DAPT a γ-secretase inhibitor, NEPs neuroepithelial stem cells, MNPs motor neuron progenitors, sMNs spinal motor neurons, BDNF brain-derived neurotrophic factor, GDNF glial cell line-derived neurotrophic factor, CNTF, ciliary neurotrophic factor. f Staining of different motor neuron markers (Hb9, Isl1, ChAT, SMI-32, Synapsin1), and DAPI in mutant FUS expressing and control cells at day 38. Scale bar = 50 µm. g Quantification of Isl1-positive (upper panel), ChAT-positive (middle panel), and SMI-32-positive (lower panel) cells expressed relative to the total number of DAPI-labeled cells. N = 10 images per line. Data are represented as mean ± SEM
Fig. 2
Fig. 2
ALS patient-derived MNs exhibit cytoplasmic FUS localization and hypoexcitability. a Immunostaining of FUS in fibroblasts and iPSCs from ALS patients and healthy controls. Nuclear clearance of FUS was observed in patient fibroblasts. White arrows highlight the nuclear clearance in patient fibroblasts carrying the R521H or P525L mutation. Scale bar = 70 µm. b Immunostaining of FUS and Tuj1 with DAPI in motor neurons derived from iPSCs of ALS patients and healthy controls at the fourth week of differentiation. Scale bar = 70 µm. c, d Representative traces of spontaneously occurring action potentials (APs) in healthy control and FUS iPSC-derived MNs during the seventh week of differentiation. eg Characterization of MNs differentiated from iPSCs with spontaneous APs. The relative number of cells (e n = 110 and n = 67 for control and patients, respectively), the frequency of spontaneous APs (f, n = 48 and n = 34 for control and patients, respectively, Mann–Whitney test, ****P value is 0.0001) and the amplitude (g n = 47 and n = 54 for control and patients, respectively) were measured. Data values represent mean ± SEM. h Representative traces of spontaneous postsynaptic currents (PSCs) in healthy control and FUS iPSC-derived MNs with typical MN appearance during the seventh week of differentiation. ik Quantification of the relative number of cells with PSCs (i n = 110 and n = 67 for control and patients, respectively), the PSC frequency (j n = 91 and n = 57 for control and patients, respectively, Mann–Whitney test, ****P value is 0.0001) and the PSC (k n = 91 and n = 57 for control and patients, respectively) amplitude in iPSCs-derived motor neurons from ALS patients and healthy controls
Fig. 3
Fig. 3
Progressive axonal transport defects in ALS patient-derived MNs. a Representative fluorescent micrograph from control and FUS-ALS patient-derived MNs loaded with MitoTracker-Red (left) and typical kymographs (control: 3/3; patient: 3/1) obtained from MNs (right). Stationary mitochondria are visible as straight vertical lines, while moving mitochondria are deflected as tilted lines. Scale bar time (vertical): 35 s; scale bar distance (horizontal): 25 μm. b Quantification of the number of stationary mitochondria normalized to a neurite length of 100 µm during 200 s for MNs derived from different iPSC lines at sixth to seventh week after starting MN differentiation (n = 5). Data values represent mean ± SEM. c Quantification of the number of moving mitochondria for MNs derived from different iPSC lines. d Quantification of stationary mitochondria for motor neurons derived from a patient with a P525L mutation and a control iPSC line as a function of time after plating (2 weeks, 3 weeks, 4 weeks after plating, n = 13 and n = 14 for patient and control, respectively). Data values represent mean ± SEM. e Quantification of moving mitochondria and ratio of moving to total mitochondria for motor neurons derived from a patient line (3/1) with a P525L mutation and a control iPSC line (3/2). f EM analysis of control (3/2) and patient (R521H: 2/2; P525L:3/1)-derived motor neurons at the fourth week after plating. Images of both soma and neurites are shown. Representative images from three independent experiments are presented. Scale bar = 100 nm. g Typical kymographs (control 1: 3/2; control 2: 3/3; R521H: 1/2; P525L: 3/1) obtained from motor neurons loaded with ER Tracker-Red. Scale bar time (vertical): 35 s; scale bar distance (horizontal): 25 μm. h Quantification of stationary ER vesicles from MNs derived from patients with P525L or R521H mutations and control iPSC lines at the fourth week after plating (n = 10, n = 11, n = 12, n = 11 for Ctr1, Ctr2, R521H, and P525L, respectively). Data values represent mean ± SEM. i Quantification of moving ER vesicles and ratio of moving to total ER vesicles for MNs derived from patients with P525L or R521H mutations and control iPSC lines (data are plotted as mean ± SEM; one-way ANOVA with post-hoc Tukey’s test, *, **, ***P values of 0.05, 0.01, and 0.001, respectively). Data values represent mean ± SEM
Fig. 4
Fig. 4
Axonal transport defects are caused by mutant FUS. a Genomic DNA sequencing showing the nucleotide change (C to T) in the R521H patient line (labeled as FUS R521H) and the homozygous nucleotide C in the corrected isogenic control iPSC line (labeled as FUS R521R). b Quantifications of total mitochondria, moving mitochondria, and ratio between moving to total mitochondria normalized to a neurite length of 100 µm during 200 s in motor neurons derived from a control iPSC line, from a patient iPSC line with the R521H mutation and its isogenic control measured at 4 weeks after plating. (n = 11, n = 14, n = 12, respectively, for wildtype, mutant, and isogenic control, mean ± SEM; one-way ANOVA with post-hoc Tukey’s test). c RT-PCR validation of ASO knockdown of FUS in motor neurons. d Knockdown of FUS did not interfere with total number of mitochondria, moving mitochondria, and mitochondrial transport efficiency. Scrambled ASO was used as a negative control (NTC ASO). n = 20, n = 19, n = 17 for R521R, R521R + NTCASO, R521R + FUS ASO, respectively. Data values represent mean ± SEM. e Schematic diagram of the strategy used for inducible expression of FUS in the AAVS1 site using recombinase-mediated cassette exchange (RMCE) and the targeting vector pZ: F3‐P TetOn-3 × F-FUS-F flanked by short flippase recognition targets (FRTs) in the engineered H9-hESC line. This vector also contains a Tet-On system. Adding doxycycline (Dox) to the medium results in its binding to the M2 tetracycline transactivator (M2rTA) protein. This Dox–M2rtTA complex is capable of binding the Tet operator (TetO), which is part of the tetracycline response element (TRE), to trigger FUS expression. f DNA sequencing showing homozygous wildtype FUS, mutant FUS carrying the R521H or the P525L mutation in the hESC lines that can overexpress FUS. g Calculations of stationary mitochondria, moving mitochondria, ratio of moving to total mitochondria per 100 µm neurite length during 200 s for motor neurons derived from hESCs at the fourth week after plating. Only overexpression of mutant FUS induces mitochondrial transport defects (n = 12, n = 15, n = 12, n = 13, n = 14, n = 11, n = 14, respectively, for H9, wtFUS, R521H FUS, P525L FUS, wtFUS + Dox, R521H FUS + Dox, P525L FUS + Dox, mean ± SEM, one-way ANOVA with post-hoc Tukey’s test, *, **, ***P values of 0.05, 0.01, and 0.001, respectively)
Fig. 5
Fig. 5
Restoration of axonal transport and of ER-mitochondrial overlay by HDAC6 inhibition. a Immunostaining for ER (using mouse PDI antibody) and mitochondria (using rabbit TOM-20 antibody) of motor neurons derived from iPSC from patients carrying the P525L mutation and healthy controls before and after an overnight treatment with ACY-738 (1 μM). The separate views show co-localized pixels in the cell body and neurites. Scale bar = 5 µm. b Quantification of the proportion of ER-merged regions and mitochondrial-merged regions relative to the total mitochondrial staining. Data were analyzed by determining the Pearson’s correlation coefficient using ImageJ (n = 20, mean ± SEM, one-way ANOVA with post-hoc Tukey’s test, *, ***P values of 0.05 and 0.001). c Phosphatidylcholine (PC) level in culture media from motor neuron. Media were taken for ELISA after 2 days on the culture at the fourth week after the start of differentiation. A decrease was observed in patient-derived motor neurons. Representative experiment is shown (mean of technical duplicates ± SD). d Quantification of stationary mitochondria, moving mitochondria, and ratio between moving to total mitochondria normalized to a neurite length of 100 µm in motor neurons derived from patient and healthy control iPSC lines at the fourth week after plating with or without an overnight treatment with ACY-738 (n = 18, n = 16, n = 15, n = 18, n = 15, n = 13, n = 17, n = 13 for Ctr1 + DMSO, Ctr1 + ACY-738, Ctr2 + DMSO, Ctr2 + ACY-738, R521H + DMSO, R521H + ACY-738, P525L + DMSO, P525L + ACY-738, respectively, mean ± SEM, one-way ANOVA with post-hoc Tukey’s test; *, **P values of 0.05 and 0.01, respectively). e Quantification of stationary ER vesicles, moving ER vesicles, and ratio between moving to total vesicles normalized to a neurite length of 100 µm in motor neurons derived from patient and healthy control iPSC lines at the fourth week after plating with or without an overnight treatment with ACY-738 (n = 10, n = 19, n = 11, n = 18, n = 12, n = 12, n = 11, n = 16 for Ctr1 + DMSO, Ctr1 + ACY-738, Ctr2 + DMSO, Ctr2 + ACY-738, R521H + DMSO, R521H + ACY-738, P525L + DMSO, P525L + ACY-738, respectively, mean ± SEM, one-way ANOVA with post-hoc Tukey’s test; *, **, ***P values of 0.05, 0.01, and 0.001, respectively)
Fig. 6
Fig. 6
Effect of genetic HDAC6 knockdown and increased acetylation levels of α-tubulin by HDAC6 inhibition. a RT-PCR validation of knockdown by an antisense oligonucleotide (ASO) against HDAC6 in MNs. b Quantification of the RT-PCR results of the gel shown in a illustrating the HDAC6 knockdown by the ASO. c Knockdown of HDAC6 using an ASO in patient-derived MNs increased axonal transport based on tracking mitochondrial movement (total number, moving number, and ratio between total and moving mitochondria). Scrambled ASO was used as a negative control (NTC ASO). n = 20, n = 19, n = 18, n = 10, n = 11, n = 10 for R521R, R521R + NTC ASO, R521R + HDAC6 ASO, R521H, R521H + NTC ASO, R521H + HDAC6 ASO, respectively; ANOVA with post-hoc Tukey’s test, *P value of 0.05. d Western blot from MNs (R521H mutant line 2/2 and isogenic control R521R), with and without treatment with ACY-738 or Tubastatin A at day 31 of differentiation. The blot was probed with antibodies directed to acetylated α-tubulin, and GAPDH. e Schematic representation of our results indicating that HDAC6 inhibition rescues axonal transport defects in FUS-iPSC-derived motor neurons through increasing acetylation levels of α-tubulin

Comment in

References

    1. Renton AE, Chiò A, Traynor BJ. State of play in amyotrophic lateral sclerosis genetics. Nat. Neurosci. 2014;17:17–23. doi: 10.1038/nn.3584. - DOI - PMC - PubMed
    1. Bensimon G, Lacomblez L, Meininger V. A controlled trial of riluzole in amyotrophic lateral sclerosis. ALS/Riluzole Study Group. N. Engl. J. Med. 1994;330:585–591. doi: 10.1056/NEJM199403033300901. - DOI - PubMed
    1. Poppe L, Rué L, Robberecht W, Van Den Bosch L. Translating biological findings into new treatment strategies for amyotrophic lateral sclerosis (ALS) Exp. Neurol. 2014;262:138–151. doi: 10.1016/j.expneurol.2014.07.001. - DOI - PubMed
    1. Arbab M, Baars S, Geijsen N. Modeling motor neuron disease: the matter of time. Trends Neurosci. 2014;37:642–652. doi: 10.1016/j.tins.2014.07.008. - DOI - PubMed
    1. Lanson NA, Pandey UB. FUS-related proteinopathies: lessons from animal models. Brain Res. 2012;1462:44–60. doi: 10.1016/j.brainres.2012.01.039. - DOI - PubMed

Publication types