. 2017 Oct 11;7(1):12959.
doi: 10.1038/s41598-017-13311-5.

Human TAUP301L overexpression results in TAU hyperphosphorylation without neurofibrillary tangles in adult zebrafish brain

Affiliations

Human TAUP301L overexpression results in TAU hyperphosphorylation without neurofibrillary tangles in adult zebrafish brain

Mehmet I Cosacak et al. Sci Rep. .

Abstract

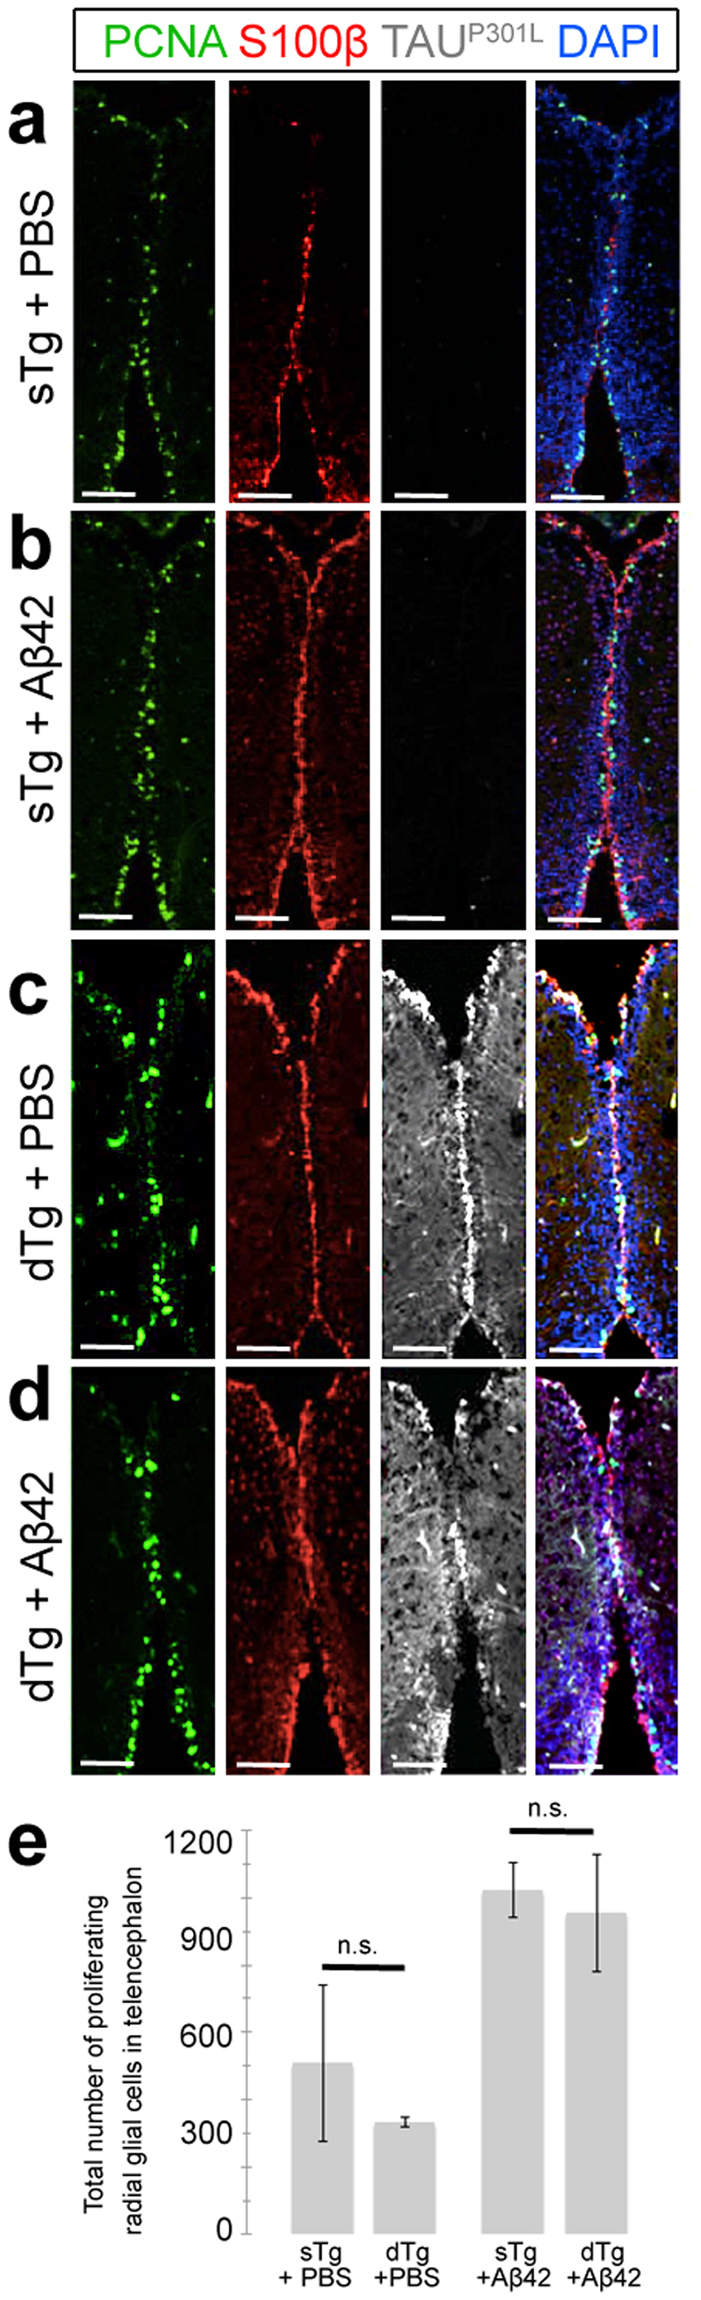
Microtubule-associated TAU protein is a pathological hallmark in Alzheimer's disease (AD), where hyperphosphorylation of TAU generates neurofibrillary tangles. To investigate the effects of TAU in a regenerative adult vertebrate brain system, we generated a cre/lox-based transgenic model of zebrafish that chronically expresses human TAUP301L, which is a variant of human TAU protein that forms neurofibrillary tangles in mouse models and humans. Interestingly, we found that although chronic and abundant expression of TAUP301L starting from early embryonic development led to hyperphosphorylation, TAUP301L did not form oligomers and neurofibrillary tangles, and did not cause elevated apoptosis and microglial activation, which are classical symptoms of tauopathies in mammals. Additionally, TAUP301L neither increased neural stem cell proliferation nor activated the expression of regenerative factor Interleukin-4, indicating that TAUP301L toxicity is prevented in the adult zebrafish brain. By combining TAUP301L expression with our established Aβ42 toxicity model, we found that Aβ42 ceases to initiate neurofibrillary tangle formation by TAUP301L, and TAUP301L does not exacerbate the toxicity of Aβ42. Therefore, our results propose a cellular mechanism that protects the adult zebrafish brain against tauopathies, and our model can be used to understand how TAU toxicity can be prevented in humans.


Conflict of interest statement

The authors declare that they have no competing interests.

Figures

Figure 1
Figure 1
(a) Naming of transgenic constructs: sTg – effector transgenic, dTg – double transgenic. (b) Scheme for timing of recombination and analyses. (c) sTg and dTg animals (5 days post fertilization) treated with tamoxifen. DsRed expression indicates the presence of the effector cassette. Note the recombination in the central nervous system by GFP expression. (d) Immunohistochemistry (IHC) for GFP and TAUP301L on coronal sections of telencephalon of a 6 month-old sTg animal. Single channel images of the whole section for GFP (d’) and TAU (d”). (1) is the enlarged view of the inset in d. (e) IHC for GFP and TAUP301L on coronal sections of telencephalon of a 6-month old dTg animal. Single channel images of the whole section for GFP (e’) and TAU (e”). (2) is the enlarged view of the inset in f. (f) IHC for HuC/D and TAUP301L on coronal sections of telencephalon of an sTg animal. Single channel images of the whole section for TAU (f’) and HuC/D (f”). (3) is the enlarged view of the inset in f. (g) IHC for HuC/D and TAUP301L on coronal sections of telencephalon of a dTg animal. Single channel images of the whole section for TAU (g’) and HuC/D (g”). (4) is the enlarged view of the inset in g. (h) Western blot analyses for expression of TAUP301L (left) and hyperphosphorylated TAUP301L (right) in telencephalon. Beta actin is used as a loading control. (i) IHC for GFP and AT8 in a dTg animal. Individual channels are shown for GFP (i’) and AT8 (i”). Arrows represent the cytoplasmis signal. (j) IHC for TAUP301L and T205 in a dTg animal. Individual channels are shown for TAUP301L (j’) and T205 (j”). (k) Gallyas silver (black) and Hematoxylin (pink) staining in telencephalon of a dTg animal. (k’) Enlarged region in k’. Note the absence of Gallyas silver-positive cells. (l) Positive control for Gallyas silver staining in human neurons treated with Amyloid, showing neurofibrillary tangles. (m) Immunohistochemistry for TAUP301L (green) combined with TUNEL detection of apoptotic cells (red) in recombined 6 months old dTg animals. Individual fluorescent channels are shown in m’ and m”. (np) Higher magnification images from the insets in m. (q) Quantification of TUNEL-positive cells in the telencephalon in sTg and dTg animals. (r) Quantification of apoptotic cells containing hyperphosphorylated TAUP301L (T205-positive). Values represent mean ± s.e.m. *p < 0.05, **p < 0.01, ***p < 0.005. Scale bars equal 10 μm (i–j’) and 50 μm elsewhere. n = 6 fish and > 30 histological sections for every staining. Larvae are 5 days old, and adult animals are 6 months old.
Figure 2
Figure 2
(a) Immunohistochemistry (IHC) for L-Plastin (red) and TAUP301L (green) on coronal sections of telencephalon of a 6 month-old sTg animal. Single channel images of the whole section for TAUP301L (a’) and L-Plastin (a”). (b) The enlarged view of the inset in a. (c) IHC for L-Plastin (red) and TAUP301L (green) on coronal sections of telencephalon of a 6-month old dTg animal. Single channel images of the whole section for TAUP301L (c’) and L-Plastin (c”). (d) The enlarged view of the inset in c. (e) Quantification of round and ramified L-Plastin-positive cells in the telencephalon in sTg and dTg animals. (f) Immunohistochemistry (IHC) for S100β (red), PCNA (green) and TAUP301L (white) on coronal sections of telencephalon of a 6-month old sTg animal. Single channel images of the whole section for S100β (F’), PCNA (f”), and TAUP301L (f”’). (g) IHC for S100β (red), PCNA (green) and TAUP301L (white) on coronal sections of telencephalon of a 6-month old dTg animal. Single channel images of the whole section for S100β (g’), PCNA (g”), and TAUP301L (g”’). (h) The enlarged view of the inset in f. (i) The enlarged view of the inset in g. (j) Quantification of the total number of proliferating glial cells in the telencephalon of sTg and dTg animals. Values represent mean ± s.e.m. *p < 0.05, **p < 0.01, ***p < 0.005. Scale bars equal 50 μm (a–g”’) and 20 μm (h,i). n = 7 fish and > 30 histological sections for every staining. All animals are 6 months old.
Figure 3
Figure 3
Immunohistochemistry for PCNA (green), S100β (red), and TAUP301L (white) on coronal sections of telencephalon of a 6 month-old sTg animal injected with PBS (a), sTg animal injected with Aβ42 (b), dTg animal injected with PBS (c), and dTg animal injected with Aβ42 (d). (e) Quantification of the total number of proliferating radial glial cells in the telencephalon of sTg and dTg animals injected with PBS or Aβ42. Values represent mean ± s.e.m. *p < 0.05, **p < 0.01, ***p < 0.005. Scale bars equal 100 μm. n = 5 fish and > 20 histological sections for every staining. All animals are 6 months old.
Figure 4
Figure 4
(a) Immunohistochemistry (IHC) for TAUP301L (red), GFP (green) and L-Plastin (white) on coronal sections of telencephalon of a 6 month-old sTg animal injected with PBS (a), sTg animal injected with Aβ42 (b), dTg animal injected with PBS (c), and dTg animal injected with Aβ42 (d). Insets below the panels show individual fluorescent channels for TAUP301L (red), GFP (green) and L-Plastin (white). Columns 1–4 are single and merged images of the regions indicated in (a–d), respectively. (e) Quantification of the total number of ramified and round L-Plastin-positive cells in the telencephalon of sTg and dTg animals injected with PBS or Aβ42. (f–g) Immunohistochemistry for Interleukin-4 (red) on coronal sections of telencephalon of a 6-month old dTg animal injected with PBS (f) or with Aβ42 (g). (h) Relative change in the expression levels of il4 after Aβ42 injection compared to control injection. Medial ventricular regions are shown. DAPI (cyan) marks the nuclei. Values represent mean ± s.e.m. *p < 0.05, **p < 0.01, ***p < 0.005. Scale bars equal 50 μm. n = 6 fish and > 30 histological sections for every staining. All animals are 6 months old.
Figure 5
Figure 5
Schematic comparison of the effects of TAU in mammalian and zebrafish brain.

References

    1. Iqbal K, Liu F, Gong CX. Tau and neurodegenerative disease: the story so far. Nat Rev Neurol. 2016;12:15–27. doi: 10.1038/nrneurol.2015.225. - DOI - PubMed
    1. Iqbal K, et al. Tau pathology in Alzheimer disease and other tauopathies. Biochim Biophys Acta. 2005;1739:198–210. doi: 10.1016/j.bbadis.2004.09.008. - DOI - PubMed
    1. Hutton M, et al. Association of missense and 5′-splice-site mutations in tau with the inherited dementia FTDP-17. Nature. 1998;393:702–705. doi: 10.1038/31508. - DOI - PubMed
    1. Spillantini MG, et al. Mutation in the tau gene in familial multiple system tauopathy with presenile dementia. Proc Natl Acad Sci USA. 1998;95:7737–7741. doi: 10.1073/pnas.95.13.7737. - DOI - PMC - PubMed
    1. Poorkaj P, et al. Tau is a candidate gene for chromosome 17 frontotemporal dementia. Ann Neurol. 1998;43:815–825. doi: 10.1002/ana.410430617. - DOI - PubMed

Publication types

MeSH terms

LinkOut - more resources