. 2017 Oct 11;8(1):862.
doi: 10.1038/s41467-017-00866-0.

Non-canonical reader modules of BAZ1A promote recovery from DNA damage

Affiliations

Non-canonical reader modules of BAZ1A promote recovery from DNA damage

Mariano Oppikofer et al. Nat Commun. .

Abstract

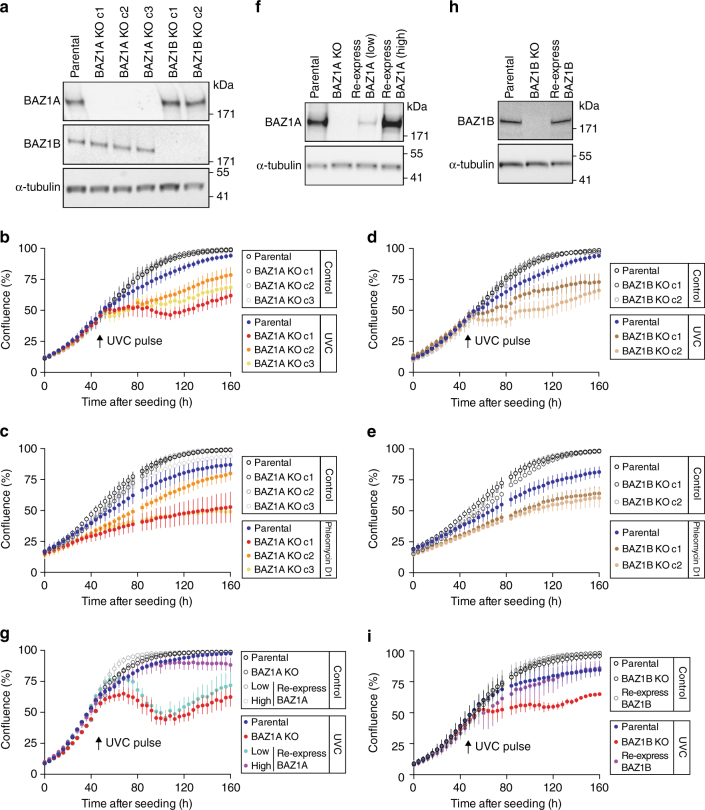
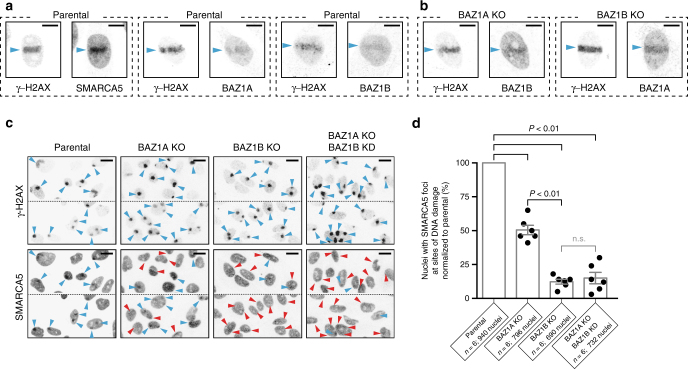
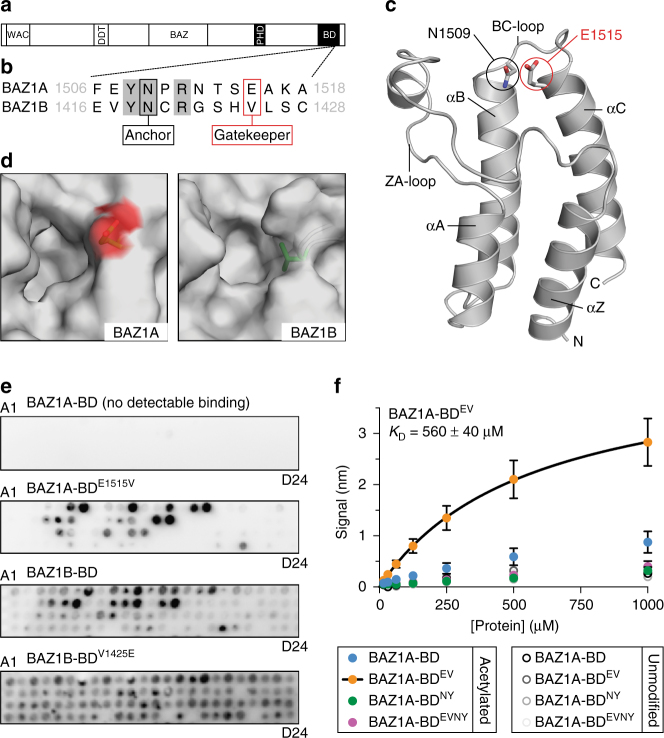
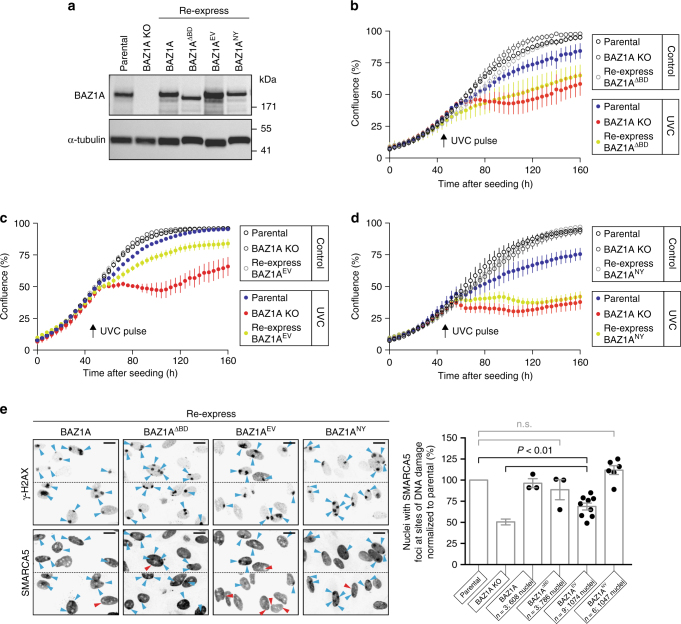
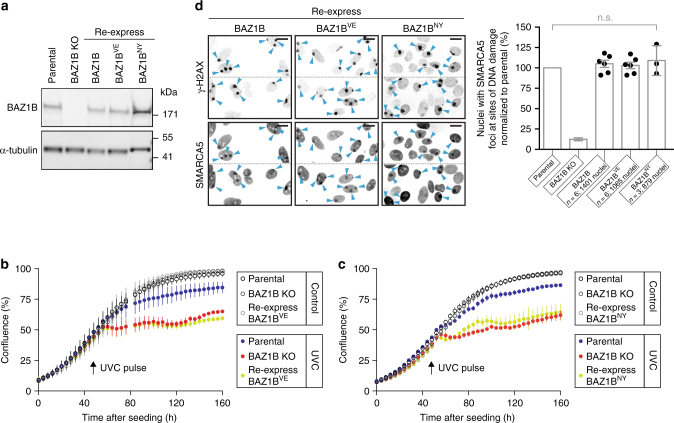
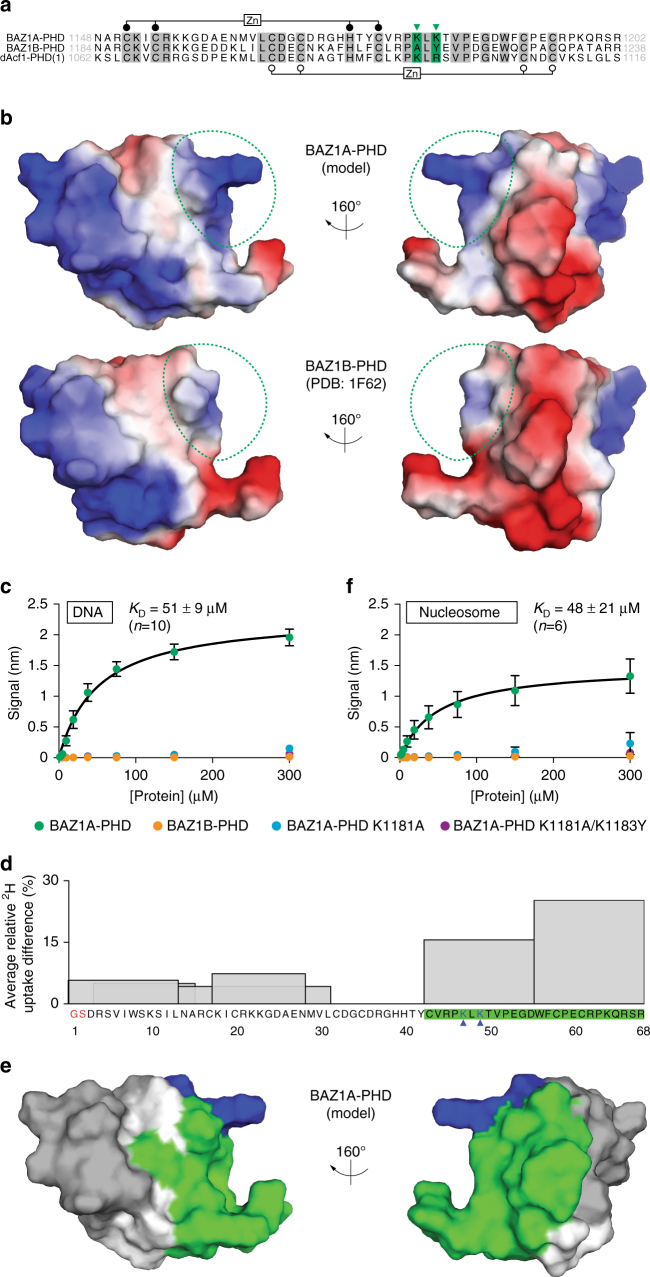
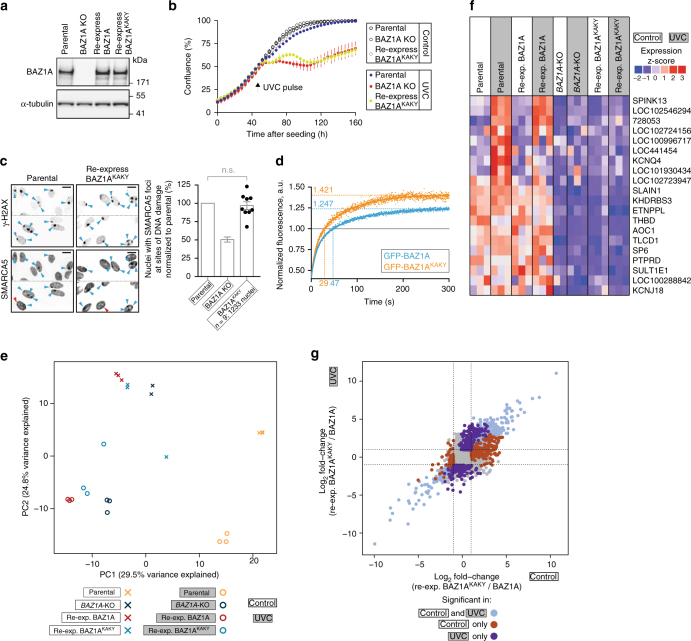
Members of the ISWI family of chromatin remodelers mobilize nucleosomes to control DNA accessibility and, in some cases, are required for recovery from DNA damage. However, it remains poorly understood how the non-catalytic ISWI subunits BAZ1A and BAZ1B might contact chromatin to direct the ATPase SMARCA5. Here, we find that the plant homeodomain of BAZ1A, but not that of BAZ1B, has the unusual function of binding DNA. Furthermore, the BAZ1A bromodomain has a non-canonical gatekeeper residue and binds relatively weakly to acetylated histone peptides. Using CRISPR-Cas9-mediated genome editing we find that BAZ1A and BAZ1B each recruit SMARCA5 to sites of damaged chromatin and promote survival. Genetic engineering of structure-designed bromodomain and plant homeodomain mutants reveals that reader modules of BAZ1A and BAZ1B, even when non-standard, are critical for DNA damage recovery in part by regulating ISWI factors loading at DNA lesions and supporting transcriptional programs required for survival.ISWI chromatin remodelers regulate DNA accessibility and have been implicated in DNA damage repair. Here, the authors uncover functions, in response to DNA damage, for the bromodomain of the ISWI subunit BAZ1B and for the non-canonical PHD and bromodomain modules of the paralog BAZ1A.


Conflict of interest statement

All authors are or were employees of Genentech, Inc. The authors declare no competing financial interests.

Figures

Fig. 1
Fig. 1
The non-catalytic ISWI subunits BAZ1A and BAZ1B promote cell growth after DNA damage. a Western blot analysis of BAZ1A and BAZ1B expression in parental and genome edited BAZ1A-KO and BAZ1B-KO HeLa cells. Individual clones are labeled “c1” to “c3”. b Confluence of BAZ1A-KO clonal lines c1, c2, and c3 measured over time, before and after a pulse of UVC light. c Confluence of BAZ1A-KO clonal lines c1, c2, and c3 measured over time in presence of 20 μM phleomycin D1. d Same as b but for BAZ1B-KO clonal lines c1 and c2. e Same as c but for BAZ1B-KO clonal lines c1 and c2. f Western blot analysis of BAZ1A expression in parental, BAZ1A-KO (clone c1) and two independent BAZ1A-KO clones where BAZ1A was re-expressed at “low” and “high” levels by lentiviral integration of the cDNA of BAZ1A. g Rescue of growth defect of BAZ1A KO by “low” and “high” levels of BAZ1A expression. The experiment was performed as described for b. h Western blot analysis of BAZ1B expression in parental, BAZ1B-KO (clone c2) and a clonal line where BAZ1B was re-expressed by lentiviral integration of the cDNA of BAZ1B. i Rescue of growth defect of BAZ1B KO by BAZ1B re-expression. The experiment was performed as described for b. Each time point shown for be, g and i is the mean value ± s.e.m from three independent experiments
Fig. 2
Fig. 2
BAZ1A and BAZ1B accumulate independently to sites of DNA damage and recruit SMARCA5. a Accumulation of endogenous SMARCA5, BAZ1A, and BAZ1B at sites of laser micro-irradiation in parental HeLa cells. The genetic background is indicated on top of the panels. Regions of DNA damage are identified by the presence of γ-H2AX (histone variant H2A.X phosphorylated on S139), and are labeled with cyan arrowheads. Images are representative of at least five individual irradiated cells. Scale bar, 10 μm. b Accumulation of endogenous BAZ1A and BAZ1B at sites of laser micro-irradiation in genome edited BAZ1A-KO and BAZ1B-KO cells. Scale bar, 10 μm. c Accumulation of endogenous SMARCA5 at sites of DNA damage in cells subjected to UVC irradiation through a 5 μm porous membrane. Each square panel is composed of two rectangular representative images showing 6–10 nuclei. The genetic background is indicated on top of the panels. Cyan arrowheads indicate sites of damage identified by the presence of γ-H2AX (top), with concomitant increased SMARCA5 signal (bottom). In contrast, red arrowheads indicate sites of damage without appreciable corresponding SMARCA5 signal. Scale bar, 20 μm. d Recruitment of SMARCA5 as quantified from six independent experiments is shown as histograms of the mean value ± s.e.m and normalized to recruitment in parental cells; the total number of nuclei examined for each case is reported on the figure. The values from individual experiments are shown with black dots. P-values (P < 0.01) were calculated using a two-tailed Mann–Whitney test; n.s. not significant (P > 0.05)
Fig. 3
Fig. 3
A non-canonical glutamic acid “gatekeeper” residue reduces the affinity of BAZ1A-BD for acetylated histone peptides. a Schematic representation of the BAZ1A and BAZ1B proteins. b Sequence of BAZ1A-BD and BAZ1B-BD surrounding the “anchor” and the “gatekeeper” residues; amino-acid boundaries are indicated. c Cartoon representation of BAZ1A-BD from the 1.7 Å resolution crystal structure (Table 1). d Top view of the binding pockets of BAZ1A-BD and BAZ1B-BD (model) in surface representation. The side chains of the gatekeeper residues are shown in stick representation with carbon atoms colored green and the oxygen atoms of the negatively charged BAZ1A-BD E1515 shown in red. e Representative examples of histone peptide array binding images for BAZ1A-BD, BAZ1A-BDE1515V, BAZ1B-BD, and BAZ1B-BDV1425E protein modules. Refer to Supplementary Fig. 3c, d for peptide array information. f Biolayer interferometry binding study of wild-type BAZ1A-BD, BAZ1A-BDE1515V (BDEV), BAZ1A-BDN1509Y (BDNY), or the double mutant BAZ1A-BDE1515V/N1509Y (BDEVNY). Steady-state binding was determined using biotinylated histone H4 1–19, either with or without acetylation of the four lysines present (see “Methods”). Each data point is the mean value ± s.e.m from four independent experiments. The fitted K D for BAZ1A-BDE1515V was determined from the averaged data and reported ± standard error
Fig. 4
Fig. 4
The BD of BAZ1A promotes DNA damage recovery but is not required for SMARCA5 recruitment. a Western blot analysis of BAZ1A expression in parental, BAZ1A-KO, and BAZ1A-KO cells engineered to re-express wild-type BAZ1A, or the mutants BAZ1AΔBD (1–1424), BAZ1AEV (E1515V), and BAZ1ANY (N1509Y). bd Confluence of the indicated cell line measured over time, before, and after a pulse of UVC light. e Accumulation of endogenous SMARCA5 at sites of DNA damage as in Fig. 2c, d. Scale bar, 20 μm. Histograms represent the mean value ± s.e.m normalized to recruitment in parental cells. P-values (P < 0.01) were calculated using a two-tailed Mann–Whitney test; n.s. not significant (P > 0.05)
Fig. 5
Fig. 5
The BD of BAZ1B is important for DNA damage recovery but dispensable for SMARCA5 recruitment. a Western blot analysis of BAZ1B expression in parental, BAZ1B-KO and BAZ1B-KO cells engineered to re-express wild-type BAZ1B, or the mutants BAZ1BVE (V1425E) and BAZ1BNY (N1419Y). b, c Confluence of the indicated cell line measured over time, before, and after a pulse of UVC light. d Accumulation of endogenous SMARCA5 at sites of DNA damage as in Fig. 2c, d. Scale bar, 20 μm. Histograms represent the mean value ± s.e.m normalized to recruitment in parental cells. P-values were calculated using a two-tailed Mann–Whitney test; n.s. not significant (P > 0.05)
Fig. 6
Fig. 6
The PHD module of BAZ1A binds free and nucleosomal DNA. a Sequence alignment of the PHD modules of BAZ1A, BAZ1B, and the most N-terminal PHD module of dAcf1 amino acid boundaries are indicated, and identical residues are highlighted in gray. Filled and open circles indicate the Zn-binding Cys4HisCys3 motif characteristic of the PHD fold. Green arrowheads indicate K1181 and K1183 that are required for BAZ1A-PHD to bind DNA. b Electrostatic surface representation of BAZ1A-PHD (model) and BAZ1B-PHD (PDB: 1F62). Red and blue indicate negatively and positively charged areas, respectively. The positively charged surface formed by K1181 and K1183 in the BAZ1A-PHD model and the corresponding region in BAZ1B-PHD are outlined in dotted green. c Steady-state biolayer interferometry measurement of DNA binding to wild-type BAZ1A-PHD, BAZ1B-PHD, or mutant versions of BAZ1A-PHD bearing the single K1181A or the double K1181A/K1183Y substitutions. d Average relative deuterium uptake difference (ARDD) for BAZ1A-PHD bound to DNA compared to uncomplexed BAZ1A-PHD, measured by HDX-MS. The values for six matching peptides (recovered from both DNA-bound and uncomplexed samples) are represented by histograms spanning the corresponding amino acid sequence of the BAZ1A-PHD construct. No matching peptides were obtained for residues 32–42 and histograms of overlapping peptides are shown in transparency. Residue numbering refers to the tag-free expression construct used for this experiment; residues colored in red do not belong to the endogenous BAZ1A sequence. The two lysine residues colored in blue and highlighted with blue arrowheads correspond to K1181 and K1183. Peptide sequences with the highest ARDD values (>10%) are highlighted in green; see Supplementary Fig. 7a, and the “Methods” section for more details. e Peptides with the highest ARDD values (>10%) were mapped on the BAZ1A-PHD model surface and shown in green. K1181 and K1183 (residues 47 and 49 in d) are colored in blue, and white areas correspond to residues 32–42, for which no ARDD data was obtained. f Same as c but using mononucleosomes. Each data point is the mean value ± s.e.m from four independent experiments. Fitted K Ds were determined from the averaged data and reported ± standard error
Fig. 7
Fig. 7
Function-altering PHD substitutions are detrimental to the cellular functions of BAZ1A. a Western blot analysis of BAZ1A expression in parental, BAZ1A-KO, and BAZ1A-KO cells engineered to re-express BAZ1AKAKY. bd Confluence of the indicated cell line measured over time, before, and after a pulse of UVC light. c Accumulation of endogenous SMARCA5 at sites of DNA damage as in Fig. 2c, d. Scale bar, 20 μm. Histograms represent the mean value ± s.e.m. normalized to recruitment in parental cells. P-values were calculated using a two-tailed Mann–Whitney test; n.s. not significant (P > 0.05). d Accumulation of GFP-fusion BAZ1A proteins to sites of laser irradiation in live cells. The fluorescence signal at site of irradiation is normalized to the signal of a non-irradiated area. Signal above 1 indicates accumulation at site of damage. Numbers on the x-axis and y-axis represent the time at which the fluorescence value equals 1 and the maximum value (plateau determined by fitting), respectively. e PC analysis of the transcriptional profiles of parental, BAZ1A-KO, re-expressing BAZ1A wild-type and re-expressing BAZ1AKAKY cells, before and after DNA damage. For each cell line, the first and second PCs (explaining the highest percent of variance) are reported for 2–3 independent RNA extractions. f Heat map showing the expression profiles of genes that are significantly upregulated in parental and re-expressing BAZ1A cells after UVC treatment compared to BAZ1AKAKY and BAZ1A-KO cells. The genes that are significantly downregulated for the same comparison are shown in Supplementary Fig. 8d. In both cases, only genes with the same expression profiles in parental and re-expressing BAZ1A cells, as well as BAZ1A-KO and BAZ1AKAKY cells are reported. Individual columns correspond to independent RNA extractions. g 4-way comparison showing the log2 fold-change between BAZ1A-KO cells engineered to re-express BAZ1A wild-type or the BAZ1AKAKY mutant under control conditions on the x-axis compared to UVC conditions on the y-axis. Points are colored according to differential expression significance, points in gray do not satisfy significance cut-off (P < 0.01, absolute log2 fold-change >1)

References

    1. Luger K, Mader AW, Richmond RK, Sargent DF, Richmond TJ. Crystal structure of the nucleosome core particle at 2.8 A resolution. Nature. 1997;389:251–260. doi: 10.1038/38444. - DOI - PubMed
    1. Gardner KE, Allis CD, Strahl BD. Operating on chromatin, a colorful language where context matters. J. Mol. Biol. 2011;409:36–46. doi: 10.1016/j.jmb.2011.01.040. - DOI - PMC - PubMed
    1. Patel DJ, Wang Z. Readout of epigenetic modifications. Annu. Rev. Biochem. 2013;82:81–118. doi: 10.1146/annurev-biochem-072711-165700. - DOI - PMC - PubMed
    1. Zentner GE, Henikoff S. Regulation of nucleosome dynamics by histone modifications. Nat. Struct. Mol. Biol. 2013;20:259–266. doi: 10.1038/nsmb.2470. - DOI - PubMed
    1. Lans H, Marteijn JA, Vermeulen W. ATP-dependent chromatin remodeling in the DNA-damage response. Epigenetics Chromatin. 2012;5:4. doi: 10.1186/1756-8935-5-4. - DOI - PMC - PubMed