. 2017 Oct 11;8(1):849.
doi: 10.1038/s41467-017-00979-6.

A cdk1 gradient guides surface contraction waves in oocytes

Affiliations

A cdk1 gradient guides surface contraction waves in oocytes

Johanna Bischof et al. Nat Commun. .

Erratum in

Abstract

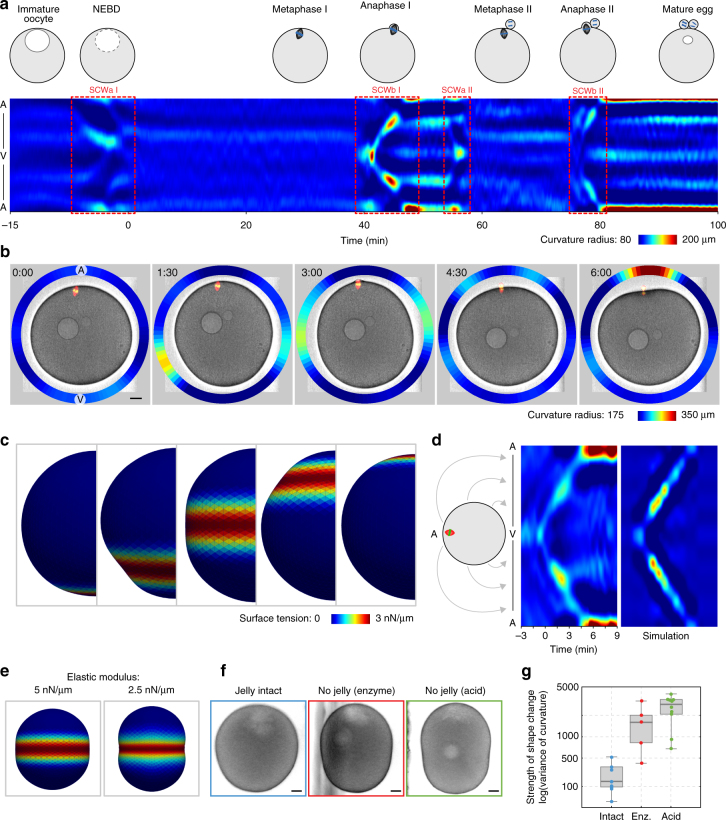
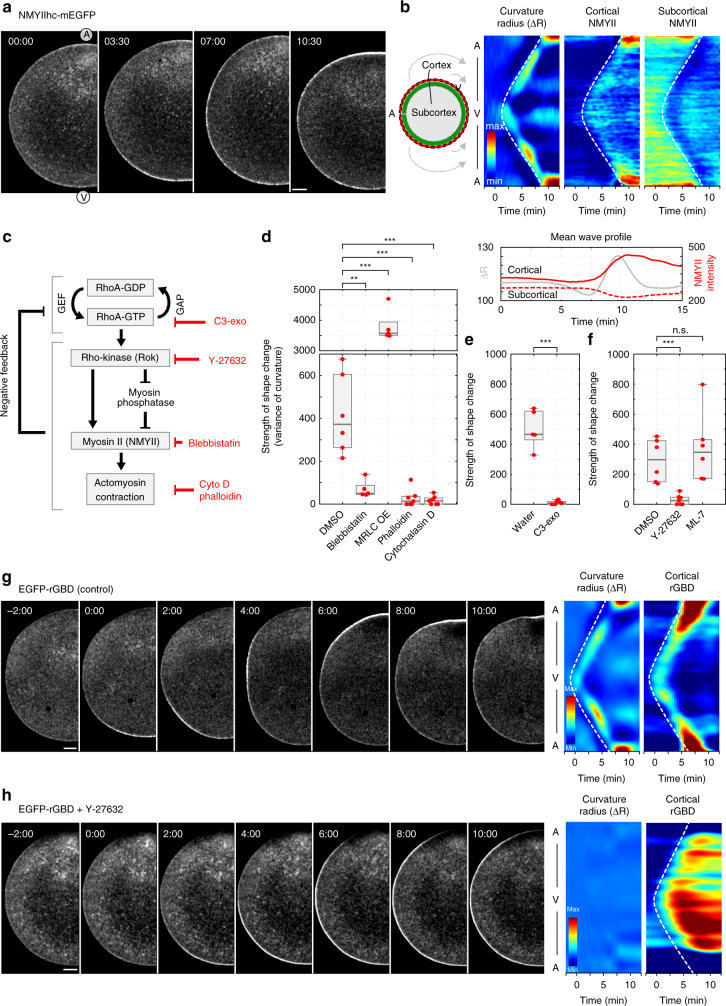
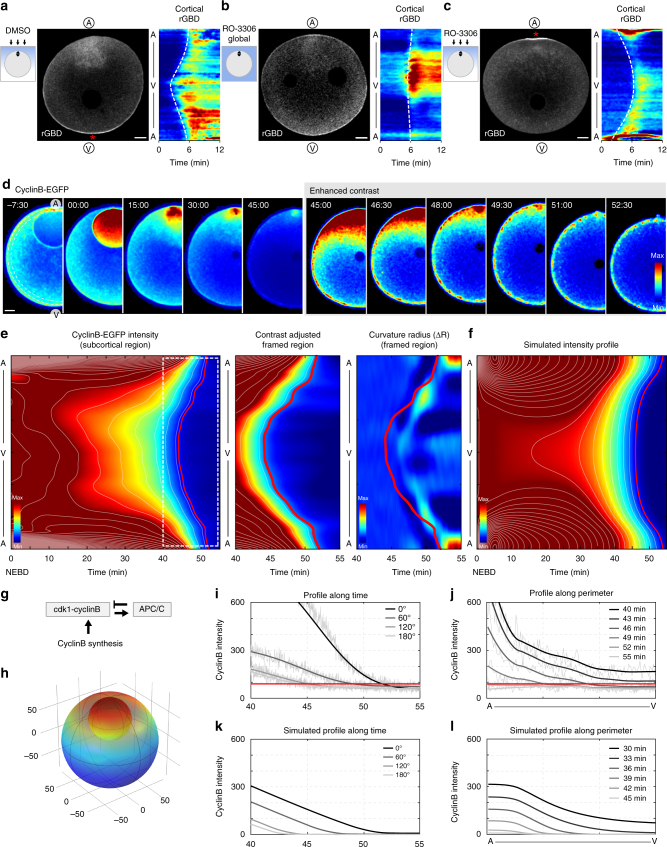
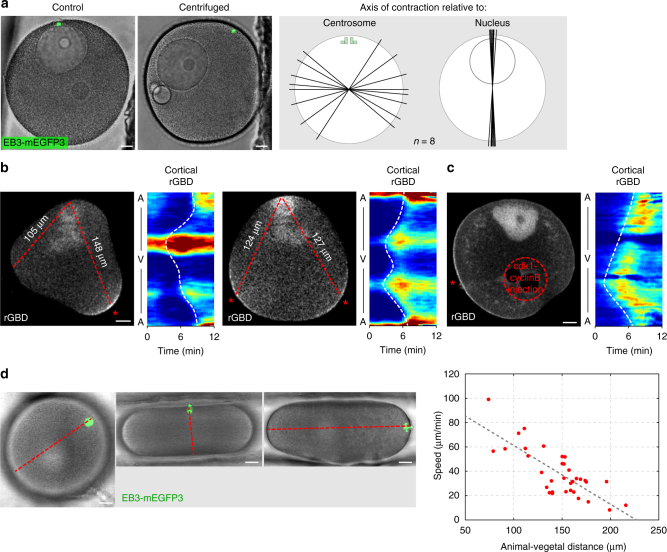
Surface contraction waves (SCWs) in oocytes and embryos lead to large-scale shape changes coupled to cell cycle transitions and are spatially coordinated with the cell axis. Here, we show that SCWs in the starfish oocyte are generated by a traveling band of myosin II-driven cortical contractility. At the front of the band, contractility is activated by removal of cdk1 inhibition of the RhoA/RhoA kinase/myosin II signaling module, while at the rear, contractility is switched off by negative feedback originating downstream of RhoA kinase. The SCW's directionality and speed are controlled by a spatiotemporal gradient of cdk1-cyclinB. This gradient is formed by the release of cdk1-cyclinB from the asymmetrically located nucleus, and progressive degradation of cyclinB. By combining quantitative imaging, biochemical and mechanical perturbations with mathematical modeling, we demonstrate that the SCWs result from the spatiotemporal integration of two conserved regulatory modules, cdk1-cyclinB for cell cycle regulation and RhoA/Rok/NMYII for actomyosin contractility.Surface contraction waves (SCWs) are prominent shape changes coupled to cell cycle transitions in oocytes. Here the authors show that SCWs are patterned by the spatiotemporal integration of two conserved modules, cdk1-cyclinB for cell cycle regulation and RhoA/Rok/NMYII for actomyosin contractility.


Conflict of interest statement

The authors declare no competing financial interests.

Figures

Fig. 1
Fig. 1
The SCW is a band of cortical contraction traveling across the oocyte. a Kymograph of radii of curvature during the complete meiosis in starfish oocytes, along with schematic representations of key stages of the divisions. b Overview of the SCW in starfish oocytes. Frames selected from a transmitted light movie across the equatorial plane along the animal–vegetal (A–V) axis of an oocyte with fluorescence channels overlaid labeling microtubules (red, EB3-mEGFP3) and chromosomes (green, mCherry-H2B). For the full movie see Supplementary Movie 1. The ring plot shows the radii of curvature of the cortex encoded in the pseudo-color scale shown on the bottom right. Scale bar=20 µm; time is given as m:ss relative to beginning of SCW. c Rendering of the 3D mechanical model of the oocyte during the SCW. Surface tension is encoded using the pseudo-color scale shown on the bottom right. d Kymographs of cortical curvature radii during the SCW of the oocyte shown in b, and of the simulation shown in c. Kymographs show curvature radii along the perimeter of the oocyte on the y-axis as shown on the schematics on the left, x-axis is time. Radii of curvature values are encoded in the pseudo-color scale as in b. Kymograph of the simulation was generated by calculating curvature of individual steady state outcomes of simulation of the progress of the contraction. e Frames selected at the maximal deformation during the SCW of simulations with high and low elastic moduli. f Frames of oocytes with either intact jelly or jelly layer removed (by enzymatic or acidic sea water treatment) as the SCW passes the equator. Scale bar=20 µm. g Comparison of the strength of the shape change during SCW as measured by the variance of curvature radii during the SCW in oocytes with and without jelly, jelly removed by the indicated method. Dot plots of measurements of individual oocytes overlaid with box plots of the same data
Fig. 2
Fig. 2
The SCW is mediated by the RhoA/Rok/NMYII module. a Selected frames of a time-lapse recording of an oocyte expressing the heavy chain of non-muscle myosin II (NMYIIhc)-mEGFP during SCW. Single confocal slice along the equatorial plane across the A–V axis; scale bar 20 μm; time is in mm:ss. For the complete movie see Supplementary Movie 2. b Kymographs showing radii of curvature as in Fig. 1c, and the fluorescence signal of NMYIIhc-EGFP measured at the cortex and in a subcortical region simultaneously over time, as illustrated by the scheme on the left. Underneath, fluorescence intensity plot of the cortical (solid line) and subcortical NMYIIhc-EGFP (dashed line) signal, compared to curvature change (gray line) averaged along the wave front. c Scheme illustrating the signaling pathway controlling SCWs in starfish oocytes and the inhibitors used in this study to interfere with the respective components. df Quantification of the strength of the shape change during the SCW for oocytes treated with inhibitors as indicated. Dot plots of measurements of individual oocytes overlaid with box plots of the same data. ***p < 0.001, **p < 0.01, n.s. not significant, determined via ANOVA. g Selected frames of a time-lapse recording of an oocyte expressing RhoA-GTP reporter (EGFP-rGBD) during the SCW and corresponding kymographs of curvature radii and cortical fluorescence intensities as in b. Single confocal slice along the equatorial plane across the A–V axis is shown; scale bar=20 μm, time is in mm:ss. For the complete movie see Supplementary Movie 3. h Oocyte expressing EGFP-rGBD and imaged as in g, injected with the Rok inhibitor Y-27632, selected frames and kymographs of radii of curvature and cortical fluorescence intensities are shown. Scale bar=20 μm; time is in mm:ss. For the complete movie see Supplementary Movie 4
Fig. 3
Fig. 3
cdk1-cyclinB forms a spatiotemporal gradient controlling the RhoA module. a Oocyte expressing RhoA-GTP marker EGFP-rGBD and locally treated with DMSO (as in scheme to the left), starting point of SCW marked by a red asterisk. Right: Kymograph of the cortical rGBD signal. Scale bar=20 μm. b Same as a except oocyte was globally treated with the cdk1 inhibitor RO-3306. c Same as a except oocyte was locally treated with the cdk1 inhibitor RO-3306, the starting point of the SCW is marked by a red asterisk. d Pseudo-colored frames from a time-lapse recording of an oocyte expressing cyclinB-EGFP during meiosis I. Right: contrast adjusted to visualize decreased levels of cyclinB during SCW. Images are 15 s averages of 1.5 s per frame recording. Scale bar=20 μm; time relative to NEBD, in mm:ss. See also Supplementary Movie 5. e Quantification of cyclinB-mEGFP intensities of the oocyte shown in d. Left: kymograph of the subcortical cyclinB-EGFP fluorescence intensity during meiosis with intensity-isolines in white. Middle: Zoom of the white dashed box including the time of the SCW with adjusted contrast and the isoline conforming to the SCW highlighted in red. Right: kymograph of radii of curvature during the same time window with the isoline from the middle plot overlaid. f Kymograph of the simulated cdk1-cyclinB concentration profile along the cortex. For details of the simulation see Methods. g The reaction system of cdk1-cyclinB inactivation. h Frame of the 3D finite element simulation of the cdk1-cyclinB reaction-diffusion system. i For the oocyte shown in d, cyclinB-EGFP subcortical intensities plotted over time at angles from animal pole to vegetal pole (darkest to lightest gray), smoothed data shown in bold, raw data in thin line. Red line same as isoline in e. j For the oocyte shown in d, subcortical cyclinB-EGFP intensities plotted from the animal to vegetal pole during the SCW at time points 40, 43, 46, 49, 52, and 55 min after NEBD (darkest to lightest gray). Red line same as isoline in e. k Simulated cdk1-cyclinB intensity as in i. l Simulated cdk1-cyclinB intensity profiles as in j
Fig. 4
Fig. 4
The SCW front is guided by the cdk1-cyclinB gradient. a Left panel: control oocyte (left) and oocyte after centrifugation (right), with centrosomes position indicated by microtubule label EB3-3mEGFP (green) marking the original position of the animal pole. Scale bars=20 μm. Right panel: schemes showing the axis of SCWs in individual centrifuged oocytes (one line per oocyte) relative to the position of centrosomes and nucleus, respectively. b Selected frames from time-lapse recordings of two oocytes shaped into triangles by microfabricated chambers, and expressing RhoA-GTP marker rGBD-EGFP. Red dashed lines indicate the distance between the animal pole (top) and the furthest corner(s) of the oocyte. The starting points of the SCW are marked with a red asterisk. The respective kymographs show cortical rGBD-EGFP fluorescence intensities during the SCW. Scale bars=20 μm. c Selected frame from a time-lapse recording of an oocyte expressing rGBD-EGFP and injected with active cdk1-cyclinB protein to the area indicated by the red dashed circle. Red asterisk indicates the starting point of the SCW. Respective kymograph shows cortical fluorescence intensities for rGBD-EGFP during the SCW. Scale bar=20 μm. d Oocytes placed in microfabricated chambers leaving shape unchanged, compressed or expanded along the animal-vegetal axis, respectively. The animal pole is marked by the spindle visualized by EB3-3mCherry. Red dashed line indicates the animal-vegetal axis. Scale bar=20 μm. Quantification of the effects of these shape changes on SCW speed plotted as the speed of the SCW against animal-vegetal distance with each dot representing an individual oocyte

Similar articles

Cited by

References

    1. Lecuit T, Lenne P-F, Munro E. Force generation, transmission, and integration during cell and tissue morphogenesis. Annu. Rev. Cell. Dev. Biol. 2010;27:157–184. doi: 10.1146/annurev-cellbio-100109-104027. - DOI - PubMed
    1. Heisenberg CP, Bellaïche Y. Forces in tissue morphogenesis and patterning. Cell. 2013;153:948–962. doi: 10.1016/j.cell.2013.05.008. - DOI - PubMed
    1. Yoneda M, Kobayakawa Y, Kubota HY, Sakai M. Surface contraction waves in amphibian eggs. J. Cell. Sci. 1982;54:35–46. - PubMed
    1. Hamaguchi MS, Hiramoto Y. Protoplasmic movement during polar-body formation in starfish oocytes. Exp. Cell. Res. 1978;112:55–62. doi: 10.1016/0014-4827(78)90524-4. - DOI - PubMed
    1. Amiel A, Houliston E. Three distinct RNA localization mechanisms contribute to oocyte polarity establishment in the cnidarian Clytia hemisphaerica. Dev. Biol. 2009;327:191–203. doi: 10.1016/j.ydbio.2008.12.007. - DOI - PubMed

Publication types