. 2018 Oct;9(4):347-362.
doi: 10.1007/s12687-017-0335-3. Epub 2017 Oct 11.

An overview of concepts and approaches used in estimating the burden of congenital disorders globally

Collaborators, Affiliations

An overview of concepts and approaches used in estimating the burden of congenital disorders globally

Sowmiya Moorthie et al. J Community Genet. 2018 Oct.

Abstract

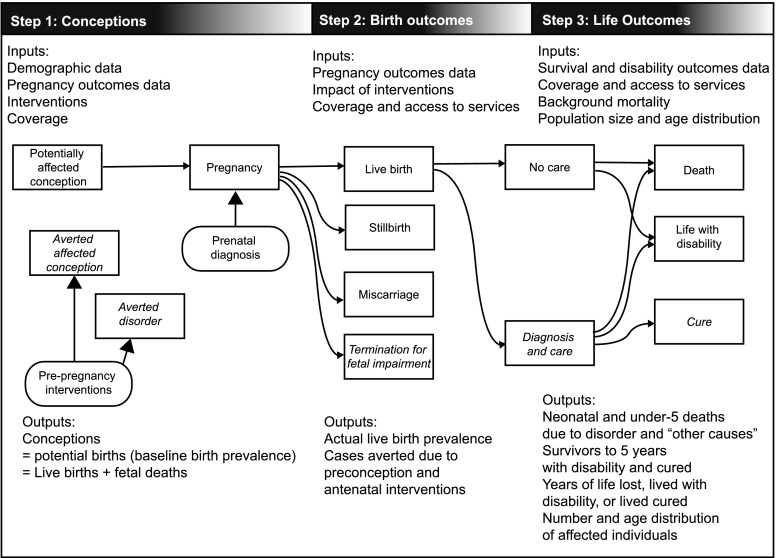
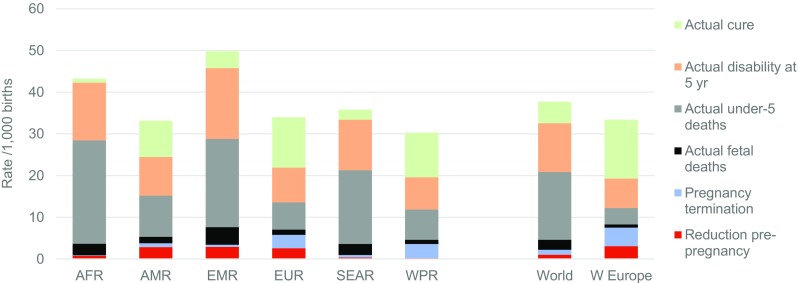
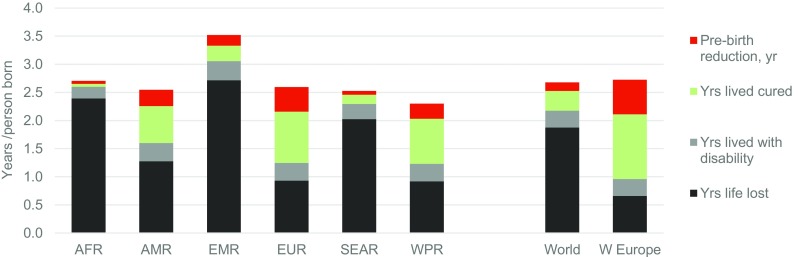
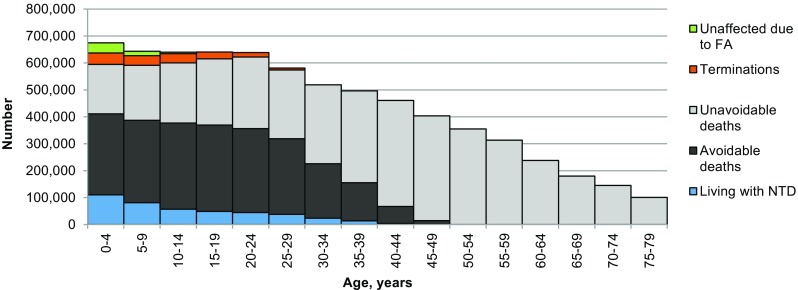
Congenital disorders are an important cause of pregnancy loss, premature death and life-long disability. A range of interventions can greatly reduce their burden, but the absence of local epidemiological data on their prevalence and the impact of interventions impede policy and service development in many countries. In an attempt to overcome these deficiencies, we have developed a tool-The Modell Global Database of Congenital Disorders (MGDb) that combines general biological principles and available observational data with demographic data, to generate estimates of the birth prevalence and effects of interventions on mortality and disability due to congenital disorders. MGDb aims to support policy development by generating country, regional and global epidemiological estimates. Here we provide an overview of the concepts and methodological approach used to develop MGDb.

Keywords: Congenital disorders; Epidemiology; Policy; Public health.


Conflict of interest statement

Sowmiya Moorthie, Hannah Blencowe, Matthew Darlison, Joy Lawn, Pierpaolo Mastroiacovo, Joan K Morris, Bernadette Modell, and the Congenital Disorders Expert Group declare they have no conflict of interest. This article does not contain any studies with human or animal subjects performed by any of the authors.

Figures

Fig. 1
Fig. 1
The sequence of events covered in MGDb and stepwise modelling process used to derive estimates for specific congenital disorders. The outcomes that are impacted by interventions are shown in italics
Fig. 2
Fig. 2
Estimated baseline total birth prevalences of congenital disorder by WHO region. AFR African, AMR American, EMR Eastern Mediterranean, SEAR South-East Asian, WPR Western Pacific Region, W Europe Western Europe
Fig. 3
Fig. 3
Estimated outcomes of congenital disorders if no intervention, by type of outcome, 2010–2014. Note: The small discrepancy between total affected birth prevalence in the previous chart and total outcomes represents estimated under-5 deaths due to other causes (omitted for the sake of clarity). AFR African, AMR American, EMR Eastern Mediterranean, SEAR South-East Asian, WPR Western Pacific Region, W Europe Western Europe
Fig. 4
Fig. 4
Estimated reduction in affected births per 1000 due to pre-birth interventions, by WHO region, 2010–2014. AFR African, AMR American, EMR Eastern Mediterranean, SEAR South-East Asian, WPR Western Pacific Region, W Europe Western Europe, FA Folic acid
Fig. 5
Fig. 5
Estimated actual outcomes of congenital disorders by type of outcome, 2010–14. AFR African, AMR American, EMR Eastern Mediterranean, SEAR South-East Asian, WPR Western Pacific Region, W Europe Western Europe
Fig. 6
Fig. 6
Estimated actual outcomes for total congenital disorders, expressed as years of life lost, lived with disability or lived cured per person in the relevant birth cohort, 2010–2014, by WHO region
Fig. 7
Fig. 7
Estimated distribution of outcomes for spina bifida in 2010. The total outline shows the number of individuals who would be living with spina bifida if survival equalled the population norm, according to age in 2010 (6.98 million). The outline reflects the age distribution of the world population in 2010. The green fill shows cases avoided by folic acid food fortification (only 56,000 in 2010 because fortification only started to become policy in the late 1990s). The orange fill shows cases avoided by termination of pregnancy (196,000 in 2010). The grey fill shows deaths that would have occurred even with best care available when the affected person was born (unavoidable deaths). The great majority of deaths occurred soon after birth, but they appear in all age groups because the chart shows all outcomes. The black fill shows the numbers of deaths that occurred because of lack of access to available care (avoidable deaths) (total losses from the current world population due to spina bifida = 6.35 million). The blue fill shows estimated numbers living with spina bifida in 2010 (399,000)

References

    1. Abbas HA, Yunis K. The effect of consanguinity on neonatal outcomes and health. Hum Hered. 2014;77:87–92. doi: 10.1159/000362125. - DOI - PubMed
    1. Baird PA, Sadovnick AD. Life expectancy in Down syndrome. J Pediatr. 1987;110:849–854. doi: 10.1016/S0022-3476(87)80395-5. - DOI - PubMed
    1. Baird PA, Sadovnick AD. Life expectancy in Down syndrome adults. Lancet. 1988;2:1354–1356. doi: 10.1016/S0140-6736(88)90881-1. - DOI - PubMed
    1. Baird PA, Anderson TW, Newcombe HB, Lowry RB. Genetic disorders in children and young adults: a population study. Am J Hum Genet. 1988;42:677–693. - PMC - PubMed
    1. Baylis JH, Campbell M. The course and prognosis of coarctation of the aorta. Br Heart J. 1956;18:475–495. doi: 10.1136/hrt.18.4.475. - DOI - PMC - PubMed

LinkOut - more resources