. 2017 Oct 11;550(7675):239-243.
doi: 10.1038/nature24267.

The impact of rare variation on gene expression across tissues

Collaborators, Affiliations

The impact of rare variation on gene expression across tissues

Xin Li et al. Nature. .

Abstract

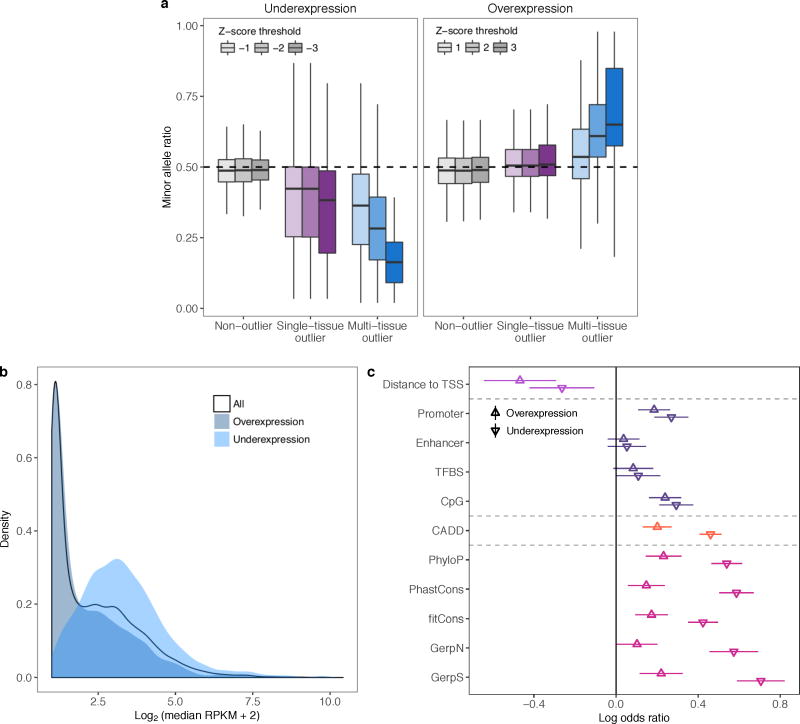
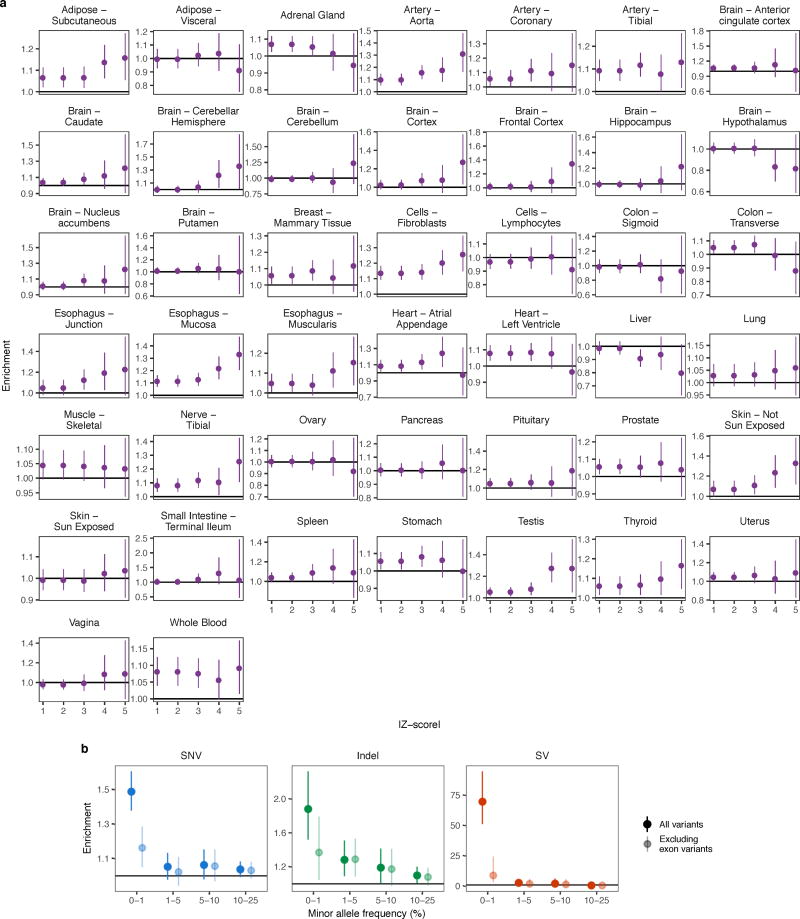
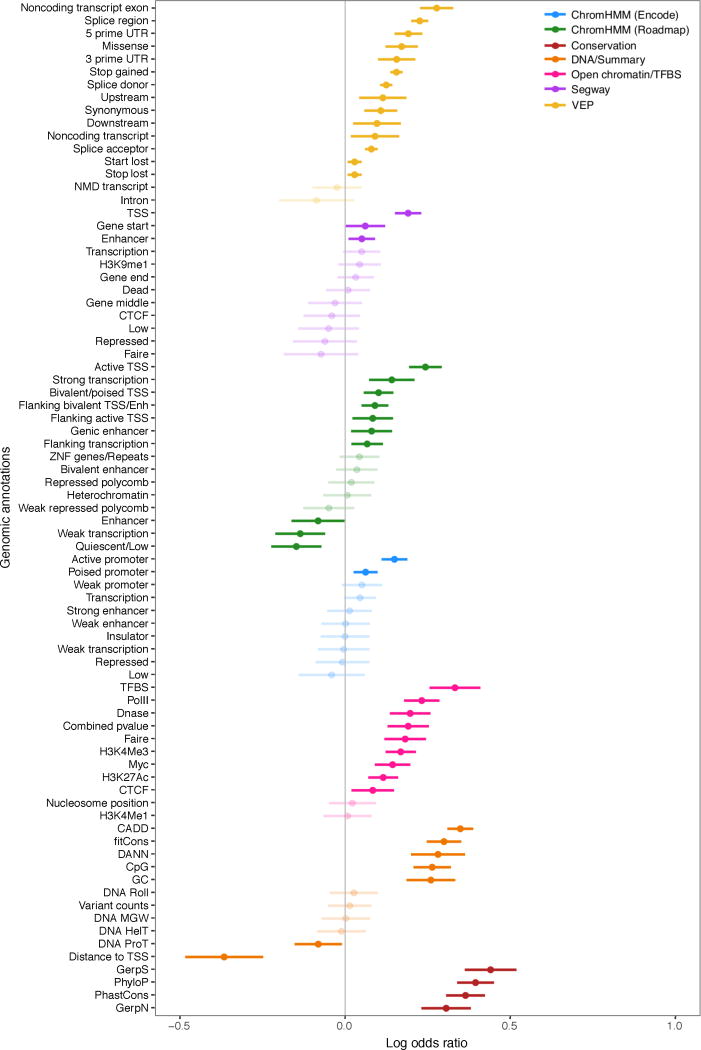
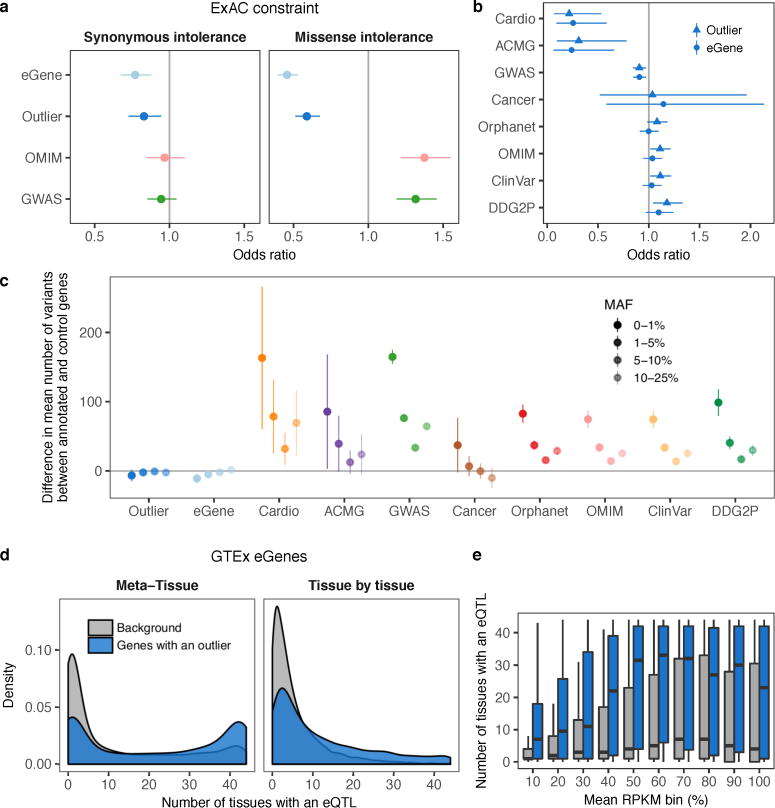
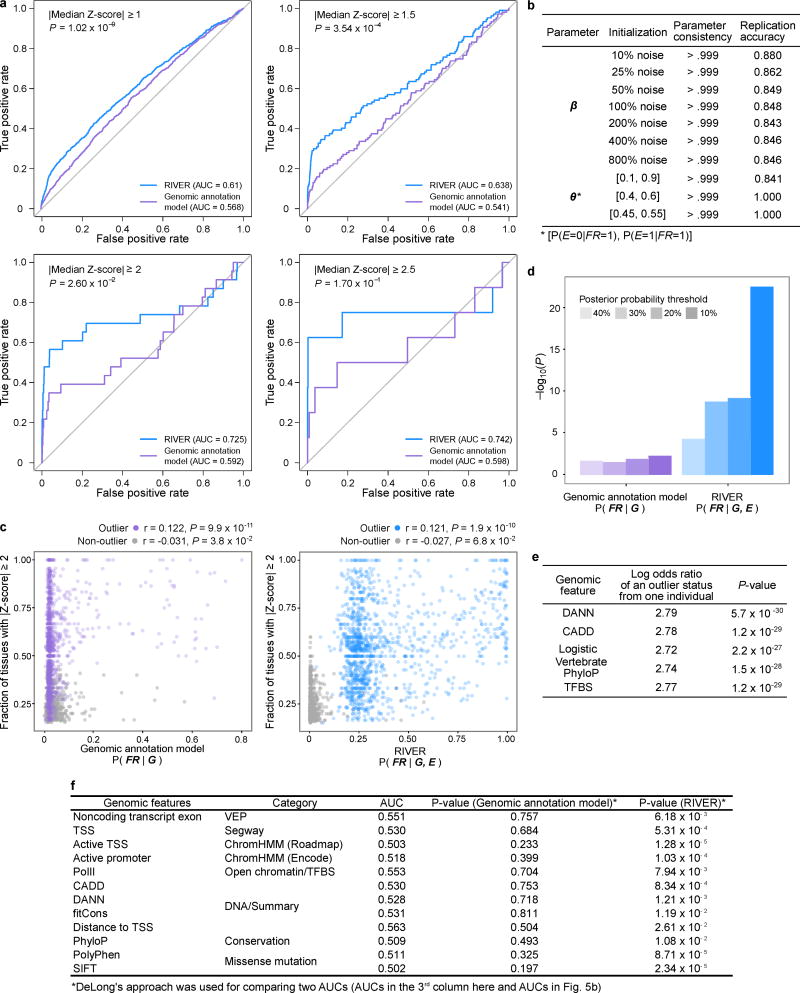
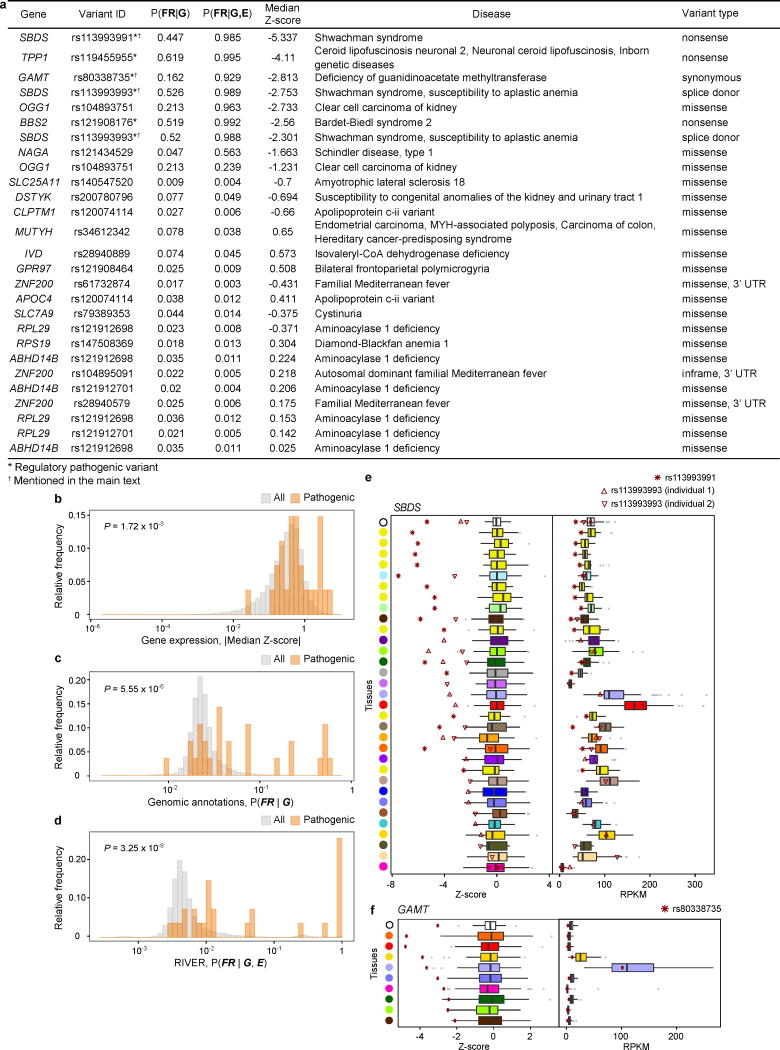
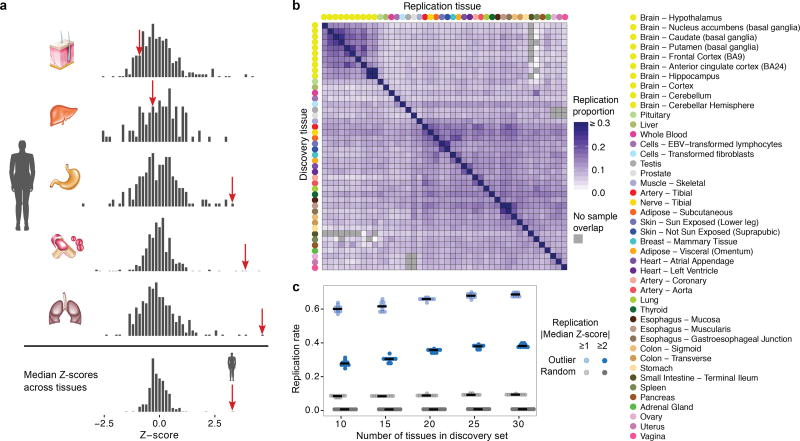
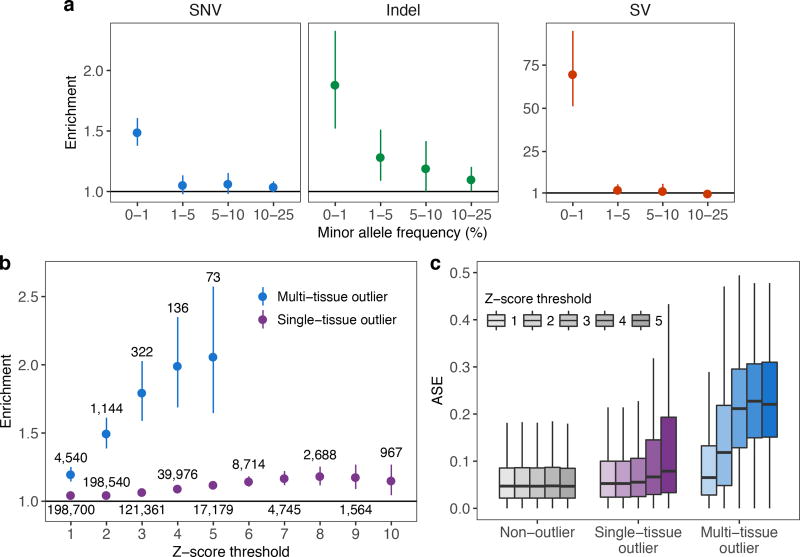
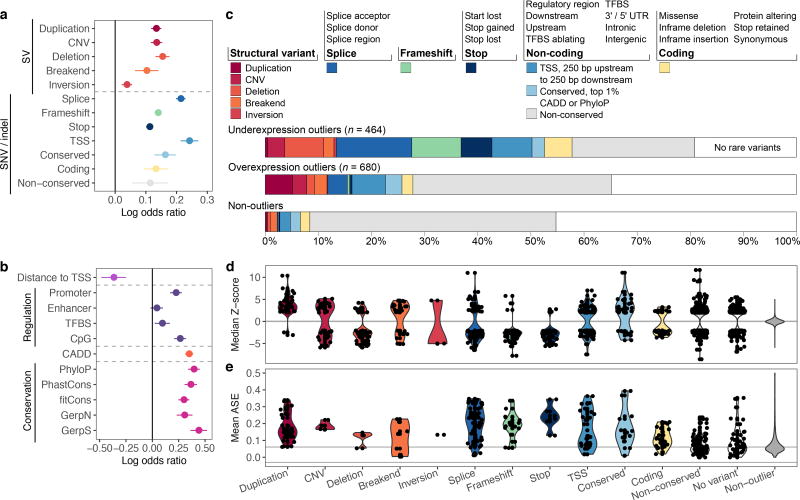
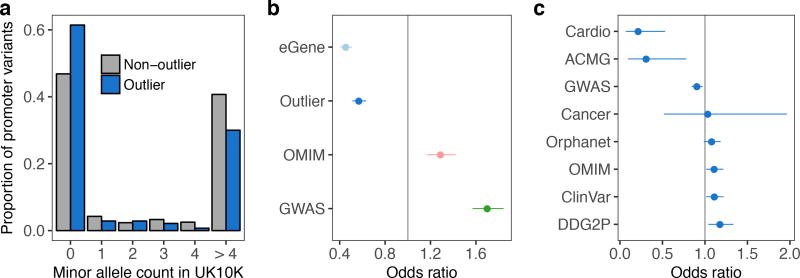
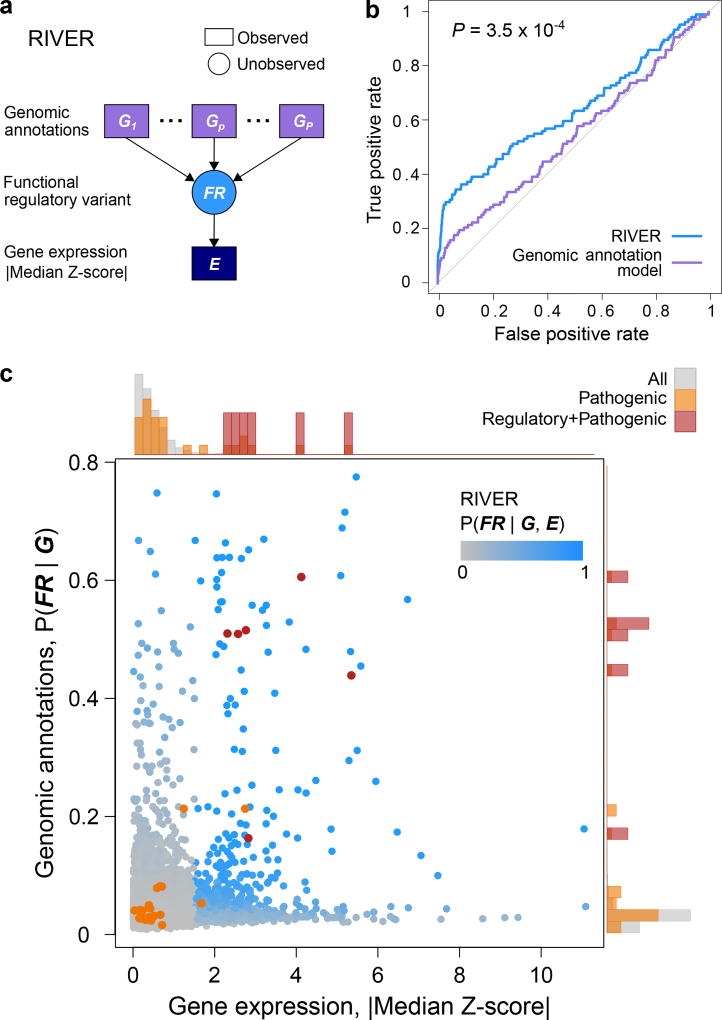
Rare genetic variants are abundant in humans and are expected to contribute to individual disease risk. While genetic association studies have successfully identified common genetic variants associated with susceptibility, these studies are not practical for identifying rare variants. Efforts to distinguish pathogenic variants from benign rare variants have leveraged the genetic code to identify deleterious protein-coding alleles, but no analogous code exists for non-coding variants. Therefore, ascertaining which rare variants have phenotypic effects remains a major challenge. Rare non-coding variants have been associated with extreme gene expression in studies using single tissues, but their effects across tissues are unknown. Here we identify gene expression outliers, or individuals showing extreme expression levels for a particular gene, across 44 human tissues by using combined analyses of whole genomes and multi-tissue RNA-sequencing data from the Genotype-Tissue Expression (GTEx) project v6p release. We find that 58% of underexpression and 28% of overexpression outliers have nearby conserved rare variants compared to 8% of non-outliers. Additionally, we developed RIVER (RNA-informed variant effect on regulation), a Bayesian statistical model that incorporates expression data to predict a regulatory effect for rare variants with higher accuracy than models using genomic annotations alone. Overall, we demonstrate that rare variants contribute to large gene expression changes across tissues and provide an integrative method for interpretation of rare variants in individual genomes.


Conflict of interest statement

The authors declare no competing financial interests.

Figures

Extended Data Figure 1
Extended Data Figure 1. PEER correction
(a) Adjusted R2 between top 15 PEER factors and top 20 sample (left) and subject (right) covariates in an example tissue, skeletal muscle. Covariates were ranked by the average adjusted R2 across all PEER factors and hierarchically clustered. The corresponding data for all tissues are provided in Supplementary Tables 1 and 2. (b) Adjusted R2 between the total expression component removed by PEER in each tissue and top 20 sample (left) and subject (right) covariates. The covariates were ranked by the average adjusted R2 across all tissues, and both axes were hierarchically clustered. White denotes missing values, and tissues are colored as in Fig. 1. PEER factors captured slightly different covariates across tissues, with a noticeable difference between the brain and other tissues. (c) Rare variant enrichments as in Fig. 2a for different levels of PEER correction. The fully corrected data show substantially stronger rare variant enrichments than the two partially corrected datasets.
Extended Data Figure 2
Extended Data Figure 2. Distribution of the number of genes with a multi-tissue outlier
(a) Distribution of the number of genes for which each individual was a multi-tissue outlier. Each individual was an outlier for a median of 10 genes. Individuals with 50 or more outliers are colored in grey and were excluded from downstream analyses. (b–f) Distribution of the number of genes for which individuals, stratified by common covariates, were multi-tissue outliers. For race and sex, we compared the distributions using an unsigned Wilcoxon rank sum test, while we used Spearman’s ρ to test for association with the remaining covariates. Only age (Spearman’s ρ = 0.10, P = 0.033) and ischemic time (Spearman’s ρ = 0.18, P = 0.00022) were nominally associated with the number of outlier genes per individual. The association with age fails to achieve significance after correcting for multiple testing using the Bonferroni method. Note that in (b) we only tested for a significant difference in the distribution of the number of outlier genes between White and Black individuals because there were too few individuals in the other groups. (g) Enrichments as shown in Fig. 2a either including all individuals, or excluding individuals that are outliers for 50 (matches Fig. 2a) or 30 genes.
Extended Data Figure 3
Extended Data Figure 3. Single-tissue outlier replication
(a) Correlation between the replication proportions (see Methods) obtained from all samples and from a subset of 70 overlapping individuals per tissue pair (Pearson’s correlation, P < 2.2 × 10⁻¹⁶). When restricting to 70 individuals, the replication rates decreased more for discovery tissues with larger sample sizes in the full data set, indicating that replication rates were underestimated for tissues with small sample sizes. (b) Correlation between replication in the 70 individuals used for discovery and replication assessed in a set of 70 individuals that included the outlier individual and 69 individuals excluded from the discovery set (Pearson’s correlation, P < 2.2 × 10⁻¹⁶). Replication was higher when computed in the discovery individuals rather than in a distinct set of individuals. (c) Single-tissue outlier replication using all individuals, as in Fig. 1b, but data are only shown for pairs with at least 70 overlapping individuals. Tissue pairs with insufficient overlap are in grey. (d) For each pair of tissues with sufficient samples, outlier discovery and replication using 70 individuals sampled in both tissues. The replication values decreased compared with replication performed in all individuals (c), particularly for tissues with large sample sizes in the complete dataset. However, the pattern of replication, with more similar tissues having higher replication rates, is maintained. (e) For each tissue, the proportion of (individual, gene) outlier pairs where the individual was also a multi-tissue outlier for the gene. This proportion was positively correlated with the tissue sample size (P = 1.4 × 10⁻¹⁰). Points are colored by tissue following the convention in Fig. 1.
Extended Data Figure 4
Extended Data Figure 4. Number of rare variants per individual and population structure
(a) The distribution of the number of rare variants of each type for individuals of European descent (reported as white). Certain individuals harbored many more rare variants than the population median (vertical black line). (b) Principal component analysis of all individuals. Individuals are plotted according to their first two genotype principal components (PCs) and colored by their reported ancestry. White individuals with whole genome sequencing data, included in (a), are colored in a lighter shade of blue and those with 60,000 or more rare variants are circled in black. The individuals with an excess of rare variants likely had African or Asian admixture. (c) Enrichments as in Fig. 2a and excluding individuals with >60,000 rare variants (circled in (b)), which did not substantially affect the enrichment patterns. (d) European population allele frequency distributions in the 1000 Genomes project of rare SNVs and indels analyzed. The rare variants included in our analysis were constrained to have MAF ≤ 0.01 in the 1000 Genomes European super population, but they were also relatively rare in each of the individual European populations.
Extended Data Figure 5
Extended Data Figure 5. Comparison of overexpression and underexpression outliers
(a) Allele-specific expression (ASE) at rare exonic variants. ASE is shown as the ratio of the number of reads supporting the minor allele to the total number of reads at the site. If the rare variant is driving the extreme expression, we expect this ratio to be below 0.5 for underexpression outliers and above 0.5 for overexpression outliers. Rare coding variants were enriched for ASE in the direction of the extreme expression effect (two-sided Wilcoxon rank sum tests, each nominal P < 4.0 × 10⁻⁸). (b) Expression level distribution of all genes and genes with overexpression or underexpression outliers. Expression is shown as the log2 of the median (RPKM + 2), where the median was first taken across individuals in each tissue then across expressed tissues for each gene. For genes with low expression, even an RPKM of 0 may not yield a Z-score ≤ −2. Indeed, underexpression outliers were depleted among lowly expressed genes whereas the opposite was true of overexpression outliers (two-sided Wilcoxon rank sum test comparing to all genes, P < 2.2 × 10⁻¹⁶ for both overexpression and underexpression). (c) Feature enrichments (as in Fig. 3b) shown separately for over and underexpression outliers.
Extended Data Figure 6
Extended Data Figure 6. Extended rare variant enrichments
(a) For each tissue, rare SNV enrichment in single-tissue outliers compared with non-outliers at the same genes for increasing Z-score thresholds. Enrichments calculated as in Fig. 2. The rare variant enrichments varied between tissues though the overall pattern mirrored that of multi-tissue outliers when combining all the tissues (Fig. 2b). The high variance in the enrichments underscores the noise in single-tissue outlier discovery. (b) As in Fig. 2a, enrichment for SNVs, indels, and SVs in outliers compared with the same genes in non-outliers either including all rare variants or only those outside protein-coding or lincRNA exons in Gencode v19 annotation. The enrichment of rare variants was weaker, but still significant, for all variant types when excluding exonic regions.
Extended Data Figure 7
Extended Data Figure 7. Enrichment of an extended list of functional genomic annotations
Log odds ratios and 95% Wald confidence intervals from logistic regression models of outlier status as a function of each genomic feature. Features were calculated among rare SNVs within 10 kb of the gene. When more than one feature corresponded to the same genomic annotation (e.g., the number or the presence of rare variants in a splice region; Supplementary Table 3b), the feature with the highest enrichment is shown. Lighter shading indicates a non-significant log odds ratio (nominal P > 0.05).
Extended Data Figure 8
Extended Data Figure 8. Evolutionary constraint and regulatory control of multi-tissue outlier genes
(a) Odds ratio of being intolerant to synonymous and missense variants for genes with multi-tissue eQTLs (eGenes), genes with multi-tissue outliers, OMIM, and GWAS genes (see Methods). As expected, GWAS and OMIM genes showed no enrichment or depletion for synonymous variation intolerant genes. Genes with multi-tissue outliers and eGenes showed slight depletion for these genes. Genes with multi-tissue outliers and eGenes were strongly depleted for missense variation intolerant genes compared with OMIM and GWAS genes. (b) Comparison of the depletion of disease genes among genes with a multi-tissue outlier and eGenes. Similar to Fig. 4c, bars represent 95% confidence intervals from Fisher’s exact test. (c) For each of ten gene lists, the difference in the mean number of variants near genes in the list compared with the mean for all other annotated genes. Results are stratified by minor allele frequency, and bars indicate the 95% confidence interval for the difference from a two-sided t-test. Disease genes harbored more variants than control genes in general, and the difference was particularly striking for rare variants. This suggests that the depletion of outliers and eQTLs for certain groups of disease genes is due to less rare variation near these genes. Instead, we hypothesize that the variation around these genes in our healthy cohort is less likely to have large regulatory effects. (d) Distribution of the number of tissues with an eQTL for genes with and without outliers. Genes with multi-tissue outliers had eQTLs in more tissues than genes without, which suggests that they are more susceptible to shared regulatory control. This result held for both multi-tissue eQTL definitions (see Methods; Meta-Tissue: 23 vs 3 tissues, Wilcoxon rank sum test P < 2.2 × 10⁻¹⁶; tissue-by-tissue: 7 vs 3 tissues, P < 2.2 × 10⁻¹⁶). (e) This eGene enrichment was robust across different mean expression levels across tissues (two-sided Wilcoxon rank sum tests, Bonferroni-adjusted P < 1 × 10⁻¹¹).
Extended Data Figure 9
Extended Data Figure 9. River performance
(a) Comparison between the predictive power of RIVER and that of the genomic annotation model, as in Fig. 5a, across different Z-score thresholds for outlier calling. Increasing the Z-score threshold improved AUC values, but reduced the number of outlier examples, which led to noisy ROCs. (b) Stability analysis of estimated parameters with different parameter initializations (see Methods). (c) Correlations, using Kendall’s tau, between the fraction of tissues with |Z-score| ≥ 2 and the test probabilities from the genomic annotation model (left) and RIVER (right). We calculated test posterior probabilities using 10-fold cross validation and only considered individual and gene pairs with a fraction of tissues with |Z-score| ≥ 2 that was significantly different from 0.05 (one-sided binomial exact test, Benjamini-Hochberg adjusted P < 0.05). (d) P-values from a one-sided Fisher’s exact test measuring the association between allelic imbalance (see Methods) and the posterior probability of a functional rare variant according to the genomic annotation model and RIVER. The posterior probabilities from RIVER were more strongly associated with allelic imbalance across all four thresholds tested. (e) Assessment of the advantage of incorporating gene expression with genomic annotations for predicting outlier status using simplified supervised models (see Methods). All models showed consistent improvement of the log odds ratio of outlier status when incorporating expression. (f) Performance of models with 12 individual genomic features compared with the genomic annotation model and RIVER. Some models with single genomic features provided slightly better AUCs compared with the genomic annotation model, but they were not statistically different. On the other hand, RIVER predicted the effects of rare variants significantly better than each of the models with a single feature.
Extended Data Figure 10
Extended Data Figure 10. Evaluation of known pathogenic variants using RIVER
(a) 27 GTEx rare SNVs reported as disease variants in ClinVar. Relative frequency of (b) the |median Z-score|, (c) posterior probabilities from the genomic annotation model, and (d) posterior probabilities from RIVER for all individual and gene pairs (grey) and 27 pairs with pathogenic variants from ClinVar (orange). P-values were computed using a two-sided Wilcoxon rank sum test. We note that rare indels and SVs were not found nearby the genes in the individuals carrying these pathogenic variants. (e and f) Z-score and RPKM distributions for (e) SBDS and (f) GAMT were compared with the values for four individuals carrying regulatory pathogenic variation (red asterisks and triangles). The median Z-score and RPKM values across tissues are shown at the top of each plot (black circle). Tissues are colored as in Fig. 1 and sorted in decreasing order of the difference between the average Z-score of individuals with a regulatory pathogenic variant and the median Z-score for the tissue. Three individuals carrying a total of two unique rare variants are shown for SBDS. Both variants are associated with the recessive Shwachman-Diamond syndrome, which causes systemic symptoms including pancreatic, neurological, and hematologic abnormalities and can disrupt fibroblast function. The individuals, being heterozygous for these variants, lacked the disease phenotype. Nonetheless, we saw extreme underexpression of SBDS across almost all tissues in these individuals, including brain tissues, fibroblasts, and pancreas. One individual had a rare variant for GAMT associated with cerebral creatine deficiency syndrome 2, shown to cause neurological deficiencies and also lead to low body fat. The individual had the most extreme underexpression in (subcutaneous) adipose.
Extended Data Figure 11
Extended Data Figure 11. Validation of large-effect rare variants via CRISPR/Cas9 genome editing
(a) SNVs in outliers and controls assayed for expression effects using CRISPR/Cas9 genome editing. For common SNVs in controls (MAF >1% in the GTEx cohort), the range of median Z-scores and RIVER scores are given for all individuals harboring the minor allele. Missing values indicate that the variant was absent from our cohort. (b) Single-guide RNAs (sgRNAs) for four SNVs found in outliers and four control SNVs in the same genes. (c) Alternate (installed) gDNA and cDNA allele proportions for four rare, coding SNVs in outliers (left) and four matched control SNVs (right). Each gDNA and cDNA sample was sequenced in triplicate (technical replicates). Asterisks denote the Bonferroni-adjusted significance level from a two-sided t-test of the difference between the gDNA and cDNA alternate allele proportions: P < 0.05 (.), P < 0.01 (*), and P < 0.001 (**). Though one control SNV showed a significant difference in the alternate allele proportion between cDNA and gDNA, it displayed an increase rather than a decrease in expression.
Figure 1
Figure 1. Gene expression outliers and sharing between tissues
(a) A multi-tissue outlier. The individual has extreme expression values for the gene AKR1C4 in multiple tissues (red arrows) and the most extreme median expression value across tissues. (b) Outlier expression sharing between tissues, as measured by the proportion of single-tissue outliers that have |Z-score| ≥ 2 with the same effect direction for the corresponding genes in each replication tissue. Tissues are hierarchically clustered by gene expression. (c) Estimated replication rate of multi-tissue outliers in a constant held-out set of tissues for different sets of discovery tissues.
Figure 2
Figure 2. Enrichment of rare variants and ASE in outliers
(a) Enrichment of SNVs, indels, and SVs within 10 kb of the TSS among outliers. For each frequency stratum, we calculated enrichment as the relative risk of having a nearby rare variant given the outlier status (see Methods). Bars indicate 95% Wald confidence intervals. (b) Rare SNV enrichments at increasing Z-score thresholds. Text labels indicate the number of outliers at each threshold. (c) ASE, measured as the magnitude of the difference between the reference-allele ratio and the null expectation of 0.5. The non-outlier category is defined in the Methods.
Figure 3
Figure 3. Stratification of multi-tissue outliers by rare variant classes
We considered rare variants in the gene body and within 10 kb of the gene (200 kb for SVs and enhancers). (a) Enrichment of disjoint variant classes among outliers calculated as log odds ratio with 95% Wald confidence intervals. (b) Enrichment of functional annotations for rare SNVs. (c) Proportion of genes with an outlier potentially explained by each rare variant class. (d) Distribution of median Z-scores for each variant class. (e) For each variant class, distribution of ASE (see Methods) averaged across tissues. Grey lines mark the median values among non-outliers.
Figure 4
Figure 4. Evolutionary constraint of genes with multi-tissue outliers
(a) Distributions of UK10K minor allele frequencies for promoter SNVs in outlier and non-outlier individuals at genes with multi-tissue outliers. (b) Odds ratio of being intolerant to loss-of-function variants for genes with multi-tissue outliers, genes with shared eQTLs (eGenes), genes reported in the GWAS catalog, and OMIM genes. (c) Odds ratio of a gene having a multi-tissue outlier for each of eight sets of genes involved in complex traits or diseases. In (b) and (c) bars represent 95% confidence intervals (Fisher’s exact test).
Figure 5
Figure 5. Performance of RIVER for prioritizing functional regulatory variants
(a) RIVER probabilistic graphical model (see Methods). (b) Predictive power of RIVER compared with an L2-regularized logistic regression model using only genomic annotations. Accuracy was assessed using held-out individuals sharing the same rare SNVs as observed individuals (AUCs compared with DeLong’s approach). (c) Distribution of RIVER scores (shades of blue) as a function of expression and genomic annotation scores. The distributions of variant categories across expression and genomic annotation scores are shown as histograms aligned opposite the corresponding axes.

Comment in

References

    1. Tennessen JA, et al. Evolution and functional impact of rare coding variation from deep sequencing of human exomes. Science. 2012;337:64–9. - PMC - PubMed
    1. Nelson MR, et al. An abundance of rare functional variants in 202 drug target genes sequenced in 14,002 people. Science. 2012;337:100–4. - PMC - PubMed
    1. The UK10K Consortium. The UK10K project identifies rare variants in health and disease. Nature. 2015;526:82–90. - PMC - PubMed
    1. Keinan A, Clark AG. Recent explosive human population growth has resulted in an excess of rare genetic variants. Science. 2012;336:740–3. - PMC - PubMed
    1. Uricchio LH, Zaitlen NA, Ye CJ, Witte JS, Hernandez RD. Selection and explosive growth alter genetic architecture and hamper the detection of causal rare variants. Genome Res. 2016;26:863–73. - PMC - PubMed

Publication types