. 2017 Oct 11;550(7675):249-254.
doi: 10.1038/nature24041.

Dynamic landscape and regulation of RNA editing in mammals

Collaborators, Affiliations

Dynamic landscape and regulation of RNA editing in mammals

Meng How Tan et al. Nature. .

Abstract

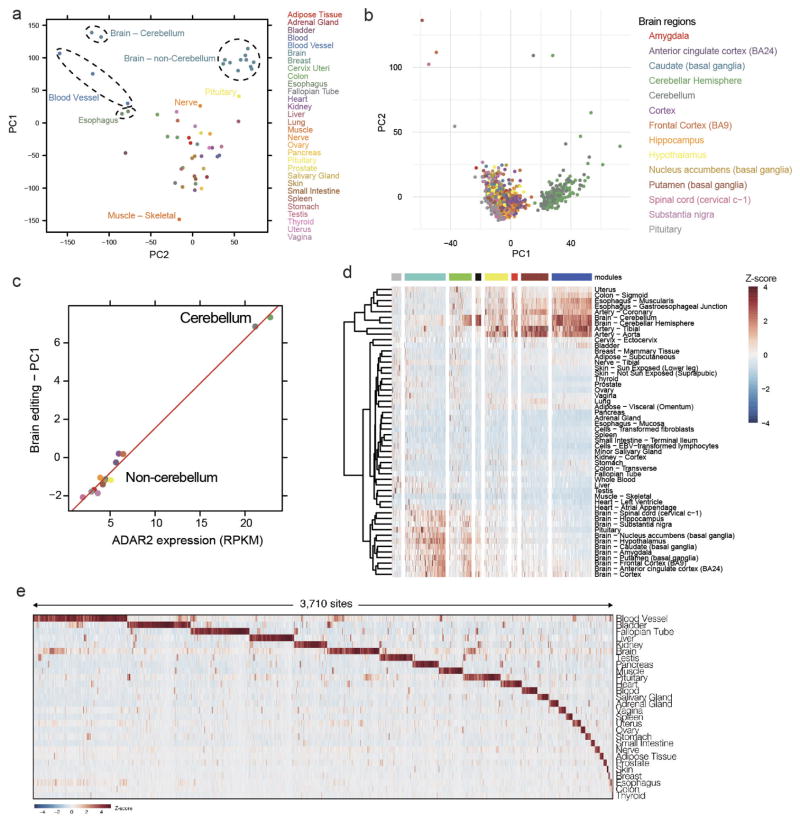
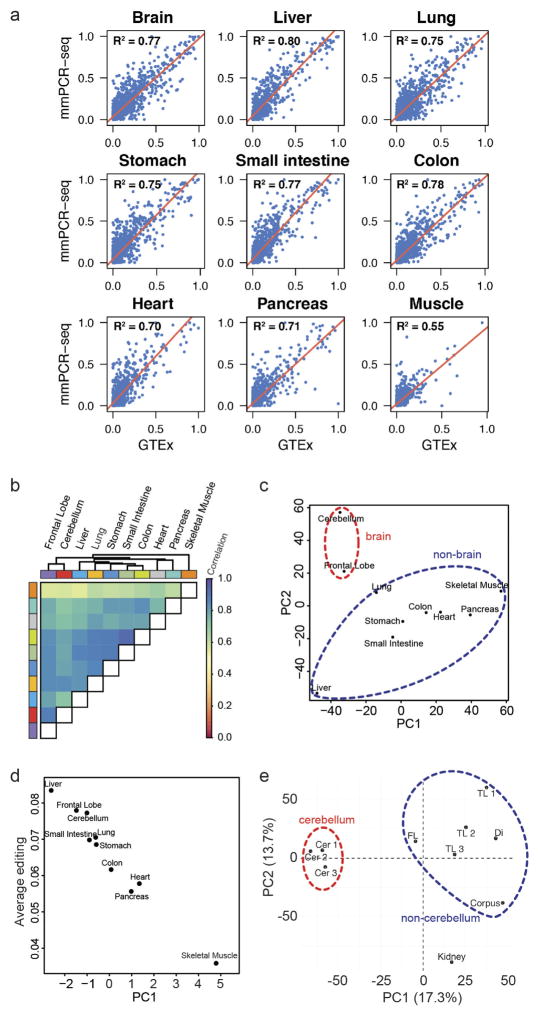
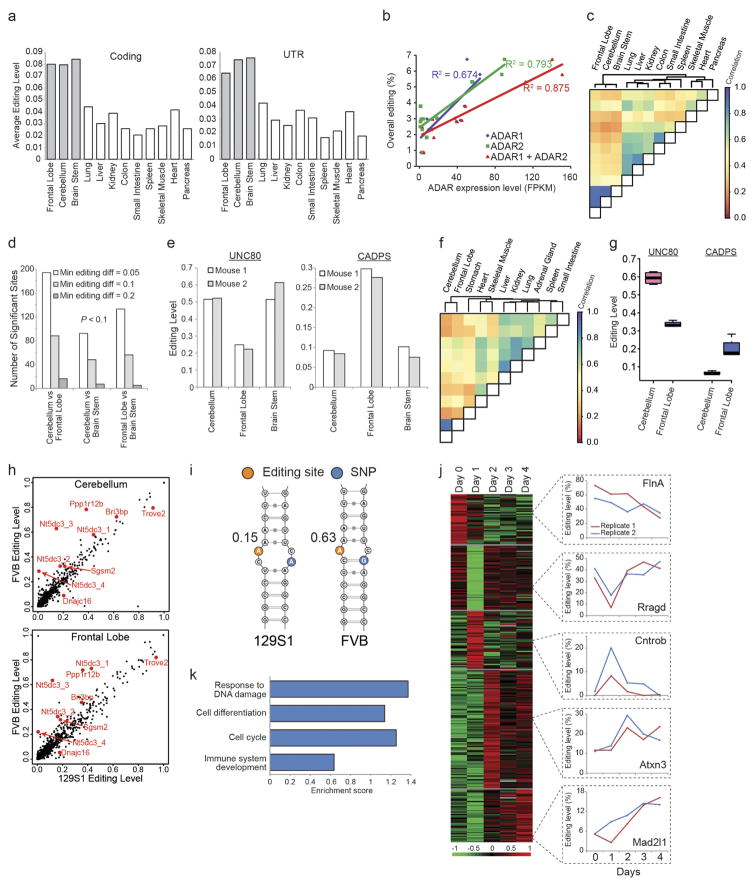
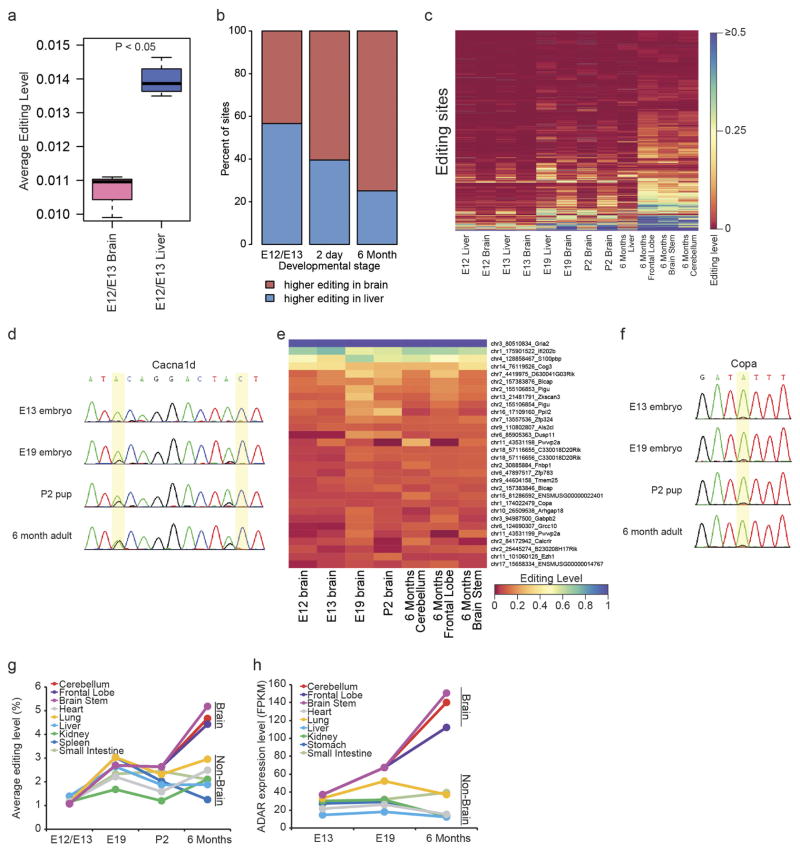
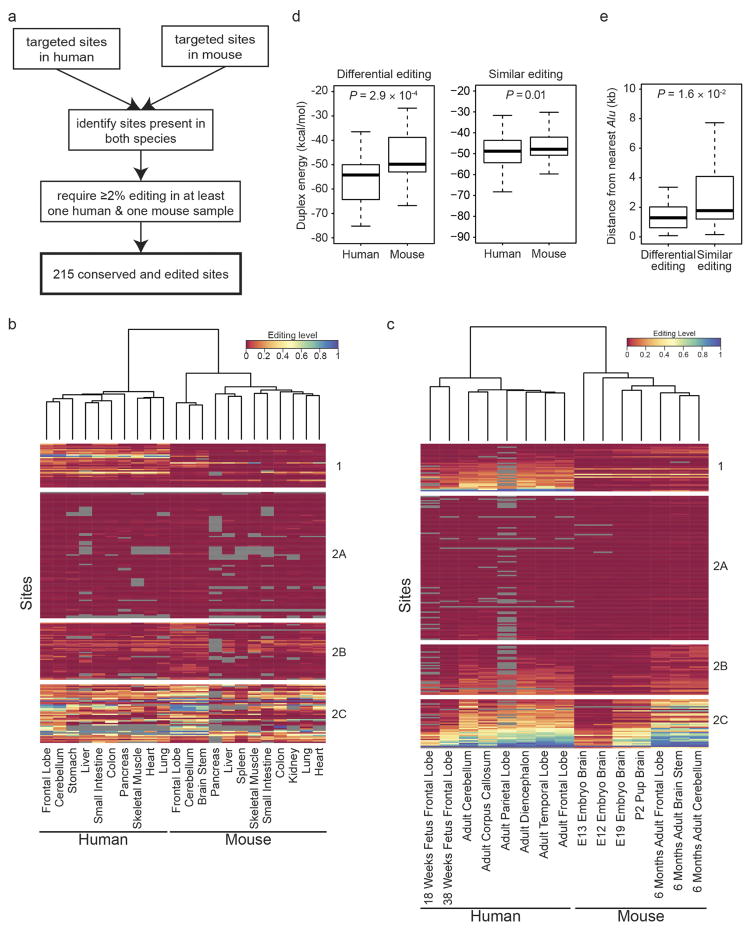
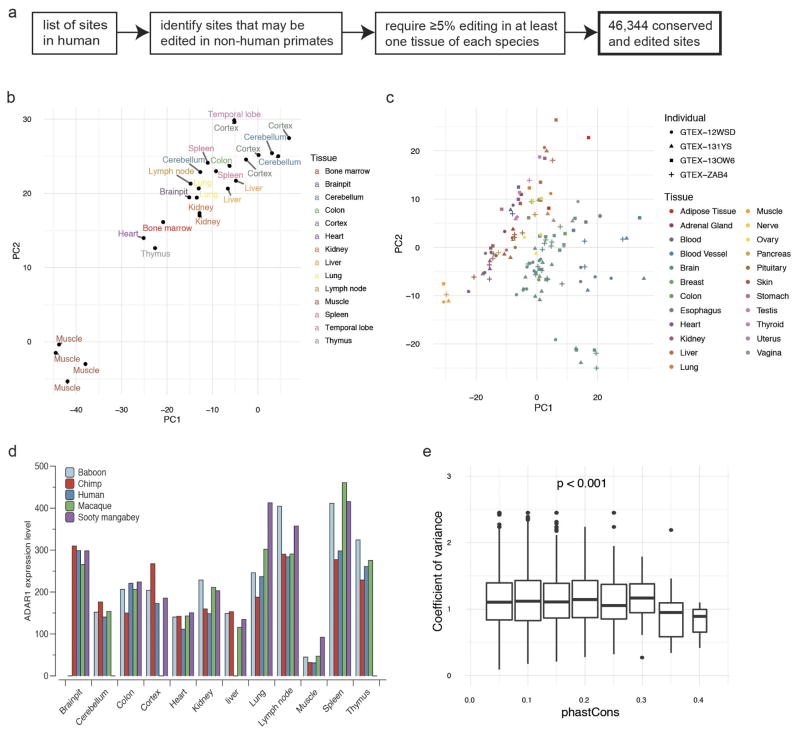
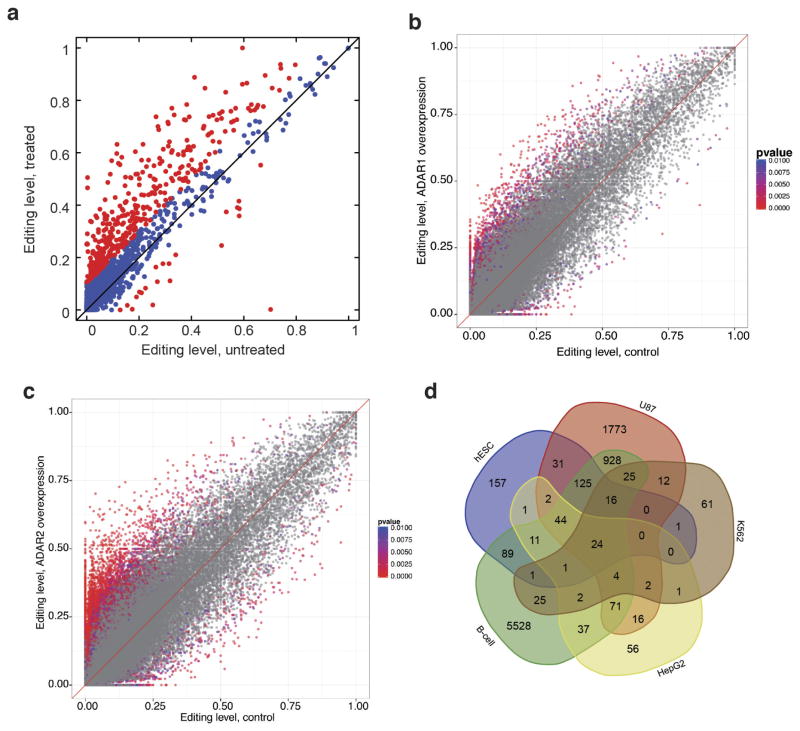
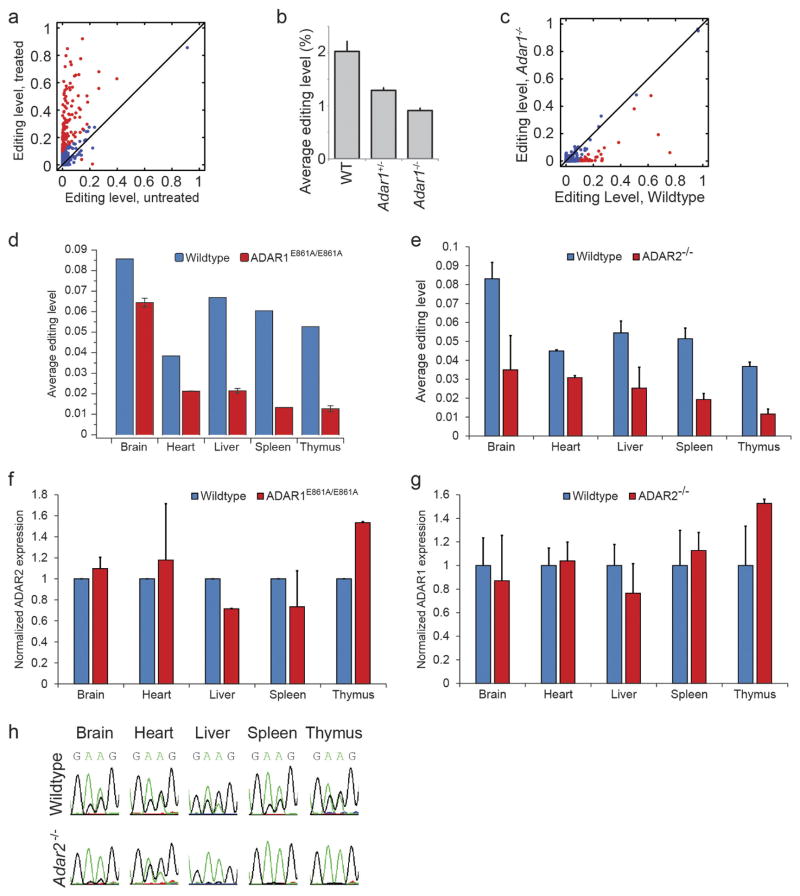
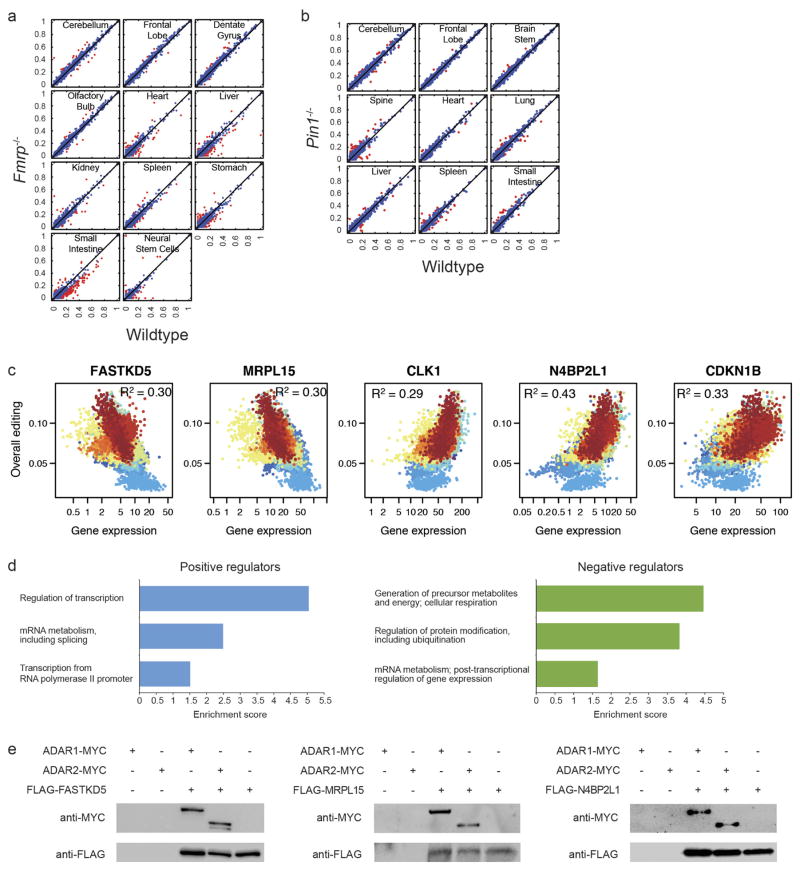
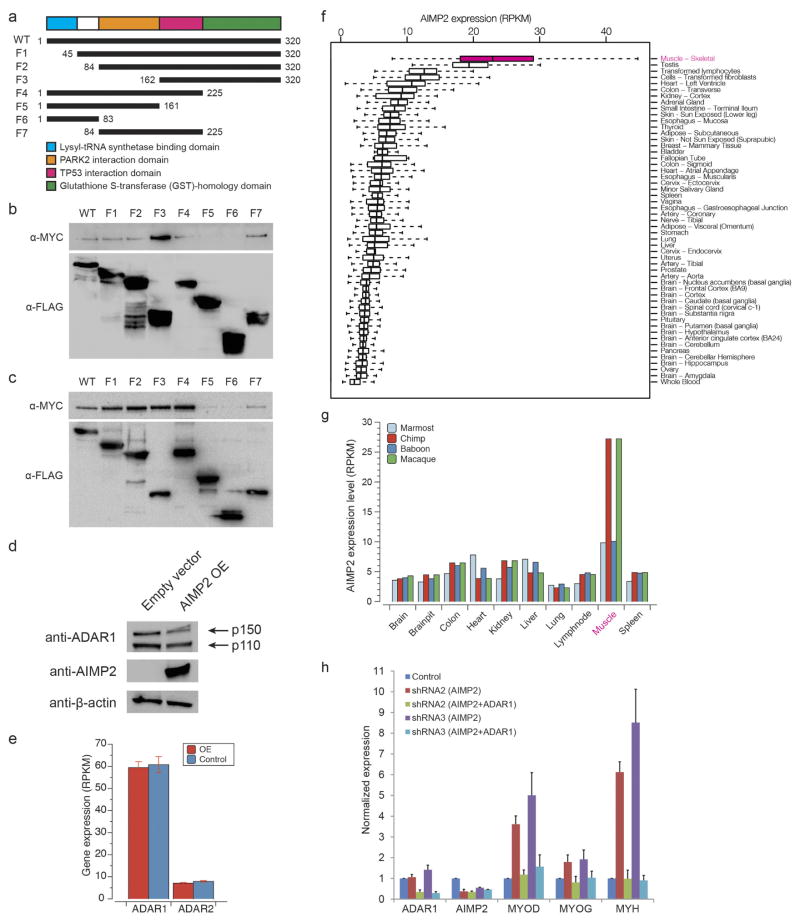
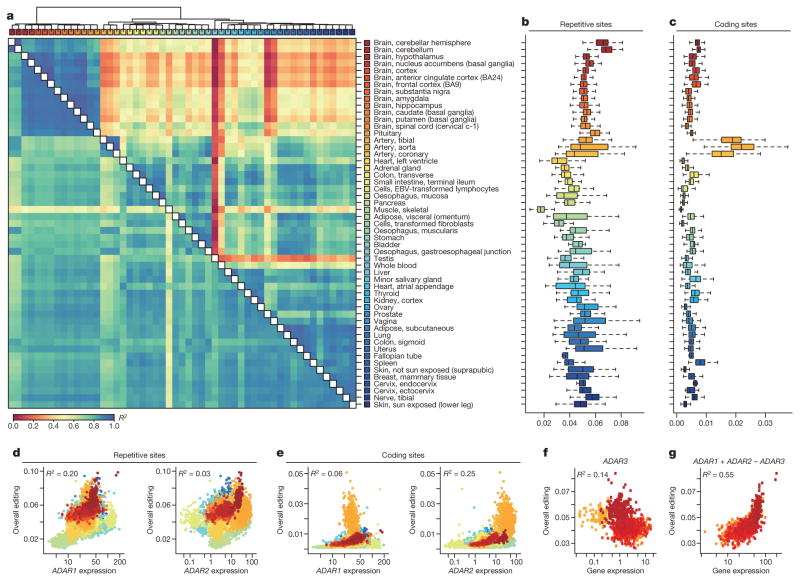
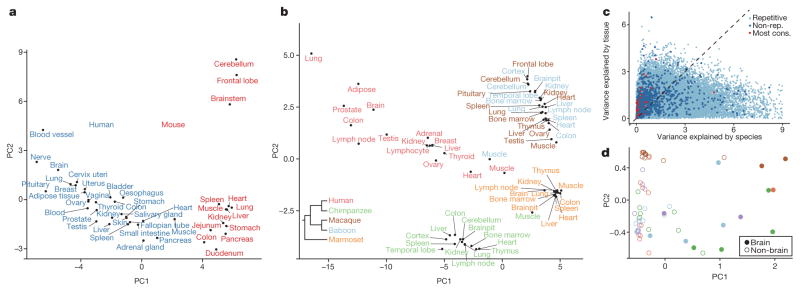
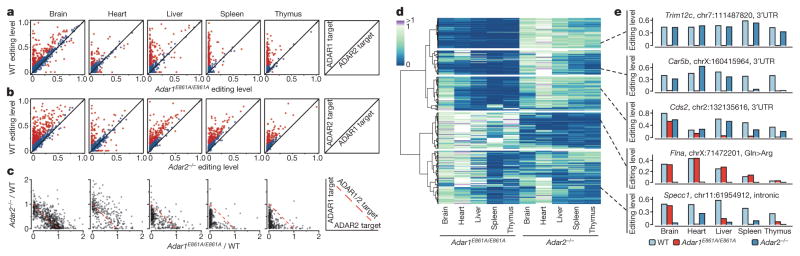
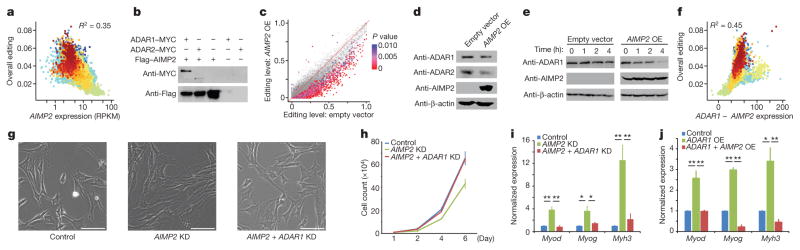
Adenosine-to-inosine (A-to-I) RNA editing is a conserved post-transcriptional mechanism mediated by ADAR enzymes that diversifies the transcriptome by altering selected nucleotides in RNA molecules. Although many editing sites have recently been discovered, the extent to which most sites are edited and how the editing is regulated in different biological contexts are not fully understood. Here we report dynamic spatiotemporal patterns and new regulators of RNA editing, discovered through an extensive profiling of A-to-I RNA editing in 8,551 human samples (representing 53 body sites from 552 individuals) from the Genotype-Tissue Expression (GTEx) project and in hundreds of other primate and mouse samples. We show that editing levels in non-repetitive coding regions vary more between tissues than editing levels in repetitive regions. Globally, ADAR1 is the primary editor of repetitive sites and ADAR2 is the primary editor of non-repetitive coding sites, whereas the catalytically inactive ADAR3 predominantly acts as an inhibitor of editing. Cross-species analysis of RNA editing in several tissues revealed that species, rather than tissue type, is the primary determinant of editing levels, suggesting stronger cis-directed regulation of RNA editing for most sites, although the small set of conserved coding sites is under stronger trans-regulation. In addition, we curated an extensive set of ADAR1 and ADAR2 targets and showed that many editing sites display distinct tissue-specific regulation by the ADAR enzymes in vivo. Further analysis of the GTEx data revealed several potential regulators of editing, such as AIMP2, which reduces editing in muscles by enhancing the degradation of the ADAR proteins. Collectively, our work provides insights into the complex cis- and trans-regulation of A-to-I editing.


Conflict of interest statement

The authors declare no competing financial interests. Readers are welcome to comment on the online version of the paper. Publisher’s note: Springer Nature remains neutral with regard to jurisdictional claims in published maps and institutional affiliations

Figures

Extended Data Figure 1
Extended Data Figure 1. Analysis of GTEx RNA-seq data
a, PCA was applied to the editing levels of all sites in every GTEx body part. The brain tissues were separated from other non-brain tissues. b, A focused PCA of editing in individual brain tissues highlighted that the cerebellum was distinct from other brain regions. c, Correlation between the first editing principal component (PC1) and the expression level of ADAR2 in various brain tissues. d, Co-editing network analysis of 2,094 sites that exhibited high variation across tissues (coefficient of variance >0.8) detected 8 regulatory modules (coloured in grey, turquoise, green, black, yellow, red, brown and blue). e, Heat map of editing levels from sites that are specifically edited in a single human tissue. The editing levels are normalized across samples for each site.
Extended Data Figure 2
Extended Data Figure 2. Analysis of adult human tissues by mmPCR–seq
a, Comparisons between mmPCR–seq editing level measurements and RNA-seq data from the GTEx project for different human tissues. R2 values were calculated by simple linear regression. b, Pearson correlations between the editing profiles of different adult human tissues from a single individual (N37), as measured by mmPCR–seq. c, PCA of editing levels in different tissues from N37 revealed that the brain samples were separated from non-brain samples. d, Scatterplot between the loading of PC1 and the average editing level for each N37 tissue. PC1, which explained over 30% of the editing differences between tissues, corresponded to average editing levels of the tissues. Editing activity was lowest in the skeletal muscle of N37, similar to what was observed in the GTEx data. e, PCA of editing in various brain tissues from a single individual (N6) revealed that the cerebellum was distinct from other brain anatomical regions. Cer, cerebellum; Corpus, corpus callosum; Di, diencephalon; FL, frontal lobe; TL, temporal lobe.
Extended Data Figure 3
Extended Data Figure 3. Analysis of adult mouse tissues by mmPCR–seq
a, Average editing levels of sites at coding and untranslated region (UTR) positions in 12 mouse tissues from a single individual (129S1 strain). b, Correlations between ADAR expression levels (quantified as the number of RNA-seq fragments per kilobase of transcript per million mapped reads (FPKM)) and overall editing levels in different mouse tissues. The overall editing level is defined as the percentage of edited nucleotides at all known editing sites. c, Pearson correlations for the editing levels of individual sites between various adult mouse tissues (129S1 strain). d, Numbers of significantly differentially edited sites between various brain parts from 129S1 adult mice (n =2 biological replicates). e, Editing levels of two exemplary sites that are differentially edited between various brain parts from 129S1 adult mice (n =2 biological replicates). f, Pearson correlations for the editing levels of individual sites between various adult mouse tissues (FVB strain). g, Editing levels of two exemplary sites that are differentially edited between various brain parts from FVB adult mice (n =4 biological replicates). h, Comparison of editing levels in the cerebellum and frontal lobe between mice of two different genetic backgrounds (129S1 and FVB). The editing levels of sites that are marked in red differ by more than 10% between the two mouse strains in both cerebellum and frontal lobe. Editing levels were calculated as the average between technical replicates at reproducible sites (P >0.05, Fisher’s exact test, for the comparison of edited and unedited nucleotide counts between technical replicates). i, Predicted RNA secondary structure for part of the NT5DC3 3′UTR that contains an SNP (blue) and an editing site (orange). The editing site in the FVB strain (edited at 63%) is located in a more stable dsRNA stem than the same site in the 129S1 strain (edited at 15%). j, Changes in RNA editing levels during a four-day period of liver regeneration after carbon tetrachloride (CCl4)-induced injury in the mouse. A total of 262 editing sites were significantly variable from day 0 to day 4 after injury (P <0.2, ANOVA). k-means clustering revealed that the 262 sites can be divided into five distinct groups with different patterns of editing level changes. For each cluster, an exemplary editing site was shown on the right. k, GO analysis of the genes in which editing was dynamically regulated during liver regeneration. During liver injury, hepatocytes undergo necrosis and the surviving hepatocytes proliferate. The enriched GO terms suggest that RNA editing may have an important role during the reparative process of the liver.
Extended Data Figure 4
Extended Data Figure 4. Analysis of mouse development by mmPCR–seq
a, Comparison of average editing levels between mouse brain and liver at mid-embryogenesis stage E12.0–E13.0 (n =4 biological replicates). b, Comparison of RNA editing between mouse brain and liver. At mid-embryogenesis (E12.0–E13.0), most sites are edited at higher levels in the liver than in the brain. However, as development progresses over time (postnatal 2 days and 6 months), the brain becomes the dominant tissue of editing activity instead. c, Heat map of editing levels in mouse liver and brain during development. We observed an overall trend of increased editing over development in brain. d, Sanger validation of two editing sites in the mouse Cacna1d gene that show an increase in editing levels over development. e, A total of 30 sites, in which the editing levels remained stable over development, including the Gria2 Q/R site. These sites were required to have an average editing within the 75th percentile and no significant increase or decrease in editing over development (P >0.02, F-test, and slope <0.01, linear regression). f, Sanger validation of one site in the Copa gene that showed constant editing levels over mouse brain development. g, Average editing levels in different mouse tissues over development. h, ADAR expression levels in different mouse tissues over development.
Extended Data Figure 5
Extended Data Figure 5. Comparison of human and mouse editing landscapes
a, Workflow for the identification of 215 editing sites that are targeted in mmPCR–seq and conserved between and edited in human and mouse. b, Heat map showing editing levels of the 215 conserved sites for various human and mouse adult tissues. The tissues (columns) were clustered hierarchically based on correlations of editing levels between them. The dendrogram on top represents the distances between tissue samples. Sites (rows) were clustered into positions that either differed significantly in editing between human and mouse (group 1) (P <0.01, Wilcoxon rank sum test) or were similarly edited between the two species (groups 2A, 2B and 2C). Group 2A: highest editing level <0.04 in both human and mouse; group 2B: 0.04 ≤highest editing level <0.2; group 2C: highest editing level ≥0.2. c, Heat map showing editing levels of the 215 conserved sites for various human and mouse developmental stages. Clustering was performed in a similar manner to that in b, and the same groupings were used. d, RNA duplex free energies for human and mouse sites with differential (group 1) or similar (groups 2A, 2B and 2C) levels of editing. The secondary structures in human displayed significantly lower free energy than those in mouse (P <0.001, Wilcoxon rank sum test) for group 1 sites, which were generally edited at higher levels in human and primarily responsible for the separation of human and mouse in the clustering. e, Distance from nearest Alu element for differentially edited sites (group 1) and similarly edited sites (groups 2A, 2B and 2C). In human, group 1 sites were significantly closer to Alu repeats than group 2 sites (P <0.05, Wilcoxon rank sum test).
Extended Data Figure 6
Extended Data Figure 6. Comparison of editing landscapes across different primates
a, Workflow for the identification of 46,344 editing sites that are conserved between and edited in human and non-human primates. b, PCA of editing profiles in various tissues from different chimpanzee individuals. The samples are largely separated by tissue type. c, PCA of editing profiles in various tissues from four human subjects who participated in the GTEx project. We selected the top four individuals with RNA-seq data from the most number of tissue types. d, ADAR1 expression levels in various tissues of human and four non-human primates. e, Distribution of editing variance with sites binned according to the extent to which their surrounding sequences are conserved between different primates. Sites that are more highly conserved between species (high phastCons scores) showed lower variation in editing (low coefficient of variance). PhastCons scores were calculated using 500 bp flanking each editing site. Association test was performed using ANOVA.
Extended Data Figure 7
Extended Data Figure 7. Identification of ADAR1 and ADAR2 targets in human
a, Editing levels for human 2fTGH cells that were either untreated or treated with IFNα. Sites that differ in editing by more than 10% between untreated and treated samples are marked in red. GO analysis of the differentially edited sites revealed a functional enrichment for genes involved in viral response or cytokine production, fatty acid metabolism, and intracellular transport. b, Comparison of editing levels between HEK293T cells with ADAR1 overexpression and control cells. P values were calculated using the Fisher’s exact test. c, Comparison of editing levels between HEK293T cells with ADAR2 overexpression and control cells. P values were calculated using the Fisher’s exact test. d, Venn diagram showing number of ADAR1 targets identified from different ADAR1 knockdown cell lines (see Supplementary Note 5 for details).
Extended Data Figure 8
Extended Data Figure 8. Identification of ADAR1 and ADAR2 targets in mouse
a, Editing levels for mouse embryonic fibroblasts that were either untreated or treated with IFNα. Sites that differ in editing by more than 10% between untreated and treated samples are marked in red. b, Average editing levels for wild-type, Adar1+/− and Adar1−/− E12.0 mouse embryos. Error bars represent s.d. of two (wild type), seven (Adar1+/−), or five (Adar1−/−) biological replicates. c, Comparison of editing levels between wild-type and Adar1−/− E12.0 mouse embryos. Sites that differ in editing by more than 10% between wild-type and knockout mice are marked in red. d, Average editing levels of sites in different tissues from wild-type and Adar1E861A/E861A mice. Error bars represent s.d. of two biological replicates. e, Average editing levels of sites in different tissues from wild-type and Adar2−/− mice. Error bars represent s.d. of two (heart), four (spleen and thymus), or six (brain and liver) biological replicates. f, Normalized expression levels of Adar2 in various tissues from wild-type and Adar1E861A/E861A mice. Error bars represent s.d. of two biological replicates. g, Normalized expression levels of Adar1 in various tissues from wild-type and Adar2−/− mice. Error bars represent s.d. of two (heart), four (spleen and thymus), or six (brain and liver) biological replicates. h, Chromatograms from Sanger sequencing of two clustered sites on chromosome X at positions 160415964 and 160415965 in the Car5b gene (reverse strand) are shown as examples for different modes of regulation across tissues.
Extended Data Figure 9
Extended Data Figure 9. Analysis of FMRP, PIN1 and other potential regulators of RNA editing
a, Comparison of average editing levels in 10 tissues and neural stem cells of wild-type and Fmrp−/− mice at reproducible sites (s.d. <10% in wild-type and Fmrp−/− replicates). Sites that differ by more than 10% in editing levels between wild-type and Fmrp−/− mice are marked in red. b, Comparison of average editing levels in 9 tissues of wild-type and Pin1−/− mice at reproducible sites (s.d. <10% in wild-type and Pin1−/− replicates). Sites that differ by more than 10% in editing levels between wild-type and Pin1−/− mice are marked in red. c, Correlation of the expression levels of the top negative (FASTKD5 and MRPL15) or positive (CLK1, N4BP2L1 and CDKN1B) candidate regulators with overall editing of all sites in the GTEx samples. R2 values were calculated by robust linear regressions on overall editing levels and logarithmic transformed RPKM values. d, GO analysis of the 144 putative positive regulators and 147 putative negative regulators of editing. The top three biological processes that are reported by both DAVID and Panther are given for each set of regulators. e, Both ADAR1 and ADAR2 co-immunoprecipitates with FASTKD5, MRPL15 and N4BP2L1. HEK293T cell lysates were incubated with anti-Flag M2 beads to immunoprecipitate each regulator and concurrently pull down the ADAR enzymes.
Extended Data Figure 10
Extended Data Figure 10. Characterization of AIMP2 as a negative regulator of RNA editing
a, Deletion mapping of AIMP2. The schematic diagram depicts the wild-type AIMP2 gene and various fragments (F1–F7) of AIMP2 that were tested for interaction with the ADAR enzymes. The first and last numbers of each construct indicate the amino acid residues that were included in that particular fragment. b, c, Co-immunoprecipitation experiments using anti-Flag M2 beads revealed that only fragments F5 and F6 failed to interact biochemically with ADAR1 (b) and ADAR2 (c), thereby suggesting that the TP53 interaction domain (in pink) is required for AIMP2 to bind with ADAR1 and ADAR2. Additionally, the PARK2 interaction domain (in orange) seems to hinder the interaction of AIMP2 with ADAR1 because its absence in fragment F3 led to an increase in the amount of ADAR1 that was pulled down together with the regulator. d, Western blot analysis showed that overexpression of AIMP2 in MCF7 cells reduced the protein levels of both the p150 and p110 isoforms of ADAR1. e, Expression levels of ADAR1 and ADAR2 in HEK293T cells with or without AIMP2 overexpression, as assayed by RNA-seq. f, Expression levels of AIMP2 in various human tissues from the GTEx RNA-seq datasets. g, Expression levels of AIMP2 in various non-human primate tissues from the NHPRTR RNA-seq datasets. h, Replications of Fig. 4i with independent shRNAs.
Figure 1
Figure 1. The GTEx multi-tissue RNA editome
a, Heat map and dendrogram of Pearson correlations on the editing levels of 53 tissues calculated using all sites (below diagonal) or non-repetitive coding sites only (above diagonal). The dendrogram was drawn based on the distance metric computed by non-repetitive coding sites. The colour codes for GTEx tissues are the same as in a throughout, unless otherwise specified. b, c, Overall editing levels of repetitive (b) or non-repetitive (c) coding sites in various human tissues. Each box plot represents samples from one tissue type. Tissues are in the same order as in a (top to bottom). The overall editing level is defined as the percentage of edited nucleotides at all known editing sites. d, e, Correlations between expression levels of ADAR1 (quantified as the number of RNA-seq reads per kilobase of transcript per million mapped reads (RPKM)) and overall editing levels of either repetitive (d) or non-repetitive (e) coding sites in 8,551 GTEx samples. R2 values were calculated by robust linear regressions on overall editing levels and logarithmic transformed RPKM values. f, Correlation between the expression level of ADAR3 and overall editing level in various brain tissues. g, Correlation of ADAR1 and ADAR2 expression with overall editing of all sites in the brain tissues when the negative influence of ADAR3 was taken into account.
Figure 2
Figure 2. Comparison of A-to-I editing between different mammals
a, PCA on editing levels of various human (red) and mouse (blue) tissues. The editing levels for human were determined by averaging across GTEx samples of the same tissue type for each site. The editing levels for mouse were measured by RNA-seq data of various tissues (see Methods). b, PCA on editing levels of various human and non-human primate tissues. In total, editing levels measured from 68 samples spanning 26 tissue types were used for PCA. We averaged the editing levels for samples of the same tissue type from the same species. Inset, phylogenetic tree of the five primate species under consideration. The editing levels for human and non-human primates were all measured using the RNA-seq data from NHPRTR for consistency. c, Estimation of the extent to which variation in editing level of each site could be attributed to differences in tissues or species. The light and dark blue dots represent repetitive and non-repetitive sites, respectively. The red dots represent the 59 conserved sites identified in a recent study. The variation in editing of these sites was mostly explained by tissue differences, with the exception of an intronic site in BLCAP, which is not edited in non-human primates. d, PCA on editing levels of various human and non-human primate tissues using only the 59 conserved sites. Colours around the circles denote species, using the same colour scheme as in b. The brain samples segregated from the non-brain samples.
Figure 3
Figure 3. Dynamic regulation of RNA editing by ADAR1 and ADAR2
a, b, Comparison of editing levels in five tissues between wild-type (WT) and Adar1E861A/E861AIfih1−/− adult mice (a), and between wild-type and Adar2−/−Gria2R/R adult mice (b). Sites that are differentially edited (≥10% editing level difference between wild-type and mutant mouse) are marked in red. The diagram on the right illustrates how ADAR1 and ADAR2 targets are determined by comparing their editing levels between wild-type and mutant mice. c, Comparison of editing ratios between Adar1E861A/E861AIfih1−/− and wild-type mice, and between Adar2−/−Gria2R/R and wild-type mice. The editing ratio is defined as the editing level in the ADAR editing-deficient mutant divided by the editing level in the wild-type mouse. The diagram on the right illustrates how ADAR1 and ADAR2 targets are determined by comparing their editing ratios. d, Heat map and dendrogram of hierarchical clustering of editing sites using editing ratios between either Adar1E861A/E861AIfih1−/− or Adar2−/−Gria2R/R and wild-type mice in five adult mouse tissues. The editing sites could be divided into five distinct clusters (1 to 5, top to bottom), three of which exhibit tissue-specific regulation by ADAR1 and ADAR2. Cluster 1, sites mostly affected by ADAR1 but unaffected by ADAR2 in all five tissues; cluster 2, sites mostly affected by ADAR1 in all five tissues while also being affected by ADAR2 in some tissues; cluster 3, sites mostly affected by both ADAR1 and ADAR2 in brain, while mostly by ADAR1 in the other four tissues; cluster 4, sites mostly affected by ADAR2 in all five tissues; cluster 5, sites affected by both ADAR1 and ADAR2 at different levels in five tissues. e, Exemplary sites for each cluster highlighting the complex regulation of A-to-I editing by the ADAR enzymes.
Figure 4
Figure 4. Identification of AIMP2 as a negative regulator of A-to-I editing
a, Correlation of AIMP2 expression with overall editing of all sites in the GTEx samples. R2 values were calculated by robust linear regressions on overall editing levels and logarithmic transformed RPKM values. b, Co-immunoprecipitation experiment with either MYC-tagged ADAR1 or MYC-tagged ADAR2 and 3×Flag-tagged AIMP2 in HEK293T cells. Anti-Flag M2 beads were used to immunoprecipitate the regulator, and anti-MYC was then used to probe whether the relevant editing enzyme was pulled down together with AIMP2. c, Comparison of editing levels between control cells and cells with AIMP2 overexpressed (OE). The red-purple coloured dots indicate the differentially edited sites (P <0.01, Fisher’s exact test). d, Western blot analysis of ADAR1 and ADAR2 protein levels with or without overexpression of AIMP2 in HEK293T cells. Only the p110 isoform of ADAR1 was detected. e, Cycloheximide-chase analysis followed by western blotting was used to determine the rate at which the ADAR1 p110 protein was degraded with or without AIMP2 overexpression. f, Correlation of ADAR1 expression with overall editing of all sites in the GTEx samples when the negative influence of AIMP2 was taken into account. R2 values were calculated by robust linear regressions on overall editing levels and logarithmic transformed RPKM values. gi, Effect of knocking down (KD) either AIMP2 alone or both AIMP2 and ADAR1 concurrently in undifferentiated C2C12 myoblasts. Morphology (g), proliferation rate (h) and expression (i) of muscle-specific markers. Myh3, myosin heavy chain; Myod, myogenic differentiation 1; Myog, myogenin. Scale bars, 100 μm. j, Effect of overexpressing ADAR1 alone or both ADAR1 and AIMP2 together in C2C12 myoblasts on the expression of muscle-specific markers. *P <0.05, **P <0.01, Student’s t-test. Error bars denote s.e.m. from three biological replicates.

Comment in

References

    1. Nishikura K. Functions and regulation of RNA editing by ADAR deaminases. Annu Rev Biochem. 2010;79:321–349. - PMC - PubMed
    1. Bahn JH, et al. Accurate identification of A-to-I RNA editing in human by transcriptome sequencing. Genome Res. 2012;22:142–150. - PMC - PubMed
    1. Danecek P, et al. High levels of RNA-editing site conservation amongst 15 laboratory mouse strains. Genome Biol. 2012;13:R26. - PMC - PubMed
    1. Li JB, et al. Genome-wide identification of human RNA editing sites by parallel DNA capturing and sequencing. Science. 2009;324:1210–1213. - PubMed
    1. Peng Z, et al. Comprehensive analysis of RNA-Seq data reveals extensive RNA editing in a human transcriptome. Nat Biotechnol. 2012;30:253–260. - PubMed

Publication types

Grants and funding