. 2017 Oct 12;13(10):e1005580.
doi: 10.1371/journal.pcbi.1005580. eCollection 2017 Oct.

Incorporating networks in a probabilistic graphical model to find drivers for complex human diseases

Affiliations

Incorporating networks in a probabilistic graphical model to find drivers for complex human diseases

Aziz M Mezlini et al. PLoS Comput Biol. .

Abstract

Discovering genetic mechanisms driving complex diseases is a hard problem. Existing methods often lack power to identify the set of responsible genes. Protein-protein interaction networks have been shown to boost power when detecting gene-disease associations. We introduce a Bayesian framework, Conflux, to find disease associated genes from exome sequencing data using networks as a prior. There are two main advantages to using networks within a probabilistic graphical model. First, networks are noisy and incomplete, a substantial impediment to gene discovery. Incorporating networks into the structure of a probabilistic models for gene inference has less impact on the solution than relying on the noisy network structure directly. Second, using a Bayesian framework we can keep track of the uncertainty of each gene being associated with the phenotype rather than returning a fixed list of genes. We first show that using networks clearly improves gene detection compared to individual gene testing. We then show consistently improved performance of Conflux compared to the state-of-the-art diffusion network-based method Hotnet2 and a variety of other network and variant aggregation methods, using randomly generated and literature-reported gene sets. We test Hotnet2 and Conflux on several network configurations to reveal biases and patterns of false positives and false negatives in each case. Our experiments show that our novel Bayesian framework Conflux incorporates many of the advantages of the current state-of-the-art methods, while offering more flexibility and improved power in many gene-disease association scenarios.


Conflict of interest statement

The authors have declared that no competing interests exist.

Figures
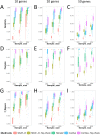
Fig 1
Fig 1. Sensitivity (A-C), precision (D-F) and F-Measure (G-I) as a function of the complexity of the disease (the number of selected causal genes), evaluated for our method (Conflux), SKAT-O and Hotnet2.
The columns represent increasing complexity of simulated diseases: 10, 20 and 50 causal genes respectively, from left to right. The sample size is varied from 200 to 800 on the x-axis of each experiment (the sample size is equal to the number of cases plus the number of controls). Sensitivity (Power) is the proportion of simulated causal genes that are detected by the method. Precision is the proportion of detected genes that are true causal genes as opposed to false positives. The F-Measure is a harmonic mean of sensitivity and precision.
Fig 2
Fig 2. Results of Hotnet2 and Conflux on two Star-shaped disease subnetwork where the center is not a causal gene.
A) KRAS centered star B) GATA3 centered star. The nodes in purple are genes found by both Hotnet2 and Conflux. The nodes in cyan were only found by Hotnet2. The nodes in red and pink are respectively nodes detected (marginal ≥ 0.2) or having suggestive evidence (marginal ≥ 0.05) by Conflux. Nodes colored in plum were found by Hotnet2 but only have suggestive evidence in Conflux. Yellow nodes are true causal genes that were neither found nor suggested by any method. The diamond shaped nodes are the true causal genes. The sample size used is n = 800.
Fig 3
Fig 3. Results of Hotnet2 and Conflux on clique-shaped disease subnetworks where the disease genes are part of an even larger clique.
(A) Causal subnetwork contains a third of the genes in the clique; (B) Causal subnetwork is half of the genes in the largest clique. The nodes in purple are genes found by both Hotnet2 and Conflux. The nodes in cyan were only found by Hotnet2. The nodes in red and pink are respectively nodes detected (marginal ≥ 0.2) or having suggestive evidence (marginal ≥ 0.05) by Conflux. Nodes colored in plum were found by Hotnet2 but only have suggestive evidence in Conflux. The diamond shaped nodes are the true causal genes. The sample size used is n = 800.
Fig 4
Fig 4. Results of Hotnet2 and Conflux on two radomly generated chain-shaped disease subnetworks.
(A) Chain of 20 causal genes. (B) Chain of 10 causal genes. The nodes in purple are genes found by both Hotnet2 and Conflux. The nodes in cyan were only found by Hotnet2. The nodes in red and pink are respectively nodes detected (marginal ≥ 0.2) or having suggestive evidence (marginal ≥ 0.05) by Conflux. Nodes colored in plum were found by Hotnet2 but only have suggestive evidence in Conflux. The diamond shaped nodes are the true causal genes. The sample size used is n = 800.
Fig 5
Fig 5. Results of Hotnet2 and Conflux on a literature reported disease subnetwork.
(A) Schizophrenia. (B) Epilepsy. (C) ASD1. (D) ASD2. (E) Ovarian Cancer. The nodes in purple are genes found by both Hotnet2 and Conflux. The nodes in cyan were only found by Hotnet2. The nodes in red and pink are respectively nodes detected (marginal ≥ 0.2) or having suggestive evidence (marginal ≥ 0.05) by Conflux. Nodes colored in plum were found by Hotnet2 but only have suggestive evidence in Conflux. Yellow nodes are true causal genes that were neither found nor suggested by any method. The diamond shaped nodes are the true causal genes. The sample size used is n = 800.
Fig 6
Fig 6. Conflux’s hierarchical graphical model.
Graphical model representing the relation between phenotypes, coding variants and gene latent variables with the PPI network used as prior. All the variables, factors and inputs inside the plate are per individual. The variables, factors and inputs outside the plate, such as protein-protein interactions are not individual-specific. This model simultaneously uses all genes genome-wide and is shown here for 3 genes for clarity. The graph on the right is a zoom in on the gene specific portion of the graphical model.

References

    1. Manolio TA, Collins FS, Cox NJ, Goldstein DB, Hindorff LA, Hunter DJ, et al. Finding the missing heritability of complex diseases. Nature. 2009;461(7265):747–753. 10.1038/nature08494 - DOI - PMC - PubMed
    1. Zuk O, Hechter E, Sunyaev SR, Lander ES. The mystery of missing heritability: Genetic interactions create phantom heritability. Proceedings of the National Academy of Sciences. 2012;109(4):1193–1198. 10.1073/pnas.1119675109 - DOI - PMC - PubMed
    1. Hemani G, Knott S, Haley C. An evolutionary perspective on epistasis and the missing heritability. PLoS Genet. 2013;9(2):e1003295 10.1371/journal.pgen.1003295 - DOI - PMC - PubMed
    1. Zuk O, Schaffner SF, Samocha K, Do R, Hechter E, Kathiresan S, et al. Searching for missing heritability: designing rare variant association studies. Proceedings of the National Academy of Sciences. 2014;111(4):E455–E464. 10.1073/pnas.1322563111 - DOI - PMC - PubMed
    1. Schadt EE. Molecular networks as sensors and drivers of common human diseases. Nature. 2009;461(7261):218–223. 10.1038/nature08454 - DOI - PubMed

LinkOut - more resources