. 2017 Oct 12;12(10):e0185481.
doi: 10.1371/journal.pone.0185481. eCollection 2017.

Plant water potential improves prediction of empirical stomatal models

Affiliations

Plant water potential improves prediction of empirical stomatal models

William R L Anderegg et al. PLoS One. .

Abstract

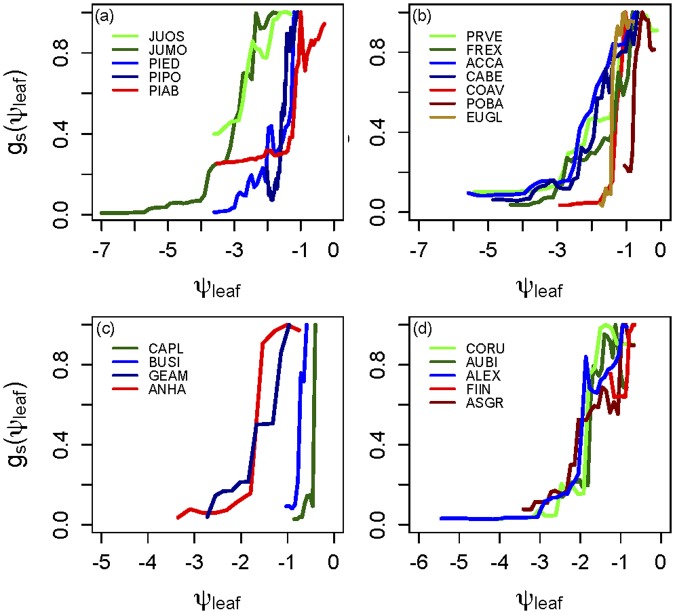
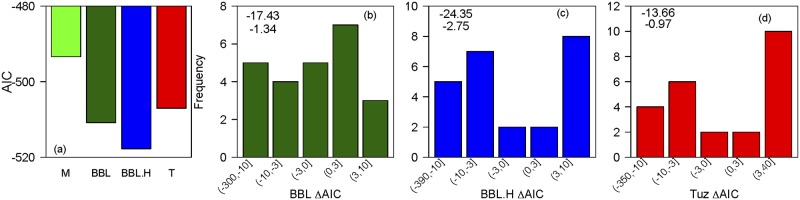
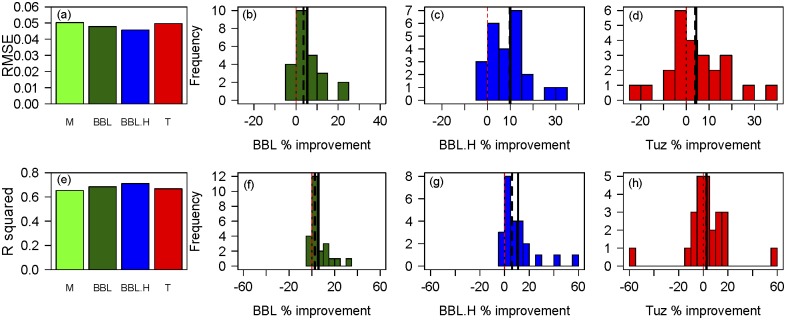
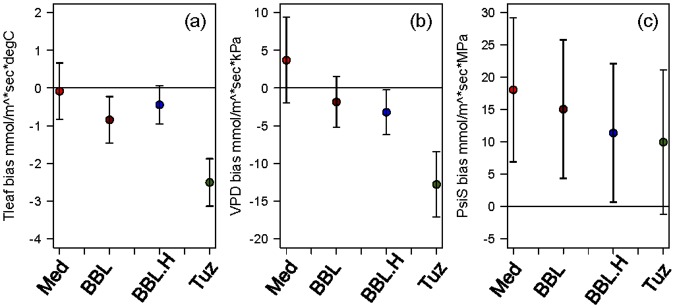
Climate change is expected to lead to increases in drought frequency and severity, with deleterious effects on many ecosystems. Stomatal responses to changing environmental conditions form the backbone of all ecosystem models, but are based on empirical relationships and are not well-tested during drought conditions. Here, we use a dataset of 34 woody plant species spanning global forest biomes to examine the effect of leaf water potential on stomatal conductance and test the predictive accuracy of three major stomatal models and a recently proposed model. We find that current leaf-level empirical models have consistent biases of over-prediction of stomatal conductance during dry conditions, particularly at low soil water potentials. Furthermore, the recently proposed stomatal conductance model yields increases in predictive capability compared to current models, and with particular improvement during drought conditions. Our results reveal that including stomatal sensitivity to declining water potential and consequent impairment of plant water transport will improve predictions during drought conditions and show that many biomes contain a diversity of plant stomatal strategies that range from risky to conservative stomatal regulation during water stress. Such improvements in stomatal simulation are greatly needed to help unravel and predict the response of ecosystems to future climate extremes.


Conflict of interest statement

Competing Interests: AW is currently employed by Arable Labs Inc. Arable Labs Inc does not derive benefits from the publication of this work, and had no role in the funding of the work or other dimensions of participation other than paying the salary of the author. There are no patents, products in development or marketed products to declare. This does not alter our adherence to PLOS ONE policies on sharing data and materials.

Figures

Fig 1
Fig 1. Partial dependency of stomatal conductance (gs) on measured leaf water potential (ψleaf) in (a) temperate gymnosperm species, (b) temperate angiosperm species, (c) tropical deciduous species, and (d) tropical evergreen species.
Y-axis values are scaled from 0–1 by the percentage of stomatal closure reached. Species codes are the first two letters of the genus and the first two letters of the species from Table A in S1 File.
Fig 2
Fig 2
(a) Relationship across species between the water potential at which 50% of stomatal conductance is lost (ψgs50) and the water potential at which 50% of stem hydraulic conductance (ψx50) is lost. Black line is the 1:1 line and red the OLR regression best fit. (b) Histogram of the percent loss of stem hydraulic conductance (PLC) at the water potential at which 50% of stomatal conductance is lost (ψgs50).
Fig 3
Fig 3
(a) Akaike Information Criterion (AIC) value average across all 24 species for the Medlyn (M), Ball-Berry-Leuning (BBL), Ball-Berry-Leuning plus Hydraulics (BBL.H), and Tuzet (T) stomatal conductance models. (b) Frequency of species’ delta-AIC values between the BBL and M models. (c) Frequency of species’ delta-AIC values between the BBLH and M models. (d) Frequency of species’ delta-AIC values between the T and M models. In each of (b-d), the top number is the mean delta-AIC across all species and the lower number is the median delta-AIC.
Fig 4
Fig 4
(a) Root mean squared error (RMSE) and (e) OLS regression R2 between predicted and observed stomatal conductance averaged across all 24 species for the Medlyn (M), Ball-Berry-Leuning (BBL), Ball-Berry-Leuning plus Hydraulics (BBL.H), and Tuzet (T) stomatal conductance models. (b and f) Frequency of species’ % improvement in RMSE and R2 respectively between the BBL and M models. (c and g) Frequency of species’ % improvement in RMSE and R2 respectively between the BBLH and M models. (d and h) Frequency of species’ % improvement in RMSE and R2 respectively between the T and M models.
Fig 5
Fig 5. (a) Slope between the residuals of observed versus predicted stomatal conductance and leaf temperature (Tleaf), (b) vapor pressure deficit (VPD), and (c) soil water potential (PsiS).
Negative values in the Tleaf and VPD plots indicate over-prediction of gs during dry conditions (high Tleaf and high VPD), whereas positive values in the PsiS plot indicates over-prediction of gs during dry conditions. Models are Medlyn (red), Ball-Berry-Leuning (darkred), Ball-Berry-Leuning plus the hydraulic term (blue) and Tuzet (green). Error bars are +/- 1 S.E.
Fig 6
Fig 6. Histogram of species’ percent bias in prediction of stomatal conductance at the 10th percentile of soil water potential.
Negative numbers mean over-prediction of gs by models compared to measured values. Solid line is the mean across species and dashed line the median. Models are (a) Medlyn model, (b) Ball-Berry-Leuning model, (c) Ball-Berry-Leuning plus Hydraulics model, and (d) Tuzet model.

References

    1. Dai A. Drought under global warming: a review. Wiley Interdiscip Rev Clim Change. 2011;2: 45–65.
    1. IPCC. Managing the Risks of Extreme Events and Disasters to Advance Climate Change Adaptation. A Special Report of Working Groups I and II of the Intergovernmental Panel on Climate Change. Cambridge, United Kingdom, and New York, NY, USA: Cambridge University Press; 2012.
    1. Anderegg LDL, Anderegg WRL, Berry JA. Not all droughts are created equal: translating meteorological drought into woody plant mortality. Tree Physiol. 2013;33: 672–683. - PubMed
    1. Williams AP, Allen CD, Macalady AK, Griffin D, Woodhouse CA, Meko DM, et al. Temperature as a potent driver of regional forest drought stress and tree mortality. Nat Clim Change. 2013;3: 292–297. http://www.nature.com/nclimate/journal/v3/n3/abs/nclimate1693.html#suppl...
    1. Ciais P, Reichstein M, Viovy N, Granier A, Ogee J, Allard V, et al. Europe-wide reduction in primary productivity caused by the heat and drought in 2003. Nature. 2005;437: 529–533. http://www.nature.com/nature/journal/v437/n7058/suppinfo/nature03972_S1.... doi: 10.1038/nature03972 - DOI - PubMed