. 2017 Oct 12;12(10):e0185934.
doi: 10.1371/journal.pone.0185934. eCollection 2017.

Unearthing the hidden world of roots: Root biomass and architecture differ among species within the same guild

Affiliations

Unearthing the hidden world of roots: Root biomass and architecture differ among species within the same guild

Katherine Sinacore et al. PLoS One. .

Abstract

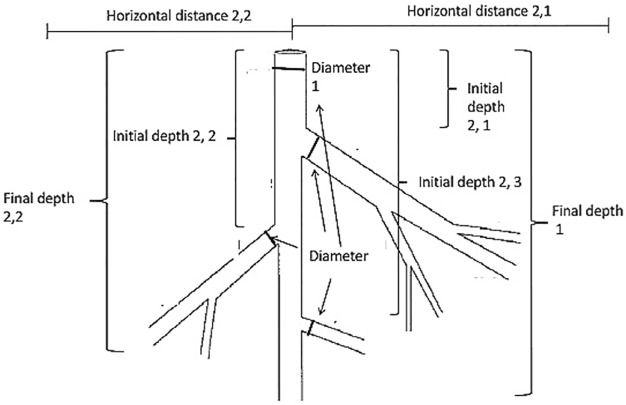
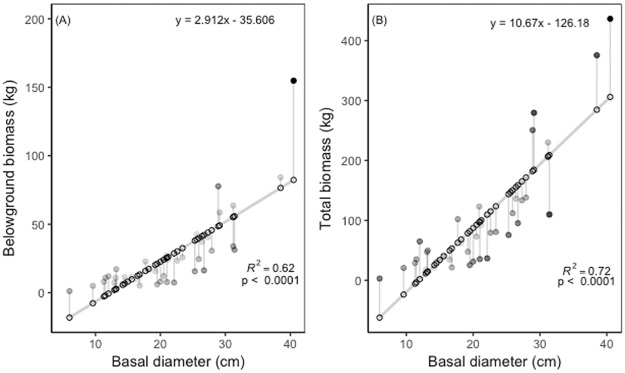
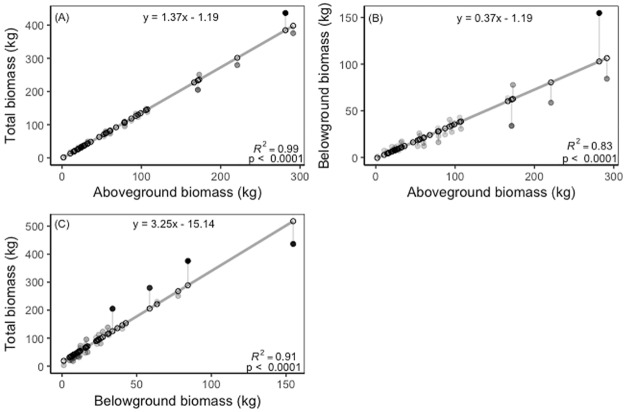
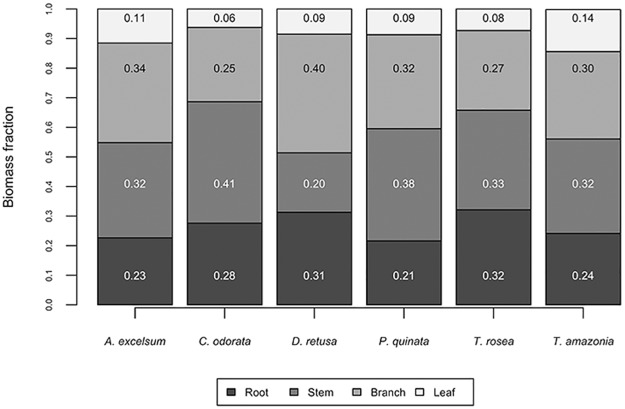
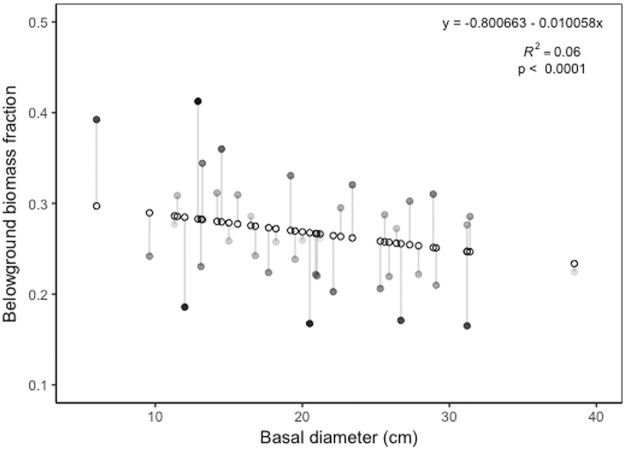
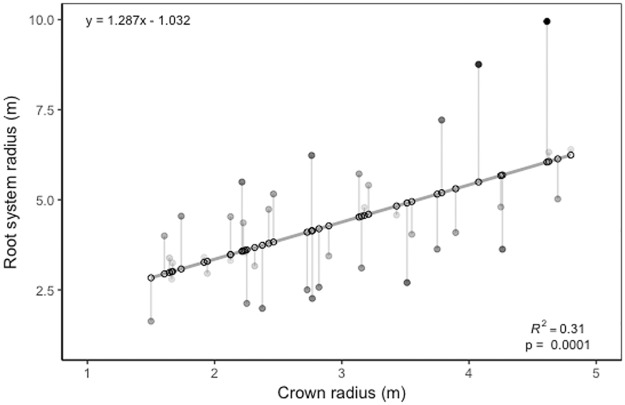
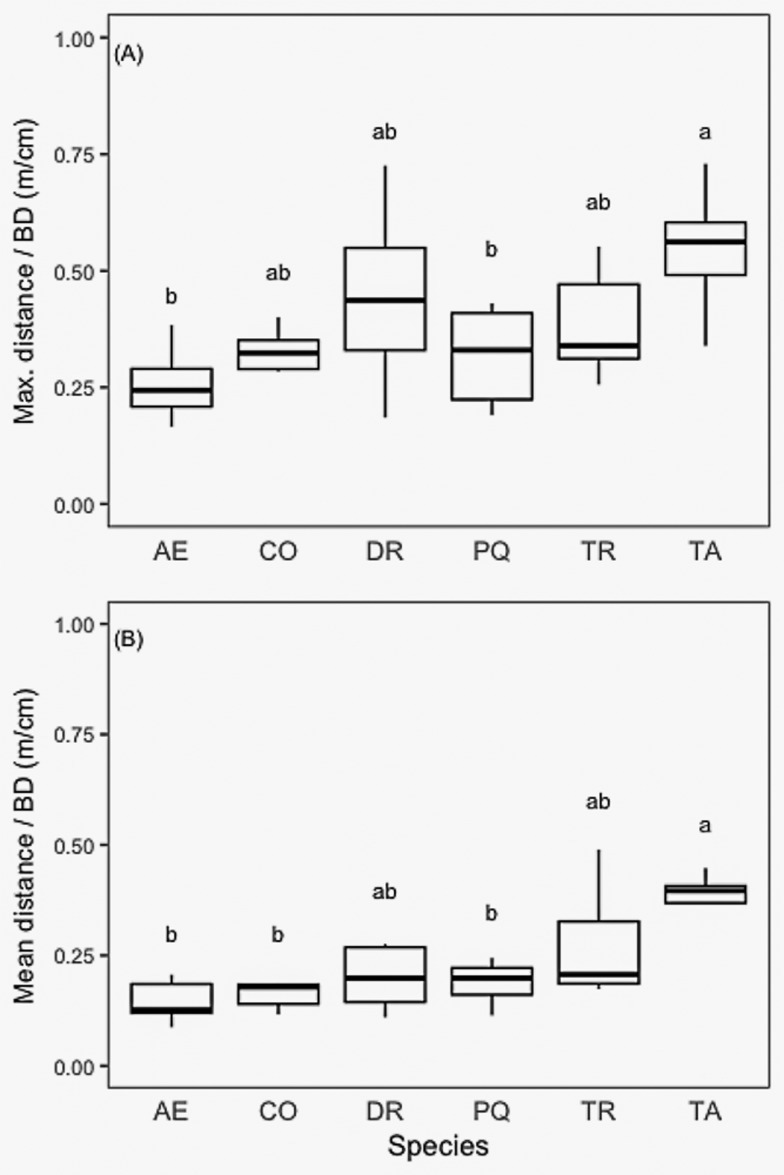
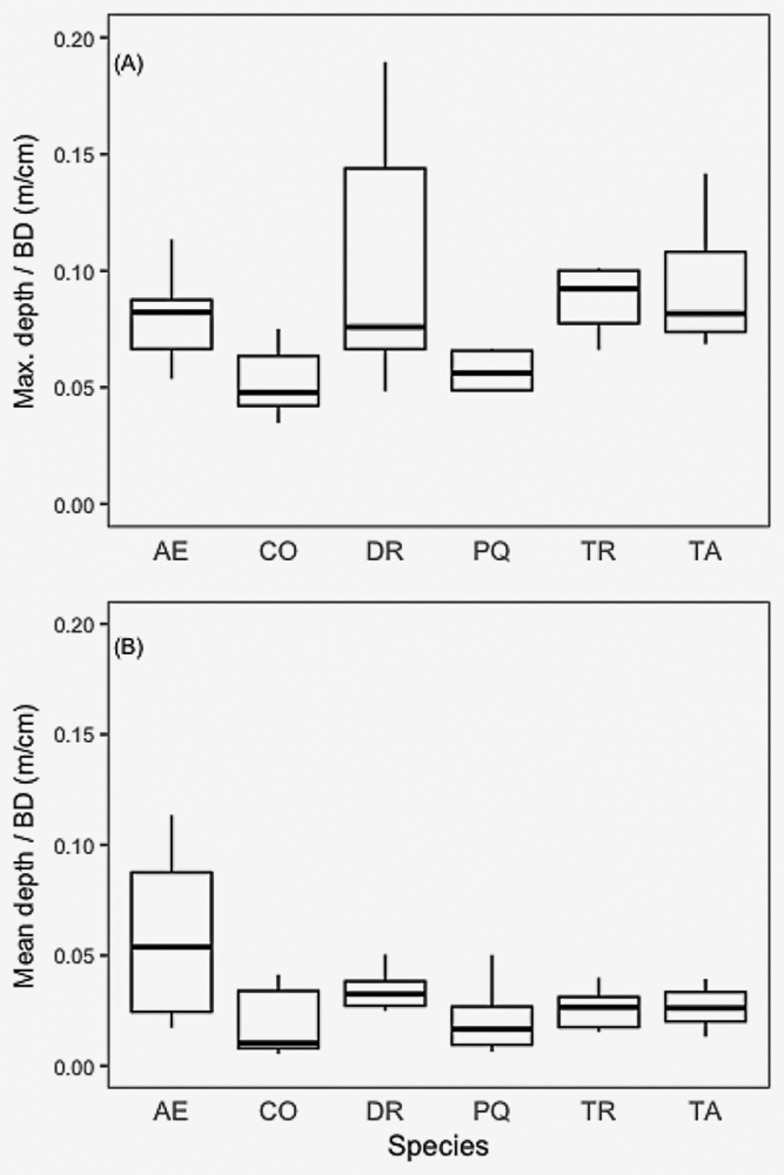
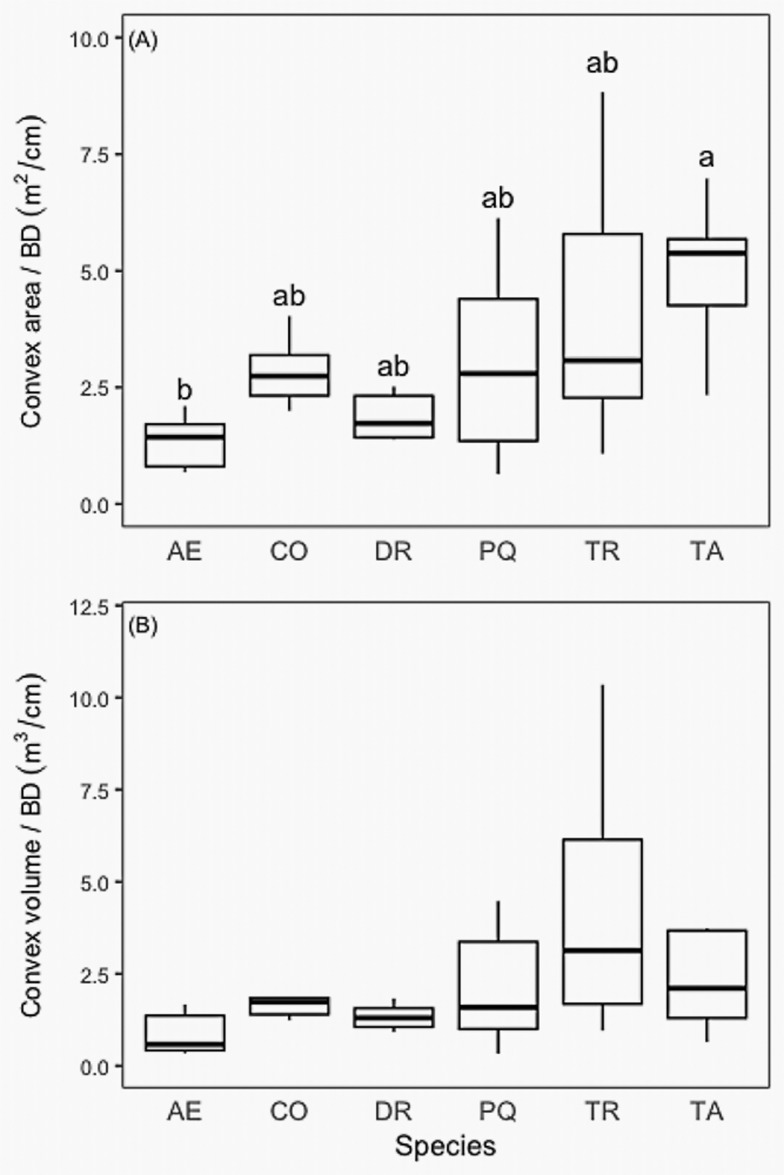
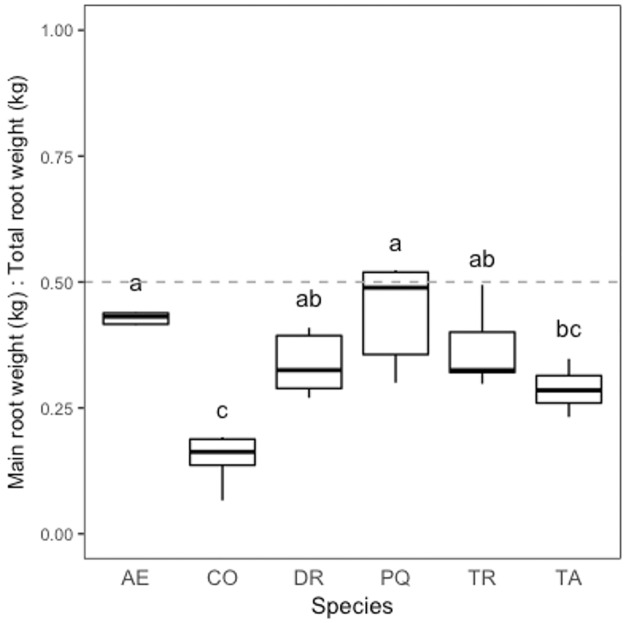
The potential benefits of planting trees have generated significant interest with respect to sequestering carbon and restoring other forest based ecosystem services. Reliable estimates of carbon stocks are pivotal for understanding the global carbon balance and for promoting initiatives to mitigate CO2 emissions through forest management. There are numerous studies employing allometric regression models that convert inventory into aboveground biomass (AGB) and carbon (C). Yet the majority of allometric regression models do not consider the root system nor do these equations provide detail on the architecture and shape of different species. The root system is a vital piece toward understanding the hidden form and function roots play in carbon accumulation, nutrient and plant water uptake, and groundwater infiltration. Work that estimates C in forests as well as models that are used to better understand the hydrologic function of trees need better characterization of tree roots. We harvested 40 trees of six different species, including their roots down to 2 mm in diameter and created species-specific and multi-species models to calculate aboveground (AGB), coarse root belowground biomass (BGB), and total biomass (TB). We also explore the relationship between crown structure and root structure. We found that BGB contributes ~27.6% of a tree's TB, lateral roots extend over 1.25 times the distance of crown extent, root allocation patterns varied among species, and that AGB is a strong predictor of TB. These findings highlight the potential importance of including the root system in C estimates and lend important insights into the function roots play in water cycling.


Conflict of interest statement

Competing Interests: The authors have declared that no competing interests exist.

Figures

Fig 1
Fig 1. Diagram of root sampling.
Diagram of root components measured during excavation process. The main (primary) root was identified as the root that traveled perpendicular to the soil surface (labeled: 1), directly below where the bole of the tree connects (at the top of the diagram). The total depth of the main root was measured from the point of origin to the final depth, which was determined as the point where the diameter of the root was 2 mm. The diameter of the main root was taken at the point of origin. Secondary roots (labeled: 2,1; 2,2; 2,3) were identified as roots originating from the main root. The diameter of the secondary roots was taken at the point where the secondary root connected to the main root. The horizontal distance that secondary roots traveled was measured perpendicular to the soil surface (labeled: Distance 2,1; Distance 2,2). The initial depth of all secondary roots was measured as the vertical depth from the soil surface to the point of origin on the main root. The final depth of all secondary roots was measured as the vertical depth from the soil surface until the point where the diameter of the secondary root reached 2 mm.
Fig 2
Fig 2. (A) Belowground biomass (kg) and (B) total biomass (kg) for six study species by basal diameter (cm).
Belowground biomass by basal diameter when species are pooled (R2adj, 0.62, p < 0.0001). Total (below- and above-ground biomass) by basal diameter when species are pooled (R2adj, 0.72, p = 0.0001). Open circles represented modeled predicted values. Filled circles represent the residuals with darker circles being further from the predicted values than lighter, gray shaded circles. Gray line represents the linear model.
Fig 3
Fig 3. (A) Aboveground biomass (kg) versus total biomass (kg), (B) aboveground biomass (kg) versus belowground biomass (kg), and (C) belowground biomass versus total biomass of pooled species.
Open circles represented modeled predicted values. Filled circles represent the residuals with darker circles being further from the predicted values than lighter, gray shaded circles. Gray line represents the linear model.
Fig 4
Fig 4. Biomass fraction with tree components.
Biomass fraction of root, stem, branch, and leaf components of 6 study species.
Fig 5
Fig 5. Basal diameter (BD) by % belowground biomass (%BGB).
The relationship between BD and %BGB for all six study species based on beta regression and likelihood ratio test (pseudo R2adj = 0.06, χ2 = 2.6036, p < 0.0001). Open circles represented modeled predicted values. Filled circles represent the residuals with darker circles being further from the predicted values than lighter, gray shaded circles.
Fig 6
Fig 6. Crown radius (m) versus root system radius (m).
Crown radius (m) of 6 study species plotted against maximum rooting distance (m) of 6 study species. Significant relationship exists between crown radius and root system radius (R2 = 0.31 p < 0.0001). Open circles represented modeled predicted values. Filled circles represent the residuals with darker circles being further from the predicted values than lighter, gray shaded circles. Gray line represents the linear model.
Fig 7
Fig 7. (A) Maximum horizontal root distance (m) and (B) mean horizontal root distance (m) by basal diameter (cm) for all six species.
Letter denote significant differences among species. Axis letters signify the following: AE, A. excelsum, CO, C. odorata, DR, D. retusa, PQ, P. quinata, TR, T. rosea, TA, T. amazonia.
Fig 8
Fig 8. (A) Mean root depth and (B) maximum root depth by basal diameter of six study species.
Axis letters signify the following: AE, A. excelsum, CO, C. odorata, DR, D. retusa, PQ, P. quinata, TR, T. rosea, TA, T. amazonia.
Fig 9
Fig 9. (A) Convex area (m2) and (B) convex volume (m3) by basal diameter (cm) of six study species.
Axis letters signify the following: AE, A. excelsum, CO, C. odorata, DR, D. retusa, PQ, P. quinata, TR, T. rosea, TA, T. amazonia.
Fig 10
Fig 10. Main dry root weight to total dry root weight.
Boxplot parameters in the figure are as follows: the horizontal line within the box visualizes the median, boxes comprise data between the 1st and 3rd quartile of the data, whiskers reach to 1.5x interquartile range added to/subtracted from the 3rd/1st quartile. Axis letters signify the following: AE, A. excelsum, CO, C. odorata, DR, D. retusa, PQ, P. quinata, TR, T. rosea, TA, T. amazonia. Letters represent significant differences based on beta regression and likelihood ratio test.

References

    1. Nair PKR. An introduction to agroforestry. Springer Science & Business Media; 1993.
    1. Ibrahim M, Villanueva C, Casasola F. Sistemas silvopastoriles como una herramienta para el mejoramiento de la productividad y rehabilitación ecológica de paisajes ganaderos en Centro América. 2007;
    1. Murgueitio E, Calle Z, Uribe F, Calle A, Solorio B. Native trees and shrubs for the productive rehabilitation of tropical cattle ranching lands. For Ecol Manage. 2011;261(10):1654–63.
    1. Tucker NIJ, Murphy TM. The effects of ecological rehabilitation on vegetation recruitment: some observations from the Wet Tropics of North Queensland. For Ecol Manage. 1997;99(1):133–52.
    1. Rodrigues RR, Gandolfi S, Nave AG, Aronson J, Barreto TE, Vidal CY, et al. Large-scale ecological restoration of high-diversity tropical forests in SE Brazil. For Ecol Manage. 2011;261(10):1605–13.

LinkOut - more resources