. 2017 Oct;47(10):1584-1797.
doi: 10.1002/eji.201646632.

Guidelines for the use of flow cytometry and cell sorting in immunological studies

Andrea Cossarizza  1 Hyun-Dong Chang  2 Andreas Radbruch  2 Mübeccel Akdis  3 Immanuel Andrä  4 Francesco Annunziato  5 Petra Bacher  6 Vincenzo Barnaba  7   8 Luca Battistini  9 Wolfgang M Bauer  10 Sabine Baumgart  2 Burkhard Becher  11 Wolfgang Beisker  12 Claudia Berek  2 Alfonso Blanco  13 Giovanna Borsellino  9 Philip E Boulais  14   15 Ryan R Brinkman  16   17 Martin Büscher  18 Dirk H Busch  4   19   20 Timothy P Bushnell  21 Xuetao Cao  22   23   24 Andrea Cavani  25 Pratip K Chattopadhyay  26 Qingyu Cheng  27 Sue Chow  28 Mario Clerici  29 Anne Cooke  30 Antonio Cosma  31 Lorenzo Cosmi  32 Ana Cumano  33 Van Duc Dang  2 Derek Davies  34 Sara De Biasi  35 Genny Del Zotto  36 Silvia Della Bella  37   38 Paolo Dellabona  39 Günnur Deniz  40 Mark Dessing  41 Andreas Diefenbach  6 James Di Santo  42 Francesco Dieli  43 Andreas Dolf  44 Vera S Donnenberg  45 Thomas Dörner  46 Götz R A Ehrhardt  47 Elmar Endl  48 Pablo Engel  49 Britta Engelhardt  50 Charlotte Esser  51 Bart Everts  52 Anita Dreher  3 Christine S Falk  53   54 Todd A Fehniger  55 Andrew Filby  56 Simon Fillatreau  57   58   59 Marie Follo  60 Irmgard Förster  61 John Foster  62 Gemma A Foulds  63 Paul S Frenette  14   64 David Galbraith  65 Natalio Garbi  44   66 Maria Dolores García-Godoy  67 Jens Geginat  68 Kamran Ghoreschi  69 Lara Gibellini  35 Christoph Goettlinger  70 Carl S Goodyear  71 Andrea Gori  72 Jane Grogan  73 Mor Gross  74 Andreas Grützkau  2 Daryl Grummitt  62 Jonas Hahn  75 Quirin Hammer  2 Anja E Hauser  2   76 David L Haviland  77 David Hedley  28 Guadalupe Herrera  78 Martin Herrmann  75 Falk Hiepe  27 Tristan Holland  66 Pleun Hombrink  79 Jessica P Houston  80 Bimba F Hoyer  27 Bo Huang  81   82   83 Christopher A Hunter  84 Anna Iannone  85 Hans-Martin Jäck  86 Beatriz Jávega  87 Stipan Jonjic  88   89 Kerstin Juelke  2 Steffen Jung  74 Toralf Kaiser  2 Tomas Kalina  90 Baerbel Keller  91 Srijit Khan  47 Deborah Kienhöfer  75 Thomas Kroneis  92 Désirée Kunkel  93 Christian Kurts  44 Pia Kvistborg  94 Joanne Lannigan  95 Olivier Lantz  96   97   98 Anis Larbi  99   100   101   102 Salome LeibundGut-Landmann  103 Michael D Leipold  104 Megan K Levings  105 Virginia Litwin  106 Yanling Liu  47 Michael Lohoff  107 Giovanna Lombardi  108 Lilly Lopez  109 Amy Lovett-Racke  110 Erik Lubberts  111 Burkhard Ludewig  112 Enrico Lugli  113   114 Holden T Maecker  104 Glòria Martrus  115 Giuseppe Matarese  116 Christian Maueröder  75 Mairi McGrath  2 Iain McInnes  71 Henrik E Mei  2 Fritz Melchers  117 Susanne Melzer  118 Dirk Mielenz  119 Kingston Mills  120 David Mirrer  3 Jenny Mjösberg  121   122 Jonni Moore  123 Barry Moran  120 Alessandro Moretta  124   125 Lorenzo Moretta  126 Tim R Mosmann  127 Susann Müller  128 Werner Müller  129 Christian Münz  11 Gabriele Multhoff  130   131 Luis Enrique Munoz  75 Kenneth M Murphy  132   133 Toshinori Nakayama  134 Milena Nasi  35 Christine Neudörfl  53 John Nolan  135 Sussan Nourshargh  136 José-Enrique O'Connor  87 Wenjun Ouyang  137 Annette Oxenius  138 Raghav Palankar  139 Isabel Panse  140 Pärt Peterson  141 Christian Peth  18 Jordi Petriz  67 Daisy Philips  94 Winfried Pickl  142 Silvia Piconese  7   8 Marcello Pinti  143 A Graham Pockley  63   144 Malgorzata Justyna Podolska  75 Carlo Pucillo  145 Sally A Quataert  127 Timothy R D J Radstake  146 Bartek Rajwa  147 Jonathan A Rebhahn  127 Diether Recktenwald  148 Ester B M Remmerswaal  149 Katy Rezvani  150 Laura G Rico  67 J Paul Robinson  151 Chiara Romagnani  2 Anna Rubartelli  152 Beate Ruckert  3 Jürgen Ruland  153   154   155 Shimon Sakaguchi  156   157 Francisco Sala-de-Oyanguren  87 Yvonne Samstag  158 Sharon Sanderson  159 Birgit Sawitzki  160   161 Alexander Scheffold  2   6 Matthias Schiemann  4 Frank Schildberg  162 Esther Schimisky  163 Stephan A Schmid  164 Steffen Schmitt  165 Kilian Schober  4 Thomas Schüler  166 Axel Ronald Schulz  2 Ton Schumacher  94 Cristiano Scotta  108 T Vincent Shankey  167 Anat Shemer  74 Anna-Katharina Simon  140 Josef Spidlen  16 Alan M Stall  168 Regina Stark  79 Christina Stehle  2 Merle Stein  119 Tobit Steinmetz  119 Hannes Stockinger  169 Yousuke Takahama  170 Attila Tarnok  171   172 ZhiGang Tian  173   174 Gergely Toldi  175 Julia Tornack  117 Elisabetta Traggiai  176 Joe Trotter  168 Henning Ulrich  177 Marlous van der Braber  94 René A W van Lier  79 Marc Veldhoen  178 Salvador Vento-Asturias  66 Paulo Vieira  179 David Voehringer  180 Hans-Dieter Volk  181 Konrad von Volkmann  182 Ari Waisman  183 Rachael Walker  184 Michael D Ward  185 Klaus Warnatz  91 Sarah Warth  93 James V Watson  186 Carsten Watzl  187 Leonie Wegener  18 Annika Wiedemann  46 Jürgen Wienands  188 Gerald Willimsky  189 James Wing  156   157 Peter Wurst  44 Liping Yu  190 Alice Yue  191 Qianjun Zhang  192 Yi Zhao  193 Susanne Ziegler  115 Jakob Zimmermann  194
Affiliations

Guidelines for the use of flow cytometry and cell sorting in immunological studies

Andrea Cossarizza et al. Eur J Immunol. 2017 Oct.
No abstract available


Figures

Figure 1
Figure 1
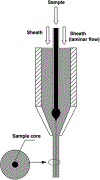
Sample core after hydrodynamic focussing by laminar sheath flow in a flow chamber.
Figure 2
Figure 2
Intensity profile of a focus spot of a gaussian laser beam. Note: if a cell is out of the center of the laser focus by 10 μm (20 μm sample core), laser intensity goes down about 5% with a 60 μm diameter laser focus.
Figure 3
Figure 3
Liquid stream of a jet in air sensing cell sorter. Depending of abort settings of the cell sorter, cells that are too close together are aborted from sorting. Reproduced with permission from .
Figure 4
Figure 4
Schematics of fluidics of a jet in air sensing cell sorter.
Figure 5
Figure 5
Typical electronic signal processing of a flow cytometer. The signal coming from a PMT or photo diode is amplified by a preamp and a main amp. The analogue signals are then digitized by an ADC board. A personal computer (PC) is used for further data processing and HV controlling.
Figure 6
Figure 6
Principle of a spectral flow cytometer. (A) Excitation light source (laser), (B) labeled cell, (C) dispersing element, (D] multichannel light detector (CCD or multichannel PMT).
Figure 7
Figure 7
Amnis® ImageStream assays on immune cells. Autophagy assay on human peripheral blood mononuclear cells (PBMCs) showing (A) LC3 puncta in CD8+ PBMCs. (B) Autolysosome formation by co-localisation of LC3 and LysoID from untreated cells (control), cells treated with an autophagy inducer (Rapamycin) or inhibitor (Chloroquin), is further quantified as percentage of cells with a bright detail similarity (BDS) of >1.5 or >2. BDS is a feature in IDEAS software that compares the bright detail image detail of two images to quantify co-localization. (C) Immune synapse detection between mouse CD90+ T cells and CD11b+ dendritic cells (DCs) cultured in vitro. An anti-mouse phalloidin-FITC antibody was used to detect synapse formation. (D) Phagocytosis of FITC-conjugated beads in human CD14+ macrophages. (E) Differentiation of mouse bone marrow Ly6G+ neutrophils. Cell were stained with a fixable live dead violet marker (L/D), anti-mouse Ly6G FITC antibody and DRAQ5 nuclear stain. Nuclear morphology, shown by DRAQ5 staining, indicates the neutrophil maturation state.
Figure 8
Figure 8
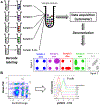
Schematic overview of a mass cytometric measurement.
Figure 9
Figure 9
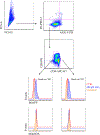
Typical gating strategy for PBMC analyzed by mass cytometry. Intact cells are identified by staining of DNA. Normalization beads elicit high signals in defined channels such as 140Ce in the present example. Cells (unless stained with 140Ce conjugated antibodies) do not elicit high 140Ce signals, and beads do not elicit high DNA/iridium signals. Events that appear in the upper right are cell-bead doublets, which could be either physical aggregates, or due to timely overlapping acquisition of two ion clouds with one cloud representing a cell, and the other one a bead event. Events not stained in either channel (lower left) are usually debris associated with metal amounts sufficient to be detected by the CyTOF instrument (first dotplot). Cell events are further restricted to events showing strongly correlating DNA signals according to their 193Ir and 191Ir staining. Both Ir isotopes almost equally contribute to the natural abundance iridium used in the DNA intercalator. Thus, signals are expected to correlate. Events with high iridium staining intensity are excluded since the DNAhigh fraction is enriched for cell doublets. This procedure does not fully eliminate doublets but reliably reduces their presence when barcoding was not used to filter out doublets. However, backgating should be used to confirm that target cells are not excluded in this step (second dotplot). Gating according to “cell length” or “event length” is often employed in order to minimize the presence of doublets. The “length” parameters corresponds to the number of spectra which belong to a given event. Events labeled with large amounts of metal (and doublets) tend to show higher, and those with little metal tend to show lower “length” values. Upper and lower cell length boundaries are defined in the acquisition software. The length parameter is not indicative of cell size. Again, backgating should be employed to ensure that target cells are not excluded (third dotplot). Next, dead cells are excluded by gating on 103Rhlow/– cell events. High 103Rh signals result from stronger labeling of dead cells by 103Rh-mDOTA compared to live cells. PBMC identity is confirmed by CD45 staining (in-house Pd104 conjugate, fourth dotplot), and CD36 and CD20 staining differentiate between monocytes/dendritic cells and B cells, respectively (in-house conjugates, fifth dotplot).
Figure 10
Figure 10
Check-list: parameters for selecting a sorting method. The parameters that affect cell sorting and therefore must be prioritized when choosing a sorting strategy are shown. Starting from the available material (amount, fragility), they range from the mundane cost aspect to practical and methodological concerns such as the available time, to the important experimental approaches regarding what yield, purity, or versatility is needed for down-stream applications. Optimization of one parameter may downgrade another parameter, e.g. a high purity may be at the expense of a high yield or speed, or unchanged functionality of the cells may not allow direct positive selection.
Figure 11
Figure 11
Improvement of population discrimination after pre-enrichment. Cytometer histograms of unwanted (gray lines) and wanted (solid green) populations. (A) A large excess of an unwanted population may create substantial overlap with the target population, making it impossible to achieve a good single-cell sort. (B) After a pre-enrichment bulk sort, which removes most of the unwanted population a good discrimination between the two populations can be achieved.
Figure 12
Figure 12
PBMC Sort. A PBMC sort on a BD FACSAria where by adding both FSC and SSC Height versus Width plots and carefully gating on singlets an additional 9% of likely doublets are removed (reproduced with permission from 113).
Figure 13
Figure 13
Staining pattern and gating strategy for a CD34+ enrichment. The cells are stained with CD34-Pe and CD45-APC. For analysis purposes only, PI was added for post analysis only.
Figure 14
Figure 14
Result of a sequential sorting process. 109 total cells have been processed sequentially in 5 hours to a final purity greater than 99%. Overall 280 000 target cells have been harvested from 800 000 target cells starting material, resulting in an overall yield of approximately 35%.
Figure 15
Figure 15
Spillover and compensation: (A) the emission spectra of PerCP-Cy5.5 and PE-Cy7. (B) Peripheral Blood Lymphocytes stained with PerCP-Cy5.5 CD4 mAb. The Median Fluorescence Intensity (MdFI) is shown for the PerCP-Cy5.5 and PE-Cy7 detectors without (left) and with (right) compensation.
Figure 16
Figure 16
Brightness of positive population.
Figure 17
Figure 17
Accuracy for SOV: The figure shows two different assays in which lysed whole blood was stained with the same fluorochromes: BD Horizon Brilliant Violet 510 (BV510) and BD Horizon Brilliant Violet 605 (BV605). Both assays used the same BV605 reagent. In the top panels the BV510 positive population was dim will in the bottom panels the BV510 positive population is very bright. For each assay the SOVs were determined and the correct spillover was applied (Middle panels). For the left panels the BV510→BV605 SOV was increased by 1% (over-compensated) and compensation applied. For the right panels the BV510→BV605 SOV was decreased by 2% (under-compensated) and compensation applied.
Figure 18
Figure 18
Examples for performance tracking with and without a CS&T module . (A) A Levey-Jennings chart of a weekly measured performance for one parameter (out of 10) is shown. The cross in red indicates a failure in the performance check (a higher PMT-Voltage is needed to reach the target values of the beads, which corresponds to a loss of sensitivity). After checking and changing the band-pass filter in front of the corresponding PMT, the performance is measured again and is compared to the previous situation (blue dots). With the correct band-pass filter installed, the performance of the PMT is back to the previous level. The graph is taken from a CS&T-Cytometer Performance Report of a BD FACSCanto II equipped with 3 lasers. (B) The histogram of channel A of the violet 405 nm laser shows the corresponding measurement to the situation described above in (a) and is taken from a self-defined, instrument-specific calibration worksheet. The blue population represents the “standard” setup (with a 510/50 band-pass filter in front of the PMT of channel A, where the beads are reaching the respective target values (brackets). The red curve shows a measurement with a 610/20 nm band-pass filter instead. The beads are clearly outside the target values and the positive and negative populations are barely separated from each other. This is an example, how one can easily track basic instrument performance without having a separate software module available.
Figure 19
Figure 19
How one can detect suboptimal alignment of lasers? Both histograms display a negative and positive bead population in the 450/50 channel of the UV-Laser of a BD FACSAria SORP cell sorter. Although the positive peak in (A) still falls into the defined target area (brackets = P2), the shape and %CV of the peak suggest a suboptimal alignment of the UV-Laser. After realignment the shape of the positive peak become narrower with only the half of the %CV. (B) Laser-alignment is optimal, when the lowest %CV values are reached.
Figure 20
Figure 20
Titration of a CD4 mAb (clone GK1.5) conjugated to FITC and titrated on murine splenocytes. The antibody was titrated in 1:2 dilution steps starting from a 1:100 dilution (5.4 μg/mL) up to 1:12 800 (0.04 μg/mL). (A) Histograms of the stained samples are shown. (B) MFI of the positive and negative populations (left axis) and signal-to-noise ratio between the positive and negative populations (right axis) are plotted. Best separating titer for this particular antibody was determined to be 0.7 μg/mL (1:800 dilution).
Figure 21
Figure 21
Schemata of density gradient centrifugation with Ficoll® as pre-enrichment. The distribution of different cell types such as mononuclear cells, granulocytes and erythrocytes after the separation through the Ficoll® density gradient is shown.
Figure 22
Figure 22
Cells from different sources and with different sizes can be concentrated in a centrifuge containing an elutriation chamber. Without centrifugal force, the cells would just pass through (A). If you apply a centrifugal force cells of a particular size and density will start concentrating in the chamber. The equilibrium formed inside the chamber depends on the speed of the cellular flow, the amount of applied centrifugal force and the viscosity of the medium used (B). This is the reason why elutriation is compatible with a wide range of cell types and carrier media.
Figure 23
Figure 23
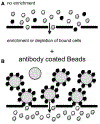
Unlabelled cells will pass the mesh without any (enrichment) effect (A). If you add beads which are coated with specific antibodies against your target cells (black) to the cell suspension, the target cells will form aggregates with the beads. These aggregates are held back on the top of the mesh while the rest of the cell suspension is passes through (B). With this method one can either deplete or enrich for a specific cell population. Combining different mesh and bead sizes allows for a serial enrichment of target cells.
Figure 24
Figure 24
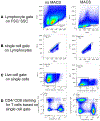
Examples for MACS®-enriched cell populations. Pooled mouse lymphocytes from the spleen and lymph nodes were positively enriched with CD25 MACS® microbeads to isolate regulatory T cells (Tregs: CD4+CD25+FoxP3+). After the MACS®-enrichment cells were stained for flow cytometry cell sorting and analysed on a flow cytometer. Compared to the non-enriched sample (upper panel), the target population of regulatory T cells is significantly increased in the MACS® pre-enriched sample (lower panel) and can now be sorted on a flow cytometric cell sorter with higher sort efficiency (higher yield) in a shorter period of time. The gating strategy is shown in Fig. 25 (A). Human peripheral blood lymphocytes were enriched for B cells with CD19 MACS® microbeads. After the enrichment, the lymphocytes were stained with antibodies against CD45 and CD19 and analysed in a flow cytometer. In the MACS®-enriched sample, the B cell population is already highly enriched (purity > 95%). For many downstream applications (e.g. functional assays), this purity might already be high enough (B). (Data kindly provided by Dr. Michael Delacher, DKFZ).
Figure 25
Figure 25
Lymphocytes from spleen and lymph nodes were pooled and stained for regulatory T-cell identification (CD3, CD4, CD8, CD25 and FoxP3). One part of the sample was measured before (left column), the second part of the sample was analysed after a positive MACS® enrichment for CD25 (right column). The first gate was set on FSC/SSC to include the lymphocyte population (A). Based on the lymphocyte gate doublet exclusion on FSC-H vs FSC-A was done (B). From the single cells the dead cells were excluded (C). T cells were divided by gating on CD4 or CD8 (D). Out of the CD4+-subpopulation the regulatory T cells (CD25+FoxP3+) were sorted (Fig. 24A).
Figure 26
Figure 26
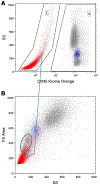
Human whole blood fixed with formaldehyde and permeabilized with TX-100. White blood cell populations were identified using CD14-PE-Cy7 and CD45-Krome Orange. Debris (red) is identified using CD45 vs SS (top panel - region C). Identification of peripheral blood monocytes (shown in blue in both panels) was accomplished using CD-14-PE-Cy7 (not shown).
Figure 27
Figure 27
Impact of methanol concentration on P-STAT5 immunoreactivity in peripheral blood monocytes activated in vitro using GM-CSF. Whole blood from a normal donor was treated with GM-CSF for up to 20 min in vitro at 37°C. One part of the fixed and permeabilized samples was treated with 50% methanol (A) and the other with 80% methanol (B) at 4°C. After washing, all samples were stained with (__) P-STAT5, (__) P-ERK, and (_Δ_) P-S6.
Figure 28
Figure 28
Effect of methanol treatment on CD14 staining of human peripheral blood monocytes. Whole blood samples from one individual were stained with CD-14-PE-Cy7 before (left panels) or after (right panels) fixation and permeabilization. Samples were treated with either 50% (top panels) or 80% (lower panels) methanol. See text for details.
Figure 29
Figure 29
Effect of formaldehyde concentration on P-STAT5 immunoreactivity in K562 cells (from [165], used with permission). Cells were fixed at 37°C for 10 minutes using increasing final concentrations of formaldehyde, permeabilized and stained with anti-P-STAT5-PE as described.
Figure 30
Figure 30
Workflow of cell sample barcoding for flow and mass cytometry. (A) Schematic overview; (B) example of flow cytometric barcoding for a PhosphoFlow experiment. PBMC were stimulated in vitro with eight different stimuli or controls, fixed and permeabilized, and cells from each condition were barcoded using Alexa Fluor® 750 and/or PacificOrange succinimidyl esters. Following the barcoding reaction, single samples were washed and pooled and further stained for major lymphocyte lineage antigens such as for the detection of B cells, and for pSTAT1 expression, as a pooled sample. After selecting B cells by gating (not shown), the barcode is deconvoluted by gating in the two dimensions used for barcode labeling. The left plot depicts the barcode labeling of all cells in that pool. Eight major populations corresponding to different stimulation conditions can be discriminated (indicated by gating). Cells of a given single sample group together as a “population” with homogeneous Alexa Fluor® 750 and PacificOrange labeling, respectively. Annotations indicate stimulation conditions applied prior to barcoding, as well as the frequencies of gated populations. The similarity of these frequency values confirms that the pool contains similar amounts of cells from each barcoded condition. On the right side, the histogram overlay representation depicts pSTAT1 expression in the different stimulation conditions. pSTAT1 signal was induced in B cells treated with IFN-α and IFN-γ, but not or only minimally in the other conditions, which are visually indifferent in pSTAT1 signal from the “unstimulated” control. Data were generated by Patty Lovelace, HIMC, Stanford.
Figure 31
Figure 31
Barcoding schemes. (A–C) Schematic two-dimensional dot plot representations of (A) two samples, each barcoded by a unique single marker, (B) 12 samples barcoded by gradually increasing label signals (6 levels each) in 2 channels, or (C) 8 samples using a combinatorial barcoding scheme based on 3 intensity levels per channel. Colored circles/ellipses indicate different barcode-labelled samples, different colors indicate distinct cytometric signaling, color saturation depicts staining intensity. The open circle represents unstained cells, which can formally be assumed as a “label” itself, but tends strongly to accumulate insufficiently labelled cells of other samples and debris, and is therefore recommended not be to used for barcoding. (D) Pascal’s triangle can be used as a tool for the construction of barcoding schemes. The line numbering indicates the number of barcode channels, and the ordering of numbers in each line reflects the number of labels per sample, not counting the “1.” Different scenarios are indicated by the numbers highlighted. Four samples labelled by one marker each consumes four barcoding channels (red), dual barcode marker labelling in 6 channels (blue) can be used to barcode and pool 15 unique samples, and, in theory, 210 samples could be barcoded by quadruple combinations in 10 cytometric channels (green). Blue numbers denote sums of each line that equal the capacity of unrestricted combinatorial barcoding schemes consuming the indicated number of barcoding channels.
Figure 32
Figure 32
Spreading error and loss of detection sensitivity. (A) APC (here conjugated to an anti-human CD8 antibody) spread into the Alexa 700 channel (left empty). Red lines indicate the threshold of positivity in the Alexa 700 channel according to APC fluorescence. (B) A given marker detected in the Alexa 700 channel is bright enough to allow 100% detection even if co-expressed with APC (dark grey). (C) A given marker detected in the Alexa 700 channel is not bright enough to be separated from the APC spread (green lines indicate the portion of cells that are “covered”). In this case, only 50% of the cells are detected as positive (dark grey). In both cases, Alexa700+APC cells (light grey) are not affected. Figure modified from Lugli et al., Methods Mol Biol. 2017;1514:31–47 with permission.
Figure 33
Figure 33
Structural characteristics of immunoglobulins. Ribbon diagram of a mouse monoclonal IgG antibody consisting of two identical heavy and light chain proteins, respectively. Antibody heavy chain residues are indicated in blue and light chain residues in green. Amino acid residues encoding the CDR1, 2 and 3 regions are shown in red. (Image was generated using the Swiss PDB viewer and PDB accession number 1IGT).
Figure 34
Figure 34
Structural characteristics of VLR antibodies. (A) Ribbon diagram of the antigen-binding units of a monoclonal VLR antibody. Parallel β-sheets lining the concave antigen-binding surface are shown in blue and a variable loop structure involved in antigen binding is depicted in red. The invariant stalk region necessary for multimerization of the secreted VLR antibody was omitted (Model was generated using the Protein Model Portal Algorithm 210). (B) Structural characteristics of VLR antibodies. Individual VLRB units consist of a signal peptide (SP), N-terminal LRR (LRR-NT), LRR-1, up to nine variable LRRv units, a connecting peptide, C-terminal capping LRR (LRR-CT) and the invariable stalk region and can be modified by inclusion of engineered 6 × His and HA-epitope tags or Fc-fusion sequences.
Figure 35
Figure 35
The threshold value defines a signal intensity, in one or more parameters, above which the cytometer starts to recognize an event. All other events will be invisible to the instrument’s electronics. A particle passing the laser beam emits a certain amount of light over time. The threshold is set on the height of the signal that is emitted by each particle. On the left-hand side a dotplot with the forward scatter as the trigger parameter is shown. Only particles with a signal higher than this threshold value are recognized by the software as an event and shown in the dotplot (black and orange dots). The dots in on the left side of the threshold value (grey and blue dots) are not included in the data file.
Figure 36
Figure 36
An example of a gating stategy for rare cells. Gating stategy used to identify circulating endothelial cells (CECs) and their precursors (EPCs) among peripheral blood leukocytes. (A) Debris and aggregates were eliminated using FSC-Area versus FSC-Height, (B) possible clogs were removed using the parameter Time versus SSC. (C) a DUMP channel was used to remove CD45+ cells and dead cells from the analysis. (D) nucleated cells were identified based on Syto16 positivity. (E) Stem cells were identified according to CD34 positivity, (F) EPCs (CD133+,CD31+) and CECs (CD133, CD31+) were identified. The expression of CD276, also named B7-H3 (G, I)., and CD309 (H,J), also named VEGFR-2 or KDR, was evaluated in each subpopulation. In this example, more than ten million events were initially acquired in order to enumerate a population that, according to the literature, is always represented less than 0.1%.
Figure 37
Figure 37
Quality control analysis to detect batch effects. Eight sequential blood samples each from six subjects were analyzed by flow cytometry, clustered using the SWIFT algorithm, and Pearson correlation coefficients in the number of cells per cluster were calculated between all pairs of subjects. Samples were analyzed on two days, and on two identically configured LSR-II cytometers.
Figure 38
Figure 38
Model data illustrating the very different interpretations of two samples with similar proportions of cells in a positive gate. Left: A double-negative (AB) population with a random normal distribution is modeled. Middle: Two small sub-populations with random normal distributions are added to the AB sub-population. The red and green sub-populations contain few cells, but are well separated from the AB population. Right: The “negative” sub-population has been shifted slightly, but no distinct smaller sub-populations are present.
Figure 39
Figure 39
Typical automated analysis workflows in flow cytometry. Analysis usually starts with several pre-processing steps, including quality assessment data normalization and data transformation (blue boxes). Pre-processing is followed by identifying cell populations of interest (orange boxes) and visualization (green box).
Figure 40
Figure 40
Measurements of central tendencies for cytometric intensity histograms. The curve is an ideal distribution, showing key measurements. Cytometric intensity histograms span a finite intensity range with a noisy curve and frequently with off-scale events at the lower and/or upper end(s) of the scale. Generally the median is the most robust measure, because the mean is heavily influenced by off-scale events and the mode by noise.
Figure 41
Figure 41
The histogram representation of fluorescence from a weak staining of a small (rare) population. The upper histogram shows an unstained control. A small shoulder from the staining of the rare population is visible in the lower histogram. Reproduced with permission from .
Figure 42
Figure 42
Cumulative frequencies from the two histograms in Fig. 41 and difference. Details on the calculation of X¯1, X¯2, and Dm are described in the text. Reproduced with permission from .
Figure 43
Figure 43
Result of the histogram analysis. The two original histograms and the calculated stained population are shown with population means. Reproduced with permission from .
Figure 44
Figure 44
Uni-, bi- and multi-parameter presentation of flow data. Comparison of two gender- and age-matched patients: a healthy one (67 years) and a patient with B-CLL (64 years) from . (A) 1D-histogram presentation of CD3 expression on lymphocytes (red: B-CLL, grey: healthy), (B) 2D-dot-plot presentation of CD3 expression on x-axis vs. CD16/56 expression on y-axis, (C) multivariate presentation of expression of 12 different antibodies on 9 colors (OMIP-023, exclusion of low CD25 expression) for 9 different leukocyte subsets in a radar-plot. Abbreviations used: B-CLL (B-cell chronic lymphocytic leukemia), Th (CD4+ T-helper cell), Tc (CD8+ cytotoxic T cell), NK (natural killer cell).
Figure 45
Figure 45
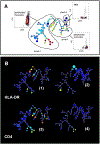
Semi-automated analysis of flow cytometric data by SPADE. Spanning-tree progression analysis of density-normalized data (SPADE) is a technique described in . (A) Identification of nodes based on scatter characteristics and CD45 expression. (B) Comparison of expression of HLA-DR and CD4 on blood cells for two male patients: (1,3) a healthy one (67 years) and (2,4) a patient with B-CLL (64 years). Color codes correlate with expression level from low (blue) to high (red) and size of the nodes correlate with cell frequencies. For SPADE tree construction by pre-gating doublets were discriminated and removed, 500 000 events were downsampled to 20 000, target node number was 100 and cluster markers were scatter channels (FSC, SSC) and fluorescence channels (FL1–10).
Figure 46
Figure 46
An example of intracellular cytokine detection. Shown are viable, single, CD3+CD4+ C57BL/6 WT Th cells from the inflamed colon of T-cell transfer-induced colitis. (A) Cells were restimulated for 4 h with PMA/iono (and Brefeldin A added after 1 h) in RPMI, IMDM, or CaCl2-supplemented RPMI and stained for intracellular cytokine expression. (B) Frequency of IL-17+ cells among colonic Th cells restimulated with PMA/iono at the indicated densities for n = 7 mice. (C) Frequency of IL-17+ cells among colonic Th cells restimulated with PMA/iono for the indicated amount of time for n = 4 mice per group. *p < 0.05, **p < 0.01, and ***p < 0.001 by one-way ANOVA for repeated measurements and Tukey’s post hoc test. Data reproduced from with permission. Reproduced with permission from .
Figure 47
Figure 47
An example of intranuclear transcription factor detection. (A–D) Shown are viable, single, CD3+CD4+ C57BL/6 WT Th cells from the inflamed colon or the spleen of T cell transfer-induced colitis. (A) Transcription factor expression can depend on activation state of the cell: Interferon regulatory factor 4 (Irf4) and T-box expressed in T cells (T-bet) were stained directly ex vivo (grey shaded) or after 4h restimulation with PMA/iono (black line). (B) Fixation time can positively or negatively influence staining quality of transcription factors: Eomesodermin (Eomes) and Retinoic acid receptor-related orphan receptor gamma t (ROR-γt) were stained after 1 h or after overnight (o/n) fixation with the eBioscience Foxp3/transcription factor staining buffer set. (C–F) Transcription factor staining can be combined with cytokine staining or fluorescent reporter genes. (C and D) ROR-γt, T-bet, Interferon gamma (IFN-γ), and Interleukin 17 (IL-17) were stained simultaneously with the eBioscience Foxp3 staining buffer set. (D) Black indicates the full staining and grey the fluorescence minus one (FMO) control for the T-bet antibody (ab). (E and F) Depicted are viable, single, CD45+B220CD11bF4/80Gr-1CD90+, TCRβ+, TCRγδ cells from the small intestine of C57BL/6 RorcGFP/+ reporter mice. (E) IL-22 was stained after 4 h of restimulation with PMA/iono and 5 μg/mL IL-23 with the Miltenyi Biotec inside stain kit. (F) ROR-γt stained directly ex vivo with the Miltenyi inside stain kit is depicted for ROR-γtGFP (grey shaded) and ROR-γtGFP+ cells (black line).
Figure 48
Figure 48
This is an example of how a traditional flow cytometry assay might be designed using test tubes or even a 96-well plate assay. Because of the limitation in the number of tubes or samples that can be run by traditional instruments, it is not possible to create very large arrays. Using high throughput cytometry, typical assays might be 384-well plates that can be processed in 10–20 minutes and produce a huge amount of data which can be processed using advanced statistical operations.
Figure 49
Figure 49
Combinatorial cytometry integrates the ideas of screening biological responses. Biological responses can be screened across multiple conditions (e.g. concentration, medium type, stress, temperature, time, etc.) with flow cytometry. The technique is enabled by fast autosamplers, and informatics pathways aware of the multifactorial nature of the collected data.
Figure 50
Figure 50
Automated processing of bead-based cytokine assay. Results obtained in a cytometric bead assay in graphical representation of the cytokine concentration in every well of the multi-well plate. Samples were run on an Attune NxT flow cytometer (ThermoFisher) using the instrument plate reader. On the left side of the figure is a list of the analytes used in the assay. In the center part of the figure is a 96-well plate layout showing a representation of each cytokine in a 13-piece pie chart. The colors represent the values in picograms/mL. The top right figure shows the bead populations used to define each cytokine. On the bottom left, the heat map describes the fluorescence intensity measurements for each well and each cytokine. The figure on the bottom right shows the standard curve derived from the standards run for this assay.
Figure 51
Figure 51
Response curves automatically produced from data extracted from multiple FCS files. Data across FCS files are collected using a robotic sampler connected to a flow cytometer. The PlateAnalyzer software recognizes the plate layout and creates response curves on the basis of pre-defined gates. Each curve results in an automatically calculated IC50 value as shown on the right side of the figure.
Figure 52
Figure 52
The pipeline design canvas of the PlateAnalyzer. This particular example of an analysis package (http://vault.cyto.purdue.edu) allows rapid development of data-processing maps for complex combinatorial cytometry experiments. In contrast to traditional FC software packages, all the operations are by definition applied to vectors or matrices of FCS files, rather than to individual datasets. On the left of the figure are shown histograms of each of the phosphorylated proteins in the assay, the central group identifies the phenotype of cells being evaluated, and the two boxes on the far right show the stimulating molecules (12 rows) each of which contains 8 concentrations. Yellow lines show the active analysis connection pathway—i.e. the resulting dose response curves would be based on the phenotypic result of each component linked within this pathway. As an example in the figure, the phosphorylation state is ZAP70- and the phenotype is NK cells (CD3, CD7+).
Figure 53
Figure 53
An example of a combinatorial staircase giving 28 unique dual color codes to 28 different peptides.
Figure 54
Figure 54
Dot plots showing an antigen specific T-cell population detected in T cells isolated from a tumor lesion. The antigen specific T cells are positioned in the diagonal of the upper right corner of the plot (green circle) as they are dual positive for two fluorochromes.
Figure 55
Figure 55
Principle of MHC multimer staining by increasing the binding avidity of MHC-TCR interactions. (A) Conventional MHC tetramers (B) MHC modification for generation of reversible MHC Streptamers; (C) principle of reversibility of MHC Streptamers.
Figure 56
Figure 56
MHC multimer staining of human PBMCs for CMV peptide pp65 with BV421 and APC. Pregating CD8+ and CD3+ improved separation. Additional staining with pp65 APC MHC multimer separates a distinct population of antigen specific cytotoxic T cells.
Figure 57
Figure 57
Principle of antigen-specific stimulation assays. Peripheral blood mononuclear cells (PBMC) or single-cell suspensions from tissues are incubated with the antigen of interest or without antigen as negative control to determine background levels of the assay. If whole proteins are used for stimulation, the antigen has to be taken up by the autologous antigen-presenting cells of the cell source, processed and presented on MHC molecules. Peptides of a certain length can bind externally to MHC molecules. The antigen-specific T cells will start to secrete cytokines and/ or cytotoxic molecules (5–12 hours), express activation markers (5–16 hours) and at later time points start to proliferate (3–5 days). For all these different functions of T cells, such as cytokine release, cytotoxicity, expression of activation markers and proliferation single-cell flow-cytometric assays are available and for most technologies also selection markers on the cell surface are available allowing additional isolation of the specific cells.
Figure 58
Figure 58
Enrichment of antigen-specific T cells increases sensitivity for the detection of rare cells. (A) CD154 and TNF-α expression was analyzed on CD4+ T cells without addition of an antigen and following stimulation wit the neo-antigen keyhole limpet hemocyanin (KLH). Cells are gated on CD4+ T cells and percentage and absolute numbers of CD154+ cells after acquiring 5 × 10⁵ PBMCs (upper plots) or obtained from 1 × 10⁸ PBMCs after enrichment of CD154+ cells (lower plots). (B) Phenotypic characterization of the enriched CD154+CD4+ T cells to discriminated between CD45RO+ memory cells and CD45RO-CCR7+ naive T cells, following stimulation with a peptide pool of C. albicans MP65 as recall antigen or KLH as neoantigen. (C) Parallel detection of antigen-specific Tcons (CD154+) and Tregs (CD137+) following stimulation with birch pollen lysate and magnetic enrichment for CD154+ and CD137+ cells from 2 × 10⁷ stimulated PBMC. Upper plots: cells are gated on CD4+ T cells and absolute cell counts of CD154+ and CD137+ cells with and without stimulation are indicated. Lower plots: Overlayed flow-cytometric analysis of birch-specific CD154+ and CD137+ cells. Numbers indicate percentages among CD137+CD154-CD4+ T cells and absolute numbers of CD137+CD25+FOXP3+ Tregs. (D) To describe the precision of flow cytometry data, the coefficient of variance (CV) can be calculated from the variance and the SD. For rare cell analysis, the approximations SD = √r and CV [%] = 100/√r can be used, where r is the number of positive events . From CV [%] = 100/√r follows r = [100/CV]2. Using this approximation the number of total required events is illustrated depending on the frequency of target cells for different CVs.
Figure 59
Figure 59
Representative DNA fluorescence histogram of PI-stained cells. Isolated cells are fixed and stained as described above, and their fluorescence determined on a linear fluorescence scale. The presence of a sub-G1 peak can be used to indicate the presence of cells undergoing apoptosis (programmed cell death), see also Section VII.8.4.
Figure 60
Figure 60
Identification of single-cell populations for analysis using flow cytometry. Cultured tumor cells were harvested, washed and stained as described in . (A) Tumor cells are identified on a forward scatter (FSc) versus side scatter (SSc) plot and gated to exclude debris which is found in the lower left corner. (B) Single cells can be separated from cell aggregates by analyzing cell height and area (upper right)—single cells will show as a correlated line, with any clumped cells below. (C) Viable cell populations can be identified using viability stains such as the LIVE/DEAD® fixable range of products from Life Technologies, the eFluorۚ fixable dyes from eBioscience, BioLegend’s Zombie range of fixable dyes, Tonbo biosciences’ Ghost Dyes and the Fixation and Dead Cell Discrimination Kit from Miltenyi Biotec, as described in Section VII.8.2. Reproduced with permission from .
Figure 61
Figure 61
Schematic representation of fluorescent dot plot for the flow cytometric analysis of cell proliferation on the basis of BrDU incorporation. Human peripheral blood mononuclear cells have been labelled with BrdU and a phenotypic marker, with unlabeled cells acting as the control. The total viable cell population was used for the analysis.
Figure 62
Figure 62
Schematic fluorescence histogram depicting a progressive decline in the fluorescent intensity of proliferating cells stained with CFSE. For the assays, 106 isolated cells (e.g. human peripheral blood mononuclear cells) are incubated with CFSE (~5 mM final concentration) at room temperature for 8 min, at which time the reaction is blocked by the addition of fetal bovine serum (FBS, 2% v/v final concentration). Cells are washed in phosphate buffered saline containing 2% v/v FBS, after which they are stimulated. The fluorescence of the stimulated cells is then measured at appropriate time-points using flow cytometry. (A) The bright/strong, undiluted fluorescent signal of non-proliferating / arrested cells. (B) The (serially) diluted fluorescence intensity of cell populations from successive generations of proliferated cells.
Figure 63
Figure 63
Identifying healthy and apoptotic cells on the basis of Annexin V staining. The human prostate cancer cell line LNCap was seeded into 6 well plates and allowed to adhere overnight. The following day, cells were left untreated (A) or incubated for 6 h with 4 μg/mL human recombinant granzyme B , (B). After the incubation period, cells were harvested and processed as described above, with 105 cells being stained with Alexa-Fluor® 647 Annexin V (following the manufacturer’s instructions) and propidium iodide (final concentration 1μg/mL). Cells were analyzed on a Beckman Coulter Gallios flow cytometer. Plotting Annexin V binding on the x-axis of a two-dimensional dot/density plot and PI/7-AAD on the y-axis enables the identification of healthy (Annexin VnegativePI/7-AADnegative, bottom left quadrant), apoptotic (Annexin VpositivePI/7-AADnegative, bottom right quadrant) and late apoptotic / dead (Annexin VpositivePI/7-AADpositive, top right quadrant) cells. The cells incubated in the presence of granzyme B showed induction of apoptosis and increased cell death.
Figure 64
Figure 64
Identifying healthy and apoptotic cells on the basis of activated caspase-3 expression. The human breast cancer cell line MDA-MB-231 was seeded into 6-well plates and allowed to adhere overnight. The next day, cells were left untreated or incubated for 24 hours with the topoisomerase I inhibitor camptothecin (4 μg/mL, induces apoptosis). After the incubation period, cells were harvested and stained using the FITC active caspase-3 apoptosis kit (BD Biosciences) following the manufacturer’s instructions and analyzed on a BD Biosciences LSRII flow cytometer. Cells were identified using FSc and SSc measurements (A) and the expression of active caspase-3 determined on the basis of FITC fluorescence (B; control sample shown on open histogram and camptothecin treated shown on grey histogram). The cells incubated in the presence of camptothecin showed activation of caspase-3.
Figure 65
Figure 65
TMRM and JC-1 staining of CD4+ T cells. The K+ ionophore valinomycin depolarizes mitochondria of CD4+ T cells, as revealed by the decrease in TMRM fluorescence, and by the decreased fluorescence of JC-1 aggregates and increased fluorescence of JC-1 monomers. Untreated cells (CTRL) are shown in left panels. For TMRM, unstained sample is also shown in right panel. Dot plot combining untreated sample and valinomycin-treated sample is also reported (lower right panel).
Figure 66
Figure 66
MitoTracker Green staining of different subsets of CD8+ T cells. Different CD8+ T-cell subsets, i.e., central memory (CM), naïve (N), effector memory (EM), and terminally differentiated effector memory (EMRA) were identified according to the expression of CD45RA and CD197. Among them, the use of MitoTracker Green (MT Green) allows to determine mt mass, which is clearly different among cell subsets.
Figure 67
Figure 67
MitoSOX Mitochondrial Red superoxide indicator and Mitochondria Peroxy Yellow-1 staining of different subsets of CD8+ T cells. Doublets were excluded from the analysis of peripheral blood mononuclear cells by using FCS-A and FSC-H (upper left panel); viable cells were selected according to negativity for annexin-V (ANX-V) Pacific Blue conjugate and TO-PRO-3 iodide (upper right panel). Then, CD4+ or CD8+ T lymphocytes were selected on the basis of positivity for a CD4APC-H7 mAb or a CD8-PO mAb respectively. Among these, fluorescence intensity of MitoSOX Mitochondrial Red Superoxide Indicator (MitoSOX) and Mitochondria Peroxy Yellow-1 (mitoPY) was analyzed.
Figure 68
Figure 68
Representative examples of strategies to differentiate between attached and internalized fluorescent bacteria in whole-blood phagocytosis assays by conventional flow cytometry (A–C) and imaging flow cytometry (D–F). In both assays, whole-blood samples anticoagulated with heparin were stained with CD45-APC (A) or CD45-PE (D) antibody and incubated for 30 min at 37°C (B) or at 4°C (C) with a suspension of Escherichia coli (ATCC 11775) transformed by electroporation with a plasmid containing the GFP gene (pMEK91 GFP). The ratio bacteria/leukocytes was 1:4. Then, samples were lysed with BD FACS Lysing Solution, put on ice and analysed immediately in a BD Accuri C6 conventional flow cytometer (A–C) or in an Amnis ImageStream 100 multispectral imaging flow cytometer (D-F), both using a 488 nm blue laser. Graphs B and C show the intensity of GFP fluorescence emission in granulocytes distinguished by higher granularity (SSC) and lower CD45 expression (purple-colored events in graph A) after incubation of whole blood with GFP-expressing E. coli at 37°C (graph B) or at 4°C (graph C). Comparison of B and C shows the difference between granulocytes with adherent and/or internalized bacteria (74.5% of the population after incubation at 37°C) and granulocytes with only adherent bacteria (3.8% of the population after incubation at 4°C). Graph D shows the features of the main leukocyte populations identified on an imaging flow cytometer by their light scatter under darkfield illumination (intensity_ SSC) and the expression CD45 (Intensity_CD45-PE). Composite graphs E and F shows the intracellular localization of GFP bacteria in single cells of the granulocyte subpopulation (gate on NEUTRO, graph D) after incubation of whole blood with GFP-expressing E. coli at 37°C. Merged images (BF/GFP) from the brightfield illumination channel (BF) and the green fluorescence channel (GFP) allow distinguishing cells with external bacteria (graph E) from cells with internalized bacteria (graph F). Numbers on the BF image in E and F composites indicate the sequential number of the event in the sample run.
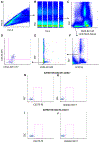
Figure 69
Figure 69
Autophagy pathway showing key modulators used in detection of autophagy. A double-membraned elongation vesicle is formed, which elongates to form an autophagsome. During elongation (left), a cytosolic protein LC3-I is lipidated to LC3-II and inserts into the membrane of the growing autophagosome. The autophagosome circularizes, engulfing the material to be degraded (middle). The autophagosome then fuses with a lysosome to breakdown the autophagy vesicle and its contents (right).
Figure 70
Figure 70
Autophagy induction and flux measured with the FlowCellect LC3 kit. Human PBMCS were treated for 24 hours with Bafilomycin A1 (BafA) present for the last two hours. Cells were treated with LPS and gated on CD14+ cells for monocytes, CD3/CD28 beads with CD3+ gating for T cells and IgM and MegaCD40L with CD19+ gating for B cells. After all treatments cells were stained with the appropriate antibody for detection of the cell population of interest and for LC3-II using the FlowCellect LC3 kit. This involves staining cells with an anti-LC3 FITC conjugated antibody that is selectively washed out to only detect membrane bound LC3-II. Data is shown as histograms of LC3-II FITC expression after compensation and gating on the population of interest.
Figure 71
Figure 71
Quantification of ex vivo cytotoxicity by influenza-specific CTLs. (A) Seven days after pulmonary infection with influenza A/WSN/33, untouched flu-specific CTLs in unfractionated bronchoalveolar lavage (Effectors, E) were incubated in vitro with a titrated number of target cells (T). Targets consisted of an equal mixture of spleen cells loaded with an MHC-I-binding influenza peptide (flu) or an irrelevant MHC-I ligand (control). Flu peptide-loaded spleen cells were labeled with a higher concentration of Cell Proliferation Dye eFluor 670 than their control counterparts. Five hours later, the relative frequency of the remaining target cells was quantified by flow cytometry. The exact frequency of flu-specific CTLs can be determined in parallel by staining with the corresponding MHC-I multimer. (B) Quantification of technical duplicates shown in (A). The % of flu-specific kill was calculated as: 100 – [100 × (Tflu / Tcontrol)with E / (Tflu / Tcontrol)without E].
Figure 72
Figure 72
Quantification of in vivo cytotoxicity by influenza-specific CTLs. Seven days after pulmonary infection with influenza A/WSN/33, infected and naive mice received targets cells intravenously. Targets consisted of an equal mixture of spleen cells loaded with an MHC-I-binding influenza peptide (flu) or an irrelevant MHC-I ligand (control). Flu peptide-loaded spleen cells were labeled with a higher concentration of Cell Proliferation Dye eFluor 670 than their control counterparts. Four hours later, target cells in lung-draining mediastinal LNs and non-draining inguinal (distal) LNs were quantified by flow cytometry.
Figure 73
Figure 73
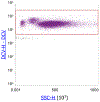
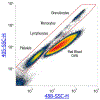
Identification of leukocytes in human whole blood using violet laser and Vybrant DyeCycle Violet stain on the Attune NxT Flow Cytometer. Leukocytes are outnumbered by red blood cells ~700-fold in whole blood and generally require enrichment by red blood cell lysis or gradient centrifugation prior to analysis. This strategy exploits the use of Vybrant® DyeCycle Violet stain (DCV), a low cytotoxicity permeable DNA-specific dye that can be used for DNA content cell cycle analysis and stem cell side population by flow cytometry. DCV threshold levels were set empirically to eliminate from detection the large amounts of red blood cells that are found in unlysed whole blood. A proper threshold is shown in a SSC-Height versus DCV-Height dotplot. DCV can be excited with violet lasers and can be used for simultaneous staining with antibodies. This protocol is ideally suited to study the numbers of nucleated cells in unlysed whole blood. Using a gate in this figure as the parent gate, the three main leukocyte cell populations in human blood are identified using classic forward and side scatter plots.
Figure 74
Figure 74
Identification of leukocytes in human whole blood using violet side scatter on the flow cytometer. Resolution of leukocytes from red blood cells in whole blood is improved by incorporating violet 405 nm side scatter. Using both violet and blue side scatter allows identification of leukocytes in whole blood. Using a gate in this figure as the parent gate the three main leukocyte cell populations in human blood can be identified using classic forward and side scatter plots.
Figure 75
Figure 75
Use of the Attune NxT No-Wash No-Lyse Filter Kit. The standard configuration for the 405 nm violet laser optical filter block is shown in (A) and the same optical filter block using the No-Wash No-Lyse Filter Kit shown in (B), with changes outlined in red. To use the filter kit, remove the 440/50 bandpass filter in VL1 slot 1 and place the 405/10 bandpass filter that is placed in the VL1 slot 1in slot 1. Remove the 495 Dichroic Longpass (DLP) filter in a lot A the 415DLP. The Blank filter in slot 1A is switched with the 417LP filter in slot 0.
Figure 76
Figure 76
Reactive oxygen species production. Representative experiment of resting and activated leukocytes in unlysed whole blood. Cells were stained with Vybrant DyeCycle Violet stain to discriminate nucleated cells fro erythrocytes (Excitation/Emission (nm): 405/437), in combination with dihydrorhodamine 123 (Excitation/Emission (nm): 488/530) PE-CD33 (Excitation/Emission (nm): 561/578), APC-CD11b (Excitation/Emission (nm): 637/660), and 7-ADD (Excitation/Emission (nm): 488/647). Cells were stimulated with PMA dissolved with DMSO and incubated in presence of DHR for 30 min at 37°C. Subsequently, cells were stained with DCV and PE-CD33 and APC-CD11b antibodies for 20 min at room temperature. Following incubation, blood was diluted in HBSS and immediately acquired for flow cytometry measurements.
Figure 77
Figure 77
Measuring intracellular Ca2+ mobilization in human B cells in response to anti-IgM stimulation after labeling with Indo-1 AM by flow cytometry. (A) The shift in Indo-1 bound to Indo-1 unbound at low intracellular Ca2+ concentrations (grey) and high intracellular Ca2+ concentrations (black). Ca2+ increase was induced in Indo-1 labeled PBMCs by addition of ionomycin. (B) The influence of temperature on Ca2+ baseline levels is demonstrated by gating on CD19+ B cells (black) and CD19- non-B cells (grey) after warming to 37°C prior to the measurement and cooling off during the recording over 10 minutes. In B cells the Indo-1 bound/unbound is progressively decreasing with the reduction of temperature. (C) Setting of Indo-1 AM bound versus Indo-1 AM unbound on x-axis and y-axis respectively. The photomultiplier (PMTs) should be adjusted so that unstimulated cells occur on a line about 45° to the y-axis. (D) Gating strategy for the analysis of Ca2+ mobilization in naïve, IgM Memory and switched memory B cells after stimulation with anti-IgM. PBMCs were labeled with Indo-1 AM and cell surface staining with CD27, CD19, IgG and IgA After gating on living Indo-1 bound cells, lymphocytes were determined. Gating of CD19+ B cells is followed by differentiation of IgG/IgA-/CD27- naïve (na) B cells, IgG/IgA-/CD27+ IgM Memory B cells (M Mem) and IgG/IgA+/CD27+ class switched B cells (sw). Time versus the ratio of Indo-1 bound/unbound is shown for the three subpopulations (lower panels). After baseline acquisition anti-IgM (arrow) was added inducing a shift of Indo-1 AM bound/unbound in IgM-expressing naïve and IgM Memory B cells whereas this ratio is at baseline levels in IgM- class switched memory B cells. After addition of ionomycin the ratio of Indo-1 AM bound/unbound is rapidly increasing in all subsets. Data were acquired with a BD LSR Fortessa and analyzed by FlowJo.
Figure 78
Figure 78
PrimeFlow RNA Assay procedure. Steps 1–3 reproduced with permission from Thermo Fisher Scientific © 2016.
Figure 79
Figure 79
Typical sequential gating analysis performed on samples of cycling cells stained for DNA content and intra-nuclear histone modifications. Asynchronously proliferating Jurkat cells were harvested, processed and stained exactly as outlined in Section VII.15.3: Example generic protocol for intranuclear antigen – pH3. 1. A bi-variate plot showing FSC-A (X axis) versus SSC-A (Y axis) with a polygonal gate set to include “intact cells” and exclude debris (low FSC-A/SSC-A). 2. A bi-variate plot showing the area of the DNA signal (PI) on the X axis versus the height of the same parameter on the Y axis. A gate has been set to include single events and exclude events that are likely doublets based on a breakdown in the linear relationship between area versus height. 3. A second step of doublet exclusion using the width of the SSC signal pulse (Y axis) versus the FSC-A signal (X axis). 4. A plot of PI DNA area signal (X axis) versus the area signal for the phospho-serine H3 residue 28 modification as revealed by an AF488 tagged monoclonal antibody (Y axis). Data is shown for cells that have been left untreated (left panel) and cells treated for 16 hours with 0.1 μM Nocodazole as a positive biological control for staining. Unt, Untreated; Noc, Nocodazole.
Figure 80
Figure 80
FoxP3 staining to detect T-regulatory cells (example gating). Human PBMCs were stained following standard protocols followed by fixation and permeabilization as per the protocol (above). There are several ways of identifying T-regulatory cells. In this example, the following gating strategy was applied to identify CD4+ T-regulatory cells: 1. Flow stability gating (Time vs Side Scatter)—to ensure the instrument had good stable flow over the run of the sample. 2. Doublet gating (Forward Scatter height vs area)—removal of doublets based on pulse geometry gating. 3. Scatter gating (Forward vs Side Scatter)—to remove debris and events off-scale. 4. Dump and Viability—removal of dead cells and non-T cells.5. CD3 (T-cell) gate—gating to identify the CD3+ subset. 6. T-cell subsetting (CD4 vs CD8) — further subsetting of the CD3+ cells to identify CD4+. 7. T-reg gating (CD25 vs FoxP3)—identification of T-regulatory cells Clones used FoxP3 PCH101, CD25 M-A3251. The final gate was set based on the FMO controls. As shown, the event file started with 507 471 events, and the percentage of cells in each gate are identified on each plot, resulting in approximately 3 000 cells in the final gate.
Figure 81
Figure 81
“Canonical” pathways for LPS activation of multiple signaling pathways in peripheral blood monocytes via TLR-4 (adapted from Guha and Mackman and reproduced with permission). Inhibition of PI3K (right) by Ly294002 or GDC-0941) or of MEK 1/2 (left) by U0126 is also illustrated here. Also shown, in monocytes, activation of the ribosomal S6 protein is predominantly through activated ERK.
Figure 82
Figure 82
LPS activation of the ERK pathway in human peripheral blood monocytes. Samples were pre-incubated with the indicated inhibitors for 60 min at 37°C before the addition of LPS to all samples. After 4 min incubation with LPS, all samples were fixed using formaldehyde and permeabilized using Triton X-100 (see Section IV.6: Cell fixation and permeabilization for flow cytometric analyses, for details on fixation and permeabilization steps). Only monocyte responses are shown here, based on CD45 and CD14 gating (not shown here).
Figure 83
Figure 83
Simultaneous measurement of four different signaling targets. Human peripheral blood was incubated with LPS for 10 minutes at 37°C. Here, each of the measured phospho-epitopes is shown versus side scatter, with the CD-14pos monocytes in red.
Figure 84
Figure 84
Kinetics of LPS activation of the AKT and ERK pathways in peripheral blood monocytes. Whole blood samples were pre-treated with the PI3K inhibitor GDC-0941 (right panel), or vehicle controls (left panel), followed by activation with LPS for 0 to 15 minutes at 37°C. P-AKT (orange, lower line in both panels) and P-ERK (red, upper line in both panels). Note that in the GDC-0941 treated sample (right), the P-ERK peak seen in the untreated sample is missing (arrow, right panel).
Figure 85
Figure 85
Analysis of the sensitivity of mtmP toward CCCP in real time. Splenic B cells of a C57Bl/6 mouse were left unstained or stained with TMRE (tetramethylrhodamine). Live cells were analyzed by flow cytometry for ~40 seconds, then medium or carbonyl cyanide 3-chloro phenyl hydrazine (CCCP; 100 μM) were added and cells were analyzed for another ~120 seconds. For comparison, TMRE-stained and CCCP-treated apoptotic/necrotic cells are shown in the lower panel. Apoptotic/necrotic cells reveal a lower and irregular TMRE fluorescence and are not responsive to CCCP treatment anymore, indicating a collapse of mtmP. MFI, mean fluorescence intensity. Data were acquired with a BD FACS Calibur and analyzed by FlowJo software.
Figure 86
Figure 86
Testing the specificity of DCFDA. Splenocytes of a C57Bl/6 mouse were stained with DCFDA (2′,7′-dichlorodihydrofluorescein diacetate). 0.01% ammonium peroxodisulfate (APS) or 0.01% APS together with 0.5 mM vitamin C were added or cells were left untreated. Viable cells (lymphocyte gate, left) were analyzed in a BD Gallios flow cytometer. Data were analyzed with Kaluza software.
Figure 87
Figure 87
Gating of CD4+ and CD8+ T cells in peripheral blood. Lymphocytes are identified on based of the forward (FSC) and side (SSC) scatter. Single cells are discriminated from doublets by plotting the pulse width and height against each other for both the SSC and FSC. CD3+ T cells are gated and excluded from apoptotic cells by viability dye. Including dead cells can result in large errors because of their property to bind nonspecifically to antibody conjugates. Although not applied here, in the same channel other cell types may be excluded by using a DUMP channel, meaning a channel that contains all cellular markers in one color that should be excluded e.g. antibodies against CD14 (monocytes), CD19 and CD21 (B cells). Peripheral blood ratios of CD4+ and CD8+ T cells vary from donor to donor. A normal CD4:CD8 ratio is between 1 and 2. Low frequencies of double negative CD3+CD4CD8 cells are common and contain populations of NKT cells.
Figure 88
Figure 88
A four-dimensional model to address T-cell differentiation stages. At least seven stages of T-cell differentiation can be distinguished for peripheral blood derived CD8+ T cells by using the markers; CD45RA, CD27, CD28 and CCR7.
Figure 89
Figure 89
Adhesion, chemokine and cytokine receptor expression identify up to eight functional subsets within the human CD4+ memory pool. Peripheral blood derived CD4+ T cells can be divided between naïve, cytotoxic and 8 different T-helper subsets based on the surface expression of (A) CCR4, CCR6, CXCR3, CXCR5, CX3CR1, CD28 and CD161 and (B) production of IFN-γ, IL-4, IL-10, IL-17, IL-21 and IL-22. For detection cells were stimulated with Ionomycin and PMA in the presence of BFA and MN.
Figure 90
Figure 90
Effector CD8+ T-cell differentiation during acute infection using KLRG1 and CD127. In humans four different effector populations can be identified during acute infection based on the expression of KLRG1, CD127, CD45RA, and CD27.
Figure 91
Figure 91
T-cell subsets as identified by intracellular cytokine and transcription factor staining. Peripheral blood derived CD3+ T cells are divided between CTL and TH cells. (A) CTL can be identified by the mutual expression of GZMB and Perforin. (B) CTL but also TH1 cells can be identified in the CD8 and CD4 lineage by the expression of T-bet and further divided by the expression of Eomes. (C) Hobit expression strongly correlates with T-bet expression in CD8+ T cells. (D) Treg cells can be identified among the CD25 positive CD4+ T cells by the expression of FoxP3 and Helios.
Figure 92
Figure 92
Detection of cytokine production and degranulation after stimulation of T cells. Peripheral blood T cells were stimulated for 4 hours with Ionomycin and PMA or medium control in the presence of BFA and MN. (A) Stimulated CD8+ and CD4+ T cells were stained for expression of IFN-γ and IL-2. (B) TNF-α production was captured in combination with degranulation of stimulated CD8+ T cells as detected by capture of CD107.
Figure 93
Figure 93
Gating on CD4 and CD8 T cells. Lymphocytes are identified based on their forward (FSC) and side (SSC) scatter. Single cells are discriminated from doublets by plotting the pulse width and height against each other for the FSC. In order to exclude non-specific binding of antibodies by dead cells, non-viable cells are excluded using a viability dye and live CD3+ stained cells are gated on. The majority of CD3+ T cells should either be CD4 or CD8 single positive, however, depending on the organ analysed, there may be either double positive or double negative cells.
Figure 94
Figure 94
Discriminating naive, effector and memory T cells. Naive T cells can be distinguished from activated and memory T cells based on their low expression of CD44 and high expression of CD62L. In this example, live CD8+CD3+ T cells have been gated on and antigen specific T cells can be further distinguished from endogenous T cells using tetramer staining. The majority of CD8 T cells during the effector phase of an immune response typically upregulate CD44 and downregulate CD62L. In the memory phase of an immune response, T cells retain high expression of CD44 and can be either CD62L positive or negative.
Figure 95
Figure 95
Using transcription factors or chemokine receptors to identify CD4 subsets. Subsets of CD4 T cells can be identified based on their expression of master transcription factors. Surface markers such as CD4, CD3 and viability dyes are typically stained on the surface before washing, fixing and permeabilizing the cells to allow the transcription factor antibodies to bind in the nucleus. Th1 cells are identified by expression of T-bet, Th17 cells by RORgt, Treg cells by FoxP3 and Tfh cells by Bcl6 expression. Chemokine receptor staining can also be used to distinguish CD4 Th subsets. Examples shown include Th1 cells which express the chemokine receptor CXCR3 and Tfh cells which express CXCR5.
Figure 96
Figure 96
Effector molecules produced by T cells. T-cell subsets produce cytokines according to the subset to which they have been polarized toward. To analyze production of cytokines in vitro, cells are restimulated with either antigen or with PMA and ionomycin, together with brefeldin A. Th1 cells produce IFN-γ, Th2 cells produce IL-4 and Th17 cells produce IL-17. Antigen specific CD8 T cells at the effector and memory phase after infection can also be identified based on their cytokine expression, in these examples, IFN-γ, TNF-α, IL-2 and CD107a are used.
Figure 97
Figure 97
Gating strategy for the identification of B cells. (A) Lymphocytes are identified by their scatter properties. (B) Exclusion of doublets. (C) Cells positive for markers in the “dump” channel, and DAPI stained dead cells are excluded. (D) B cells are identified by their expression of CD19 and CD20 including CD20low plasmablasts. (E) B-cell subsets are discriminated by CD27 and CD20: naive B cells are CD27 CD20+; memory B cells CD27+ CD20+ and plasmablasts CD27++ and CD20low.
Figure 98
Figure 98
B-cell subsets. (A) Further B-cell subsets can be discriminated by the expression of IgD together with CD27. IgD+ CD27 cells are the naive B cells (Q3). The CD27-expressing subsets are different types of memory B cells: the IgD+ CD27+ cells are non-switched memory B cells (Q2) and the IgD CD27+ cells are switched memory B cells (Q1). The double-negative (IgD CD27 B cells is heterogeneous and also contains memory B cells. (B) CD95 expression in B cells of a healthy donor. Quadrant Q6 shows activated CD27+ CD95+ memory B cells and Q7 activated CD27 CD95+ naive B cells.
Figure 99
Figure 99
Flow cytometric analysis of murine ASC derived from spleen and bone marrow. (A) ASCs were detected by surface staining of CD138 and intracellular staining of kappa. ASCs were further characterized by surface expression of MHC class II and intranuclear BrdU, which was incorporated into the DNA of proliferating cells after administration via the drinking water. Non-proliferating BrdU low ASCs express less MHC class II, which characterizes long-lived plasma cells while proliferating BrdU high and MHC class II high cells indicate newly generated plasmablasts (PBs). The intracellular staining of IgG and IgM allows the differentiation of ASC with regard to the antibody isotype that they generate. The cells were derived from a NZB/W F1 mouse that represents a model of lupus. (B) Identification of ASCs in an antigen-specific manner in Balb/c mice three days after a booster immunization with ovalbumin (OVA). Anti-OVA ASCs were enumerated by intracellular staining with OVA conjugated with FITC. Almost all splenic anti-OVA are BrdU positive proliferating plasmablasts (PBs) three days after secondary immunization with OVA. The majority of bone marrow ASCs including those with intracellular OVA staining do not express BrdU characterizing them as long-lived plasma cells.
Figure 100
Figure 100
Flow cytometric analysis of circulating peripheral blood ASC derived from an active SLE patient. PBMCs were gated for CD19+ cells excluding CD3+/CD14+/CD16+ cells. ASCs highly express CD27 and are negative for CD20. The majority of ASCs express HLA-DR, which characterizes newly generated plasmablasts. PBMCs: peripheral blood mononuclear cells, mB: memory B cells, nB: naive B cells.
Figure 101
Figure 101
Identification of murine circulating splenic NK cells. Representative gating strategy to identify circulating NK cells from the spleen of 6-week-old C57BL/6 mice. NK cells were gated as viable (LD) B220 CD3 NK1.1+ DX5+. Among NK1.1+ DX5+ NK cells expression of CD27 and CD11b defines different stages of NK cell maturation. Expression profile of the key transcription factors Eomes and T-bet in splenic NK1.1+ DX5+ NK cells is shown on the right.
Figure 102
Figure 102
Identification of human circulating PB-NK cells. Representative gating strategy to identify human CD3 CD56bright, CD56dim CD57, and CD56dim CD57+ NK cell populations after pre-gating on viable CD14 CD19 human PBMCs. Expression profile of the key transcription factors Eomes and T-bet in these NK cell subsets is shown on the right.
Figure 103
Figure 103
Identification of murine SI LmP ILCs. Representative gating strategy of ILCs derived from the small intestinal (SI) lamina propria LmP of 6-week-old C57BL/6 mice. Mononuclear cells (MCs) were prepared as previously described . Cells were gated as viable (LD), B220 CD11c Gr-1 F4/80 FcεR1α (Lin) CD45+ TCRβ TCRγδ and either as NKp46+ (grey gate, A) T-bet+ Eomes ILC1, Eomes+ T-bet+ NK cells or as CD127+ (black gate, B) GATA3+ RORγt ILC2 and RORγt+ GATA3lo ILC3 which can be further separated according to NKp46 and CD4 expression (B).
Figure 104
Figure 104
Identification of human tonsil ILCs. Representative gating strategy (upper panel) and expression of transcription factors (lower panel) of human ILCs derived from tonsillectomy. After magnetic depletion of CD3+ cells, cells were gated as viable (LD), CD3 CD14 CD19 FcεRIα CD123 CD11c CD141 (Lin) and either CD94+/lo CD127−/lo CD56+ NK cells; CD94 CD127hi CD117+ CRTH2 ILC3; CD94 CD127hi CD117+/lo CRTH2+ ILC2; or CD94 CD127hi CD117 CRTH2 NKp44 CD56 ILC1.
Figure 105
Figure 105
NK cells can be first gated on the basis of their surface level of CD56 expression and lack of CD3. The CD56bright NK subpopulation is positive for NKG2A, negative for KIRs while CD16 can be either negative or dimly expressed (as shown). NKG2A and KIR surface expression allows three subpopulations of CD56dim NK cells, namely “maturing” (NKG2A+KIR), “double positive” (NKG2A+KIR+) and “mature” (NKG2AKIR+), to be identified. Among the mature population, CD57 molecule is expressed on the, so-called, “terminally differentiated” NK cells. In CMV positive donors, a percentage of this latter population can also express NKG2C representing the so called “memory NK cells.” Recently it has been demonstrated that in CMV positive individuals a fraction of the NKG2C subset can also express PD1.
Figure 106
Figure 106
Schematic illustrating the tripartite organization of the mononuclear phagocyte system. Classical tissue macrophages are established before birth and with few exceptions, self-maintain throughout adulthood. Classical DCs are short-lived and continuously replaced from dedicated BM-derived precursor cells. Monocytes reside in the blood circulation and are recruited to tissues on demand where they give rise to cells with macrophage or DC features (for further details see 843).
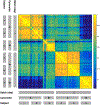
Figure 107
Figure 107
Flow cytometric analysis of murine myeloid blood cells. Neutrophils are defined by high sideward scatter (not shown) and expression of Ly6G. Monocytes are defined as CD115hi cells and can be further subdivided into classical (Ly6Chi; red) and patrolling monocytes (Ly6Clo; blue) (for further details see 850).
Figure 108
Figure 108
Flow cytometric analysis of colonic mononuclear phagocytes. Classical DCs are defined as CD11chi cells (red), which can be further subdivided into three subsets according to their CD103 and CD11b expression. Monocyte-derived intestinal macrophages are defined as CD64+ CD11c low-int CD11b+ cells (blue) (for further details see 850).
Figure 109
Figure 109
Flow cytometric analysis of splenic DCs. Classical CD11chi MHCII+ DCs can be further subdivided into two main subsets according to CD11b and XCR1 expression (for further details, see 850).
Figure 110
Figure 110
Flow cytometric analysis of CNS macrophages. Neutrophils are excluded according to their Ly6G expression. Microglia are defined as CD45int CD11b+ cells (red). Monocytes (blue) and monocyte-derived macrophages (green) are defined as CD45hi CD11b+ Ly6C+ and Ly6C cells, respectively.
Figure 111
Figure 111
Discrimination of granulocyte subpopulations. Human or murine whole blood was subjected to hypotonic water lysis to remove erythrocytes prior to antibody staining. Cells were incubated with antibodies for 30 min at 4°C (human) or on ice (murine) in the dark. Stained cells were acquired using a Beckman Coulter Gallios Flow Cytometer and analyzed by Beckman Coulter Kaluza® Flow Analysis Software 1.3. (A) Human cells are displayed in a SSC versus FSC dot plot to show the location of eosinophils (green, high SSC), neutrophils (blue, high SSC), and basophils (red, low SSC). (B) Human cells were stained with antibodies against CD45, CD11b, CD15, CD16, CCR3, Siglec-8 and FcεRIα. CD45+/CD11b+ cells were gated on CD15 versus CD16 to distinguish granulocyte subpopulations. CD15+/CD16+ cells were determined as neutrophils, CD15+CD16 were further designated as eosinophils by their expression of Siglec-8 and CCR3, and the CD15/CD16 population was depicted in a FcεRIα versus CCR3 plot to identify the double positive basophil fraction. (C) CD45+ murine cells were gated on CD11b/Ly6C to display the CD11b+/Ly6int population which was further analyzed using Ly6G to identify neutrophils (blue). CD11b+/LyCneg-low cells were gated on Siglec-F versus CD200R3 and were subsequently analyzed for expression of additional cell subset markers. CD200R3 cells expressing Siglec-F and CCR3 were designated as eosinophils (green) and Siglec-F cells were marked as basophils (red) supported by their expression of CD200R3 and CD49b.
Figure 112
Figure 112
Apoptosis detection and uptake of nanoparticles in purified human granulocytes. Human granulocytes were purified by density gradient centrifugation with Lymphoflot. Erythrocyte contaminations were depleted by hypotonic water lysis. Human granulocytes were resuspended in RPMI-1640 supplemented with 50 U/mL penicillin/streptomycin, 2 mM glutamine and 10% heat-inactivated fetal calf serum and 25 mM HEPES at a concentration of 2 × 10⁶ cells/mL. (A) Granulocytes were cultivated at 37°C/CO2 for indicated time points and stained according to the protocol included in this article. Subsequently, they were subjected to analysis on a Beckman Coulter CytoFLEX Flow Cytometer. Evaluation of data was performed with the Beckman Coulter software CytExpert 1.2. During apoptosis, granulocytes shrink and increase in granularity, as indicated by a decrease in FSC and an increase in SSC. Viable cells (V) first start to expose AxA5-FITC and become apoptotic (A), before they lose their plasma membrane integrity and become necrotic as indicated by PI-positivity (N). Note that in the N-gate the population high in PI reflects cells without the loss of nuclear content. In contrast, the population low in PI reflects cells with a subG1 DNA content, which is considered a hallmark of apoptosis. (B) 20 μg/ml micro monosodium urate crystals and 250 μg/mL Lucifer Yellow were added to the granulocytes and the suspension was incubated at 37°C/CO2 for the time points indicated. Subsequently, analysis was performed on a Beckman Coulter Gallios flow cytometer. Evaluation of data was performed with the Beckman Coulter Kaluza® Flow Analysis Software 1.3. The increase in Lucifer Yellow (see arrow; in red) is restricted to the population of cells which increase in granularity. Therefore, the simultaneous increase in Lucifer Yellow and SSC can be used to monitor the uptake of nanoparticles by granulocytes.
Figure 113
Figure 113
Gating strategy for bone marrow stromal cells. Live single cells are separated using CD45, Ter119 and CD31 markers. Cells were then gated for TNCs (CD45 Ter119 CD31) and MSPCs were analyzed using CD51 and PDGFRα (CD45 Ter119 CD31 PDGFRα+ CD51+).
Figure 114
Figure 114
Phenotypic characterization of mouse HSCs in BM in vivo. (A) LT-pHSCs were identified as Linc-Kit+Sca-1+Thy1.1loFlk2CD34CD201highCD150+CD48 cells . (B) Alternatively, LT-pHSCs that are endowed with Hoechst dye efflux properties were identified as side population (SP) cells and further purified as Linc-Kit+Sca-1+ cells.
Figure 115
Figure 115
Phenotypic characterization of human pHSCs in the peripheral blood in vivo. LT-pHSCs were identified as LinCD34+CD38CD90+ cells, and MPPs as LinCD34+CD38+CD90 cells .

References

    1. Mack J, Fulwyler Particle Separator. US patent US 3380584 A.
    1. Kachel V, Fellner-Feldegg H and Menke E, Hydrodynamic properties of flow cytometry instruments. In Melamed MR, Lindmo T and Mendelsohn ML (Eds.), Flow cytometry and sorting, 2nd ed., Wiley, New York, 1990, pp. 27– 44. ISBN 0-471-56235-1.
    1. Crosland-Taylor PJ, A device for counting small particles suspended in a fluid through a tube. Nature 1953. 171: 37– 38. - PubMed
    1. Gucker FT Jr., O’Konski CT, Pickard HB and Pitts JN Jr., A photoelectronic counter for colloidal particles. J. Am. Chem. Soc 1947. 69: 2422– 2431. - PubMed
    1. Van den Engh GJ, Flow cytometer droplet formation system. US patent US 6861265 B1.

Publication types