. 2018 Feb;17(1):e12675.
doi: 10.1111/acel.12675. Epub 2017 Oct 12.

Human CD8+ EMRA T cells display a senescence-associated secretory phenotype regulated by p38 MAPK

Affiliations

Human CD8+ EMRA T cells display a senescence-associated secretory phenotype regulated by p38 MAPK

Lauren A Callender et al. Aging Cell. 2018 Feb.

Abstract

Cellular senescence is accompanied by a senescence-associated secretory phenotype (SASP). We show here that primary human senescent CD8+ T cells also display a SASP comprising chemokines, cytokines and extracellular matrix remodelling proteases that are unique to this subset and contribute to age-associated inflammation. We found the CD8+ CD45RA+ CD27- EMRA subset to be the most heterogeneous, with a population aligning with the naïve T cells and another with a closer association to the effector memory subset. However, despite the differing processes that give rise to these senescent CD8+ T cells once generated, they both adopt a unique secretory profile with no commonality to any other subset, aligning more closely with senescence than quiescence. Furthermore, we also show that the SASP observed in senescent CD8+ T cells is governed by p38 MAPK signalling.

Keywords: SASP; T cell; aging; cytokine; inflammation; microarray.


Figures

Figure 1
Figure 1
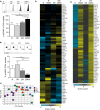
CD8+ EMRA T cells display a unique secretory phenotype. (A) Shown are the secreted factors which were significantly increased (< 0.05) in the CD8+ EMRA T‐cell subset. For each protein, the relative gene expression is displayed as the average value of six donors. Signals above baseline are yellow; signals below baseline are blue. The heat map key shows log‐fold changes from baseline. (B) Pie chart showing the relative percentage of secreted factors split into key functions. (C) Representative flow cytometry plots and cumulative data of IL‐18 and CCL16 on CD8+ CD45RA/CD27‐defined T‐cell subsets following an 18‐hour stimulation with 0.5 μg mL−1 anti‐CD3. Graphs show the mean ± SEM for four donors. (D) Graph showing the production of ADAM28 by the four CD8+ T‐cell subsets following an 18‐hour stimulation with 0.5 μg mL−1 anti‐CD3 and 5 ng mL−1 IL‐2. Graph shows the mean ± SEM for three donors. (E) Heat map showing the relative gene expression of chemokine receptors that were significantly upregulated (< 0.05) by the CD8+ EMRA T‐cell subset. (F) Flow cytometry plot and graph showing the expression of CX3CR1 on the four CD45RA/CD27‐defined CD8+ T‐cell subsets. Graph shows the mean ± SEM for four donors. P‐values were calculated using a repeated‐measures ANOVA with the Tukey correction used for post hoc testing.
Figure 2
Figure 2
Regulation of the secretory phenotype seen in CD8+ EMRA T cells. (A) Representative flow cytometry plots of phosphorylated p53. Graph depicts the expression of p‐p53 in CD8+ CD45RA/CD27‐defined T‐cell subsets. Graph shows the mean ± SEM for nine donors. (B) Flow cytometry plots and graph showing the expression of phosphorylated AMPK in CD8+ T‐cell subsets following an 18‐hour stimulation with 0.5 μg mL−1 anti‐CD3. Graph shows the mean ± SEM for 10 donors. P‐values were calculated using a repeated‐measures ANOVA with the Tukey correction used for post hoc testing. (C) PCA of CD8+ CD45RA/CD27‐defined T‐cell subsets. (D) Heat map showing the relative gene expression of senescence genes for the N and EM CD45RA/CD27‐defined subsets (six donors) compared to the naïve‐like and EM‐like EMRA subsets (three donors each). (E) Relative gene expression changes for genes controlling the secreted SASP factors in N and EM CD45RA/CD27‐defined subsets compared to the naïve‐like and EM‐like EMRA subsets. The heat map keys show log‐fold changes from baseline.
Figure 3
Figure 3
Characterization of the senescent profile of CD8+ CD45RA + CCR7 CD28/CD27 T cells. (A) Representative flow cytometry plots showing phenotypic staining using CD45RA/CCR7 and the different CD28/CD27 staining pattern observed in CD45RA/CCR7‐defined EMRA cells from two donors. (B) Flow cytometry plots and graphs depicting p‐p53 expression in ex vivo CD8+ CD45RA/CD27‐defined (left axis) and CD45RA + CCR7 CD28/CD27‐defined subsets (right axis). (C) Plots and graph showing the expression of phosphorylated AMPK in CD8+ T‐cell subsets following an 18‐h stimulation with 0.5 μg mL−1 anti‐CD3 in the above subsets. Graphs show the mean ± SEM for nine donors. P‐values were calculated using a paired t‐test or a repeated‐measures ANOVA with the Tukey correction used for post hoc testing.
Figure 4
Figure 4
The secretory phenotype of CD8+ EMRA T cells is regulated in a p38 MAPK‐dependent manner. (A) Heat map showing the changes in the secreted factors produced by CD8+ EMRA T cells following inhibition of the p38 MAPK pathway using BIRB796. For each protein, the relative gene expression is displayed as the average value of six donors. Signals above baseline are yellow; signals below baseline are blue. The heat map key shows log‐fold changes from baseline. (B) Flow cytometry plots and cumulative data of IL‐18 and CCL16 in CD8+ EMRA T‐cell subset following an 18‐hour stimulation with or with our BIRB796. Graphs show the mean ± SEM for four donors. (C) Graph showing the production of ADAM28 from stimulated CD8+ EMRAs following blockade of the p38 MAPK pathway using BIRB796. Graph shows the mean ± SEM for three donors. P‐values were calculated a repeated‐measures ANOVA with the Tukey correction used for post hoc testing.

References

    1. Akbar AN, Henson SM (2011) Are senescence and exhaustion intertwined or unrelated processes that compromise immunity? Nat. Rev. Immunol. 11, 289–295. - PubMed
    1. Akbar AN, Henson SM, Lanna A (2016) Senescence of T lymphocytes: implications for enhancing human immunity. Trends Immunol. 37, 866–876. - PubMed
    1. Aoshiba K, Tsuji T, Kameyama S, Itoh M, Semba S, Yamaguchi K, Nakamura H (2013) Senescence‐associated secretory phenotype in a mouse model of bleomycin‐induced lung injury. Exp. Toxicol. Pathol. 65, 1053–1062. - PubMed
    1. Bridges LC, Tani PH, Hanson KR, Roberts CM, Judkins MB, Bowditch RD (2002) The lymphocyte metalloprotease MDC‐L (ADAM 28) is a ligand for the integrin α4β1. J. Biol. Chem. 277, 3784–3792. - PubMed
    1. Campisi J (2005) Senescent cells, tumor suppression, and organismal aging: good citizens, bad neighbors. Cell 120, 513–522. - PubMed

Publication types

Substances