. 2017 Oct 11;96(2):387-401.e6.
doi: 10.1016/j.neuron.2017.09.044.

Loss of CLOCK Results in Dysfunction of Brain Circuits Underlying Focal Epilepsy

Affiliations

Loss of CLOCK Results in Dysfunction of Brain Circuits Underlying Focal Epilepsy

Peijun Li et al. Neuron. .

Abstract

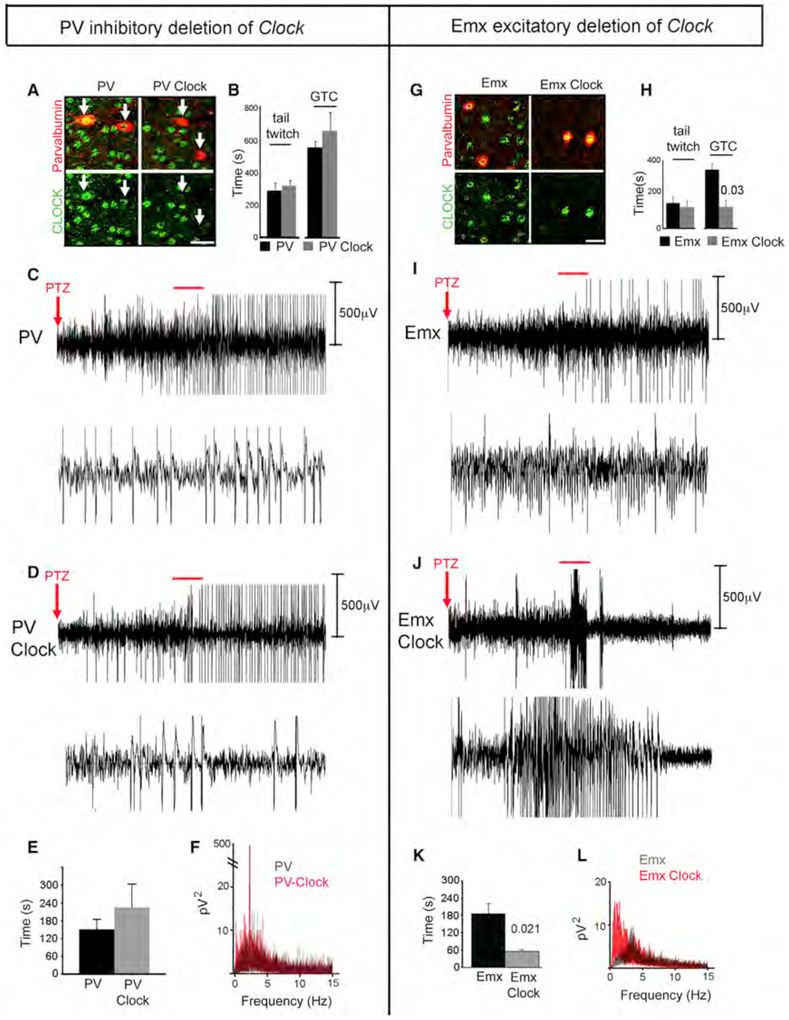
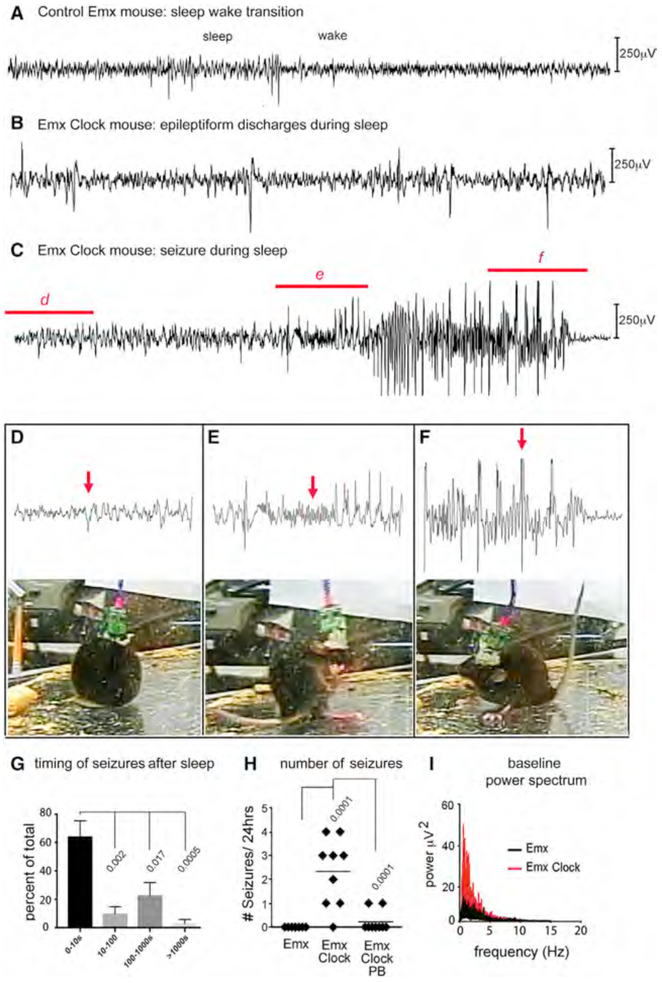
Because molecular mechanisms underlying refractory focal epilepsy are poorly defined, we performed transcriptome analysis on human epileptogenic tissue. Compared with controls, expression of Circadian Locomotor Output Cycles Kaput (CLOCK) is decreased in epileptogenic tissue. To define the function of CLOCK, we generated and tested the Emx-Cre; Clockflox/flox and PV-Cre; Clockflox/flox mouse lines with targeted deletions of the Clock gene in excitatory and parvalbumin (PV)-expressing inhibitory neurons, respectively. The Emx-Cre; Clockflox/flox mouse line alone has decreased seizure thresholds, but no laminar or dendritic defects in the cortex. However, excitatory neurons from the Emx-Cre; Clockflox/flox mouse have spontaneous epileptiform discharges. Both neurons from Emx-Cre; Clockflox/flox mouse and human epileptogenic tissue exhibit decreased spontaneous inhibitory postsynaptic currents. Finally, video-EEG of Emx-Cre; Clockflox/flox mice reveals epileptiform discharges during sleep and also seizures arising from sleep. Altogether, these data show that disruption of CLOCK alters cortical circuits and may lead to generation of focal epilepsy.

Keywords: circadian epilepsy; focal cortical dysplasia; focal epilepsy; tuberous sclerosis complex.


Figures

Figure 1.
Figure 1.. The Epileptogenic Focus Is Defined in a Patient Undergoing Resection
T2 weighted MRI images of a patient (case 1) with a right temporal dysplasia are shown. (A)The pre-surgical MRI shows dysplasia involving the right mesial temporal lobe (black arrows) with a normal temporal tip (white arrow) is shown. (B)On an inferior cut of the MRI from the same patient, the dysplasia extends out to the surface of the temporal lobe (black arrows). (C)This panel shows the diagram of grid placement over the surface of the temporal lobe prior to resection with its orientation to the temporal pole. (D)The higher power diagram of the grid shows the numbering of the electrodes. Blue electrodes correspond to leads with normal tracings, and the red electrodes are in positions with epileptiform discharges, as shown in the subsequent panel. (E)The electrocorticography (ECoG) demonstrates frequent spike-and-wave discharges at the right posterior temporal lobe in leads 5, 6, 9, 13, and 14 (red). The lead at position 10 did not contact the cortical surface, while other leads (blue) did not demonstrate epileptiform discharges. In this case, the superior temporal gyrus and temporal tip were removed to reach the focus and these regions were used as control samples.
Figure 2.
Figure 2.. CLOCK Is Reduced in Human Epileptogenic Tissue
(A)Gene expression in human epileptogenic tissue: using microarray, we compared control tissue, tissue from FCD cases, and tissue from TSC surgical cases. Prior to application of FDR, expression of 900 genes is changed in the same way in FCD and TSC, as compared to control tissue. The heatmap shows expression changes that are common to both in FCD and TSC cases versus control with red denoting upregulation and blue downregulation of expression levels. See also Figure S1 and Table S1. (B)Diagram of the core components of the circadian molecular clock: CLOCK is a transcription factor that dimerizes with BMAL1 to bind to E-box elements in promoters of their target genes, including repressors of CLOCK/BMAL1 transcription, the PER and CRY proteins, and other downstream targets, such as DBP. CRY and PER proteins bind to CLOCK/BMAL1 to inhibit its transcriptional activity. (C)Western analysis of the core components of the circadian molecular CLOCK demonstrates decreased CLOCK in epileptogenic FCD tissue as compared to non-epileptogenic controls. The graphs show pooled data from controls (con, n = 5) and the FCD tissue (n = 18) that we tested for CLOCK expression. Decrease of CLOCK and CLOCK downstream target gene products: CRY (n = 7), PER1 (n = 7), and DBP (n= 10) are statistically significant in FCD, in contrast to BMAL1, which is unchanged in epileptogenic tissue (n = 10). See also Figure S2A. (D)In the same samples, we find that neuronal markers TUJ1 and doublecortin (DCX) are not significantly changed. (E–G) In control human tissue, CLOCK co-localizes with the neuronal marker NeuN (E), Brn2 (F), and PV (G), respectively. The panels are representative staining results from three control tissue and three FCD samples. Arbitrary CLOCK intensity in each NeuN-positive, Brn2-positive, and PV-positive cells is compared between controls (con) and epileptogenic tissues (FCD). The numbers of cells counted are shown on the top of the panels located at the bottom of each representative immunostaining pictures. The average CLOCK intensity is also calculated. Loss of CLOCK expression is significant in both NeuN-positive and Brn2-positive neurons of epileptogenic tissues (FCD) compared to controls. CLOCK is decreased in some of the PARV-positive neurons in the epileptogenic focus. Scale bar represents 20 μm for (E)–(G). All significant p values (less than 0.05) calculated by two-tailed t test are shown on the graphs. Error bars represent SEM. See also Figures S1 and S2 and Tables S1 and S2.
Figure 3.
Figure 3.. Selective Deletion of Clock in Pyramidal Neurons Results in Decreased Seizure Threshold
(A)In PV-Cre; Clockflox/flox mice, CLOCK (green) is not detected in parvalbumin (PV)-positive interneurons (red) but is preserved in other cells. (B)Seizure threshold in PV-Cre; Clockflox/flox mice (n = 15 with 7 females and 8 males) is not significantly different from the control PV-Cre mice (n = 8 with 4 females and 4 males). (C and D) EEG recording of the response following pentylenetetrazol (PTZ) is shown in a representative PV-Cre mouse (C) and a PV-Cre; Clockflox/flox (D) mouse, respectively. The top panels show the first 5 min after PTZ, and the expanded 30 s EEG trace of the region indicated by the red line is shown on the lower panels. (E)Histogram comparing mean latency of seizure onset as measured by video EEG after PTZ administration. (F)Average EEG power spectrum of the first 15 min after PTZ administration for PV-Cre (black) and PV-Cre; Clockflox/flox (red) mice is shown. For the video-EEG experiments, n = 6 with 3 females and 3 males for PV-Cre controls and n = 7 for PV-Cre; Clockflox/flox mice with 3 females and 4 males. (G)The Emx-Cre; Clockflox/flox mouse cortex is immunostained with CLOCK (green) and PV (red). Clock expression is preserved in PV-expressing interneurons, while it is absent in many other neurons. See also Figure S3. (H)Emx-Cre; Clockflox/flox mice (n = 9 with 6 males and 3 females) have a decreased latency to generalized tonic-clonic seizures (GTC) as compared with Emx-Cre controls (n = 19 with 9 males and 10 females) following PTZ treatment, as measured by modified Racine scale. Data were analyzed using ANOVA. (I and J) A 5 min EEG trace of the response following PTZ is shown in a representative Emx-Cre control mouse (I) as compared to an Emx-Cre; Clockflox/flox mouse (J). The bottom panels in both (I) and (J) show an expanded view of the 30 s trace (highlighted with red lines in the top panels). The increased discharges in EEG are observed from Emx-Cre; Clockflox/flox mouse. (K)Histogram comparing mean latency of seizure onset after PTZ administration demonstrates a significantly reduced latency to high-amplitude epileptiform discharges in Emx-Cre; Clockflox/flox mice as compared to Emx-Cre control mice. (L)Average EEG power spectrum of the first 15 min after PTZ administration for Emx-Cre (black) and Emx-Cre; Clockflox/flox (red) mice is shown. All significant p values (less than 0.05) calculated by two-tailed t test are shown on the graphs. For the video-EEG experiments, n = 6 with 3 females and 3 males for Emx-Cre controls and n = 6 for Emx-Cre; Clockflox/flox mice with 3 females and 3 males. All significant p values (less than 0.05) calculated by two-tailed t test are shown on the graphs. Error bars represent SEM. See also Figure S3.
Figure 4.
Figure 4.. Emx-Cre; Clockflox/flox Mice Have No Laminar Defects but Exhibit Specific Spine Defects Similar to Epileptogenic Tissue
(A)The laminar distribution of somatosensory cortical neurons positive for Cux1, an upper layer marker (II-IV), and for CTIP2, a layer 5 marker. is normal in Emx-Cre; Clockflox/flox mice. The percentage of positive neurons in ten equal regions of the cortex spanning pial surface to the ventricular zone of the cortex is counted and compared between control Emx-Cre and Emx-Cre; Clockflox/flox mice. Differences are calculated by the chi-square test. Scale bar represents 50 μm. (B)In contrast, lamination is highly variable in tissue comprising the epileptogenic focus from FCD cases, as determined by staining with the neuronal marker NeuN (red). The green channel shows the morphology of neurons that have been filled with biocytin during whole-cell recording. Scale bar represents 20 μm. (C)The image of a biocytin-filled layer 5 cortical pyramidal neuron from somatosensory cortex region of a control Emx-Cre mouse, with its dendrites labeled as: apical, 1′ branch, 2′ branch, and basal dendrites. (D)High-power views of representative dendritic regions are shown for both Emx-Cre control (Emx) (31 cells from 9 mice) and Emx-Cre; Clockflox/flox (Emx Clock) (18 cells from 7 mice) neurons. (E)Measurement of dendritic spine density demonstrates significant decreases in the apical dendrite and the 1′ branches. (F)A pyramidal neuron from human control tissue is shown (biocytin filled). The dendrites are labeled: apical, 1′ branch, 2′ branch, and basal dendrites. (G)High-power views of representative dendritic regions are shown for both control tissue (con) and epileptogenic tissue from patients with FCD (FCD). (H)Measurement of dendritic spine density demonstrates significant decreases in the apical dendrite and the 1′ branches in 5 cases of FCD (n = 23 neurons) (Table S1) versus neurons in control tissue (n = 21 neurons from 4 individual patients). All significant p values (less than 0.05) calculated by two-tailed t test are shown on the graphs. Error bars represent SEM. See also Figure S4 and Tables S2 and S3.
Figure 5.
Figure 5.. Spontaneous Excitatory Postsynaptic Currents Recordings Reveal Epileptiform Discharges in Emx-Cre; Clockflox/flox Pyramidal Neurons
(A)Spontaneous excitatory postsynaptic currents (sEPSCs) are altered in Emx-Cre; Clockflox/flox mice. Representative raw traces of sEPSCs recorded under voltage-clamp mode are shown for control (Emx) and Emx-Cre; Clockflox/flox (Emx CLOCK) L5 pyramidal neurons. Analysis of recordings show sEPSC amplitude is significantly different between control (n = 28 neurons from 13 mice) and Emx-Cre; Clockflox/flox pyramidal neurons (n = 34 neurons from 14 mice), while there is no significant difference in sEPSC frequency, rise time, or decay time between control and Clock-deficient pyramidal neurons. (B)Miniature excitatory post synaptic currents (mEPSCs) are decreased in frequency in L5 pyramidal neurons (n = 22 from 5 Emx-Cre; Clockflox/flox mice) compared with Emx-Cre controls (n = 14 neurons from 4 mice). sEPSCs were recorded at −60 mV with physiological intracellular solution (130 mM Kgluconate, 10 mM KCl). The recording of mEPSCs was performed in the presence of 1 μM TTX. Significant p values calculated by two-tailed t test are shown. (C)Poly-spike epileptiform activity is observed in the raw trace of sEPSCs recorded from an Emx-Cre; Clockflox/flox pyramidal neuron. (D)The expanded view of one segment of the trace marked by a red line in (C) is shown. (E)Left: scatterplot of the occurrence of epileptiform discharges per 5 min. Horizontal bars within the plot show mean values. Significant p values (less than 0.05) calculated by Mann-Whitney test. Right: comparison of cell numbers in Emx-Cre and Emx-Cre; Clockflox/flox exhibiting epileptiform discharges. Black bars represent the proportion of cells with epileptiform discharges. Fisher’s exact test was used to demonstrate significance. See also Figure S5.
Figure 6.
Figure 6.. Significant Defects Were Observed in Spontaneous Inhibitory Postsynaptic Currents in Pyramidal Neurons from Emx-Cre; Clockflox/flox Mice and Human Epileptogenic Tissue
(A)Representative raw traces of spontaneous inhibitory postsynaptic currents (sIPSCs) from Emx-cre and Emx-cre Clockflox/flox pyramidal neurons are shown. sIPSC amplitude, frequency, rise time, and decay time are significantly changed in CLOCK-deficient neurons (n = 58 from 21 mice) as compared with control (n = 35 from 11 mice). (B)We examined sIPSCs in pyramidal neurons from human FCD epileptogenic tissues. We find a defect in the frequency and rise time of sIPSCs in epileptogenic FCD cases (27 neurons from 5 cases) compared with neurons from control tissue (25 neurons from 3 cases). Cells were held at −60 mV during recording, and high chloride (70 mM Kgluconate, 70 mM KCl) was used for sIPSC recordings, with 20 μM DNQX and 100 μM DL-AP5 to block AMPA and NMDA receptors, respectively. Significant p values (less than 0.05) calculated by two-tailed t test are shown on the graphs. See also Figure S6 and Tables S2 and S4.
Figure 7.
Figure 7.. Spontaneous Seizures in Emx-Cre; Clockflox/flox Mice Are Related to Sleep
(A) Baseline video EEG of a control Emx-cre (Emx) mouse demonstrates a normal transition from sleep to wakefulness. A 30 s trace is shown. (B) Panel shows a 30 s EEG trace of epileptiform discharges in sleep from an Emx-Cre; Clockflox/flox (Emx Clock) mouse. See Movie S1. (C) A spontaneous seizure (Racine grade 5) arises from sleep in an Emx-Cre; Clockflox/flox mouse. See Movie S2. (D-F) Expanded 5 s traces of EEG from regions indicated in (C) are shown with a frame from the video recording taken at the time point shown with red arrows. The EEG trace is obtained from onset of sharp activity from sleep is shown (D). The video shows a sleeping mouse. The trace is taken from the start of the behavioral seizure and increased EMG activity with fast activity following a generalized spike-wave complex (E). The arrow shows the region of the EEG, which corresponds the video panel showing the mouse rearing/falling. The trace shows the resolution of the seizure (F). The EEG shows spike-wave complexes followed by postictal depression. Video panel shows the mouse with its tail in a tonic position. (G)The timing of seizures after EEG recording of sleep is shown. Seizures from eight Emx-Cre; Clockflox/flox mice are binned according to their onset after the end of sleep. Bins are of increasing sizes: 0–10 s, 10–100 s, 100–1,000 s, and >1,000 s. Approximately 60% of seizures occur within 10 s of SWS. A two-way ANOVA analysis was used to demonstrate significance. 32 seizures were detected and used in this analysis. (H)Histogram comparing the mean frequency of spontaneous seizures between Emx-cre and Emx-Cre; Clockflox/flox mice shows that Emx-Cre mice have no observable seizures in contrast to spontaneous seizures in Emx-Cre; Clockflox/flox mice. Injecting Emx-Cre; Clockflox/flox mice with 30 mg/kg of phenobarbital (Emx Clock PB) results in a statistically significant reduction in seizures in the subsequent 24-hr period. Significant p values (less than 0.05) calculated by two-tailed t test are shown on the graphs (n = 8 mice in each group). Error bars represent SEM. (I)Average baseline EEG power spectrum of Emx-Cre; Clockflox/flox (red) and control Emx-Cre (black) mice compares the mean power versus frequencies and shows higher amplitudes in the Emx-Cre; Clockflox/flox mice (n = 4) versus Emx-Cre control (n = 6). Also see Figure S7.

Comment in

References

    1. Antoch MP, Song EJ, Chang AM, Vitaterna MH, Zhao Y, Wilsbacher LD, Sangoram AM, King DP, Pinto LH, and Takahashi JS (1997). Functional identification of the mouse circadian Clock gene by transgenic BAC rescue. Cell 89, 655–667. - PMC - PubMed
    1. Arranz AM, Perkins KL, Irie F, Lewis DP, Hrabe J, Xiao F, Itano N, Kimata K, Hrabetova S, and Yamaguchi Y (2014). Hyaluronan deficiency due to Has3 knock-out causes altered neuronal activity and seizures via reduction in brain extracellular space. J. Neurosci 34, 6164–6176. - PMC - PubMed
    1. Benjamini Y, and Hochberg Y (1995). Controlling the false discovery rate: a practical and powerful approach to multiple testing. J. R. Stat. Soc. Ser. A Stat. Soc 57, 289–300.
    1. Blümcke I, Thom M, Aronica E, Armstrong DD, Vinters HV, Palmini A, Jacques TS, Avanzini G, Barkovich AJ, Battaglia G, et al. (2011). The clinicopathologic spectrum of focal cortical dysplasias: a consensus classification proposed by an ad hoc Task Force of the ILAE Diagnostic Methods Commission. Epilepsia 52, 158–174. - PMC - PubMed
    1. Bourgeois B (1996). The relationship between sleep and epilepsy in children. Semin. Pediatr. Neurol 3, 29–35. - PubMed

LinkOut - more resources