. 2017 Oct 11;96(2):461-475.e5.
doi: 10.1016/j.neuron.2017.09.043.

Dynamics of Gut-Brain Communication Underlying Hunger

Affiliations

Dynamics of Gut-Brain Communication Underlying Hunger

Lisa R Beutler et al. Neuron. .

Abstract

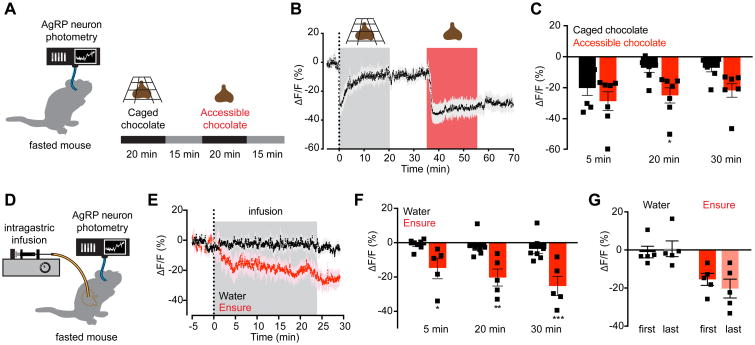
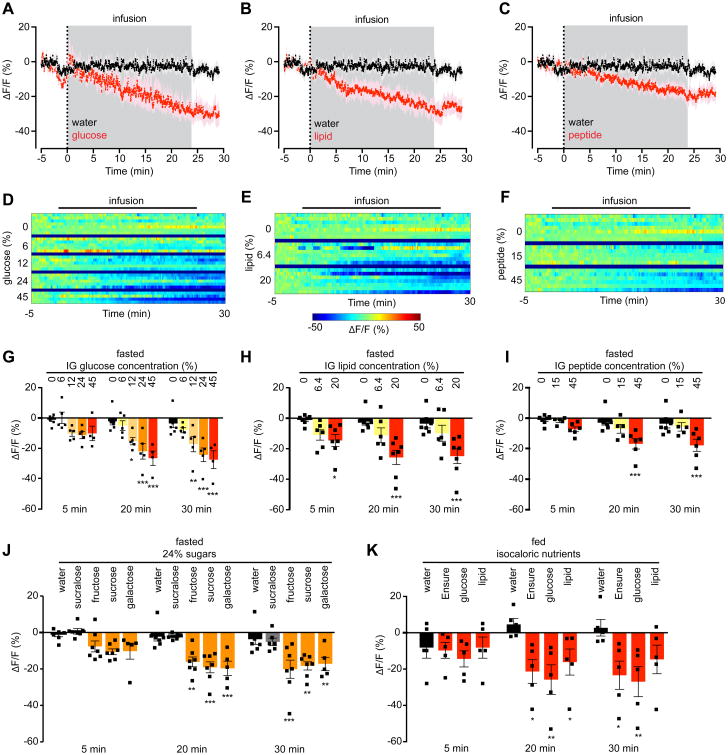
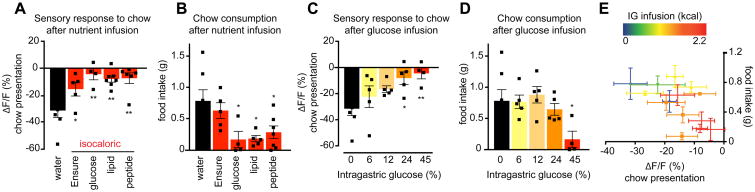
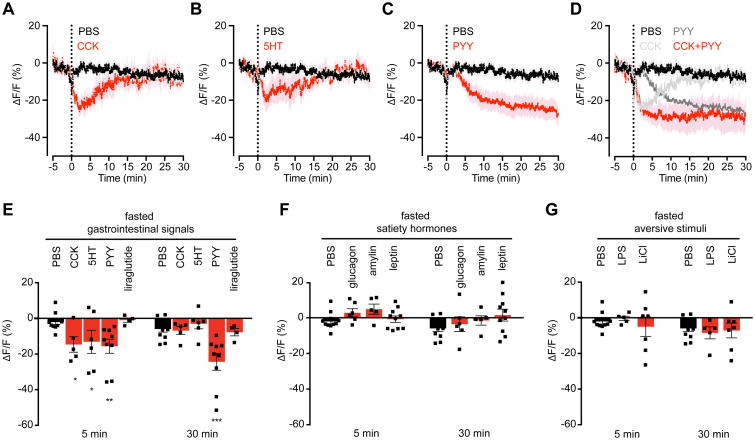
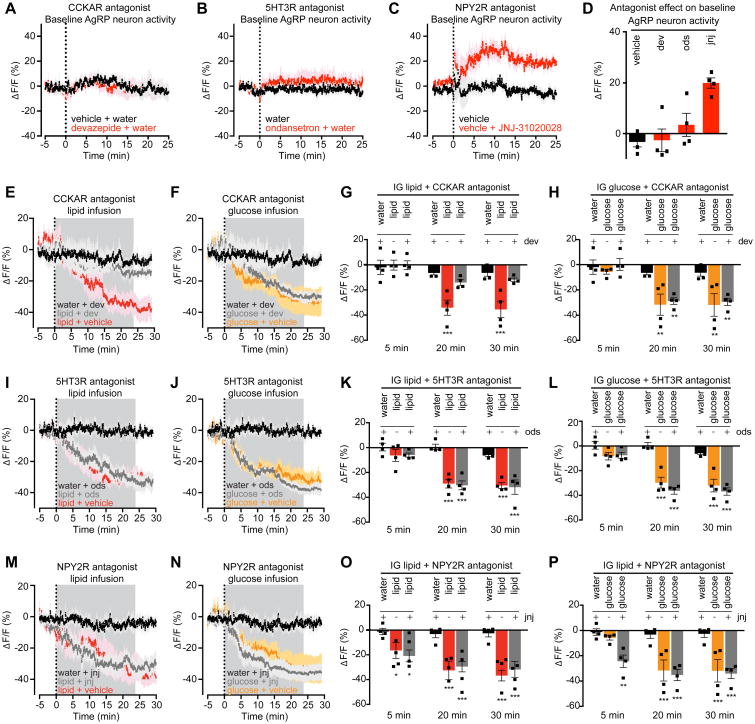
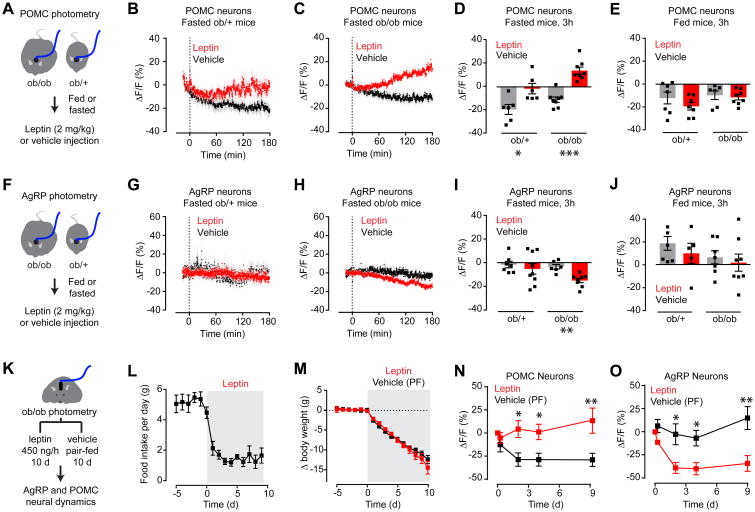
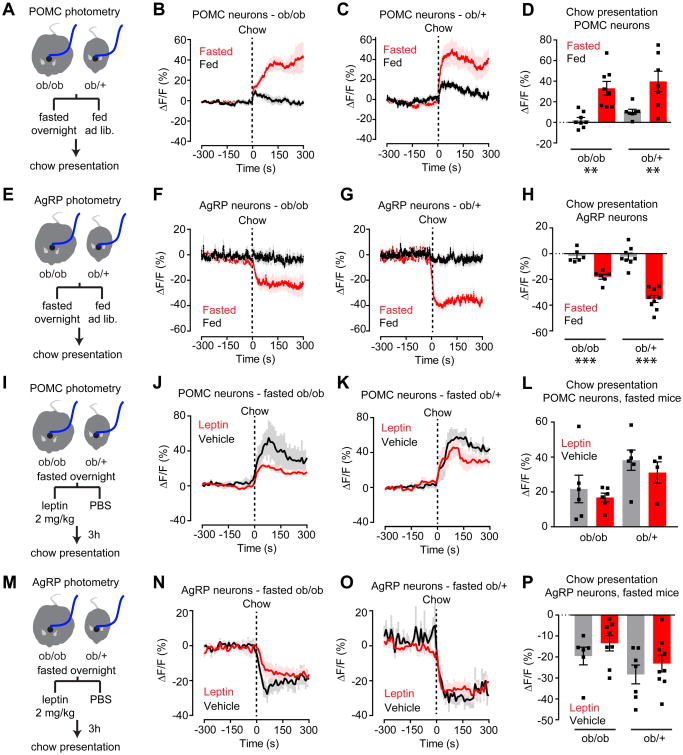
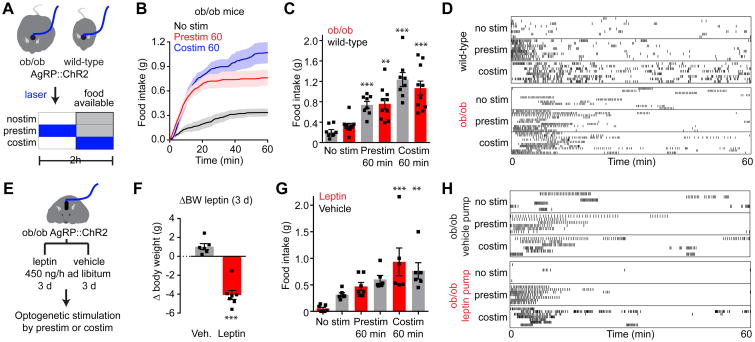
Communication between the gut and brain is critical for homeostasis, but how this communication is represented in the dynamics of feeding circuits is unknown. Here we describe nutritional regulation of key neurons that control hunger in vivo. We show that intragastric nutrient infusion rapidly and durably inhibits hunger-promoting AgRP neurons in awake, behaving mice. This inhibition is proportional to the number of calories infused but surprisingly independent of macronutrient identity or nutritional state. We show that three gastrointestinal signals-serotonin, CCK, and PYY-are necessary or sufficient for these effects. In contrast, the hormone leptin has no acute effect on dynamics of these circuits or their sensory regulation but instead induces a slow modulation that develops over hours and is required for inhibition of feeding. These findings reveal how layers of visceral signals operating on distinct timescales converge on hypothalamic feeding circuits to generate a central representation of energy balance.


Figures

Figure 1
Figure 1. Nutrient intake is necessary and sufficient for sustained AgRP neuron inhibition
(A) Schematic of experiment in (B-C). Fasted mice were presented with caged chocolate and then available chocolate during photometry recording from AgRP neurons. (B) Calcium signal from AgRP neurons in fasted mice presented first with caged chocolate (gray) and then available chocolate (red) (n=7 mice). (C) Quantification of ΔF/F from (B). Times shown are 5-min windows immediately after chocolate presentation (5 min), immediately prior to chocolate removal (20 min), and 10 min following chocolate removal (30 min). * P = 0.02 compared to caged chocolate (Holm-Sidak's multiple comparisons test adjusted p-value) (D) Schematic of the experimental set-up for AgRP photometry recording during intragastric nutrient infusion for 24 min. (E) Calcium signal from AgRP neurons in fasted mice during intragastric infusion with water (black) or Ensure liquid diet (red). Gray denotes infusion (n = 7 mice for water; n = 5 mice for Ensure). (F) Quantification of ΔF/F from (E). Times shown are 5-min windows from the early part of infusion (5 min), the end of infusion (20 min), and 10 min following the end of infusion (30 min). *P < 0.05, **P = <0.01, ***P < 10-3 compared to water infusion at the indicated time point (Holm-Sidak's multiple comparisons test, adjusted p-value). (G) Quantification of ΔF/F at the end of infusion following the first and last intragastric exposures to water (black) and Ensure (red). Infusions were separated by approximately 7 weeks. (B and E) Traces represent mean ± SEM (C,F,G) ■ denotes individual mice. Bars represent mean ± SEM See also Figure S1.
Figure 2
Figure 2. Inhibition of AgRP neurons by nutrients is independent of macronutrient composition or nutritional state and is proportional to calorie ingestion
(A-C) Calcium signal from AgRP neurons in fasted mice during intragastric infusion with water (black) or isocaloric and isovolemic quantities of 45% glucose (A), 20% lipid (B), or 45% peptide (C) solutions (red). Traces represent mean ± SEM. Gray denotes infusion. (n = 4-7 mice per group) (D-F) Peri-infusion heat maps depicting ΔF/F during photometry recording in fasted mice receiving intragastric infusion of the indicated concentrations of glucose (D), lipid (E), or peptide (F). Each row represents the average of 1-3 trials of an individual mouse. (n = 4-7 mice per group). (G-I) Quantification of ΔF/F from (D-F). (J) Quantification of ΔF/F during photometry recording in fasted mice receiving intragastric infusion of the indicated 24% mono- and disaccharide solutions or the non-caloric sweetener sucralose. (K) Quantification of ΔF/F during photometry recording from AgRP neurons in ad libitum fed mice receiving intragastric infusion of the indicated isocaloric solutions. (n = 5 mice per group). (G-K) ■ denotes individual mice. Times shown are 5-min windows from the early part of infusion (5 min), the end of infusion (20 min), and 10 min following the end of infusion (30 min). Bars represent mean ± SEM. *P < 0.05, **P < 0.01, ***P < 10-3 compared to H2O infusion at the indicated time point (Holm-Sidak multiple comparisons test, adjusted p-value). See also Figure S2.
Figure 3
Figure 3. AgRP neuron inhibition in response to the sensory detection of food is inversely related to intragastric calorie infusion and predicts subsequent chow consumption
(A and C) Quantification of ΔF/F during photometry recording from AgRP neurons in fasted mice for 5 min following chow presentation. Chow was presented 15 min after the end of intragastric infusion of the indicated nutrients. (n = 4-7 mice per group). (B and D) Food intake was recorded for the first 20 minutes of re-feeding during the experiment described in (A and C). (E) Correlation of ΔF/F following chow presentation with food intake during the first 20 minutes of re-feeding for all intragastric infusions in fasted animals shown in Figure 2. Points on the scatter plot represent mean ± SEM. Color gradient represents caloric content of the infusates. (A-D) ■ denotes individual mice. Bars represent mean ± SEM. *P < 0.05, **P < 0.01 compared to H2O infusion (Holm-Sidak multiple comparisons test, adjusted p-value). See also Figure S3.
Figure 4
Figure 4. CCK, PYY, and 5HT are sufficient to inhibit AgRP neuron activity
(A-D) Calcium signal from AgRP neurons in fasted mice after IP injection with PBS (black) or CCK (A), 5HT (B), PYY(C), or a combination of CCK and PYY (D) (red). Traces represent mean ± SEM. Traces showing ΔF/F for individual injections of CCK and PYY are also shown in (D) (gray). (n=5-11 mice per group). (E) Quantification of ΔF/F from (A-C). Quantification of ΔF/F following liraglutide injection is also shown. (F and G) Quantification of ΔF/F during photometry recording in fasted mice following IP injection of the indicated compounds. (E-G) ■ denotes individual mice. Times shown are 5-min windows 5 and 30 min after injection. Bars represent mean ± SEM. *P < 0.05, **P < 0.01, ***P < 10-3 compared to PBS injection at the indicated time point (Holm-Sidak multiple comparisons test, adjusted p-value). See also Figure S4.
Figure 5
Figure 5. PYY is necessary for inhibiting the basal firing rate of AgRP neurons. CCK is necessary for AgRP neuron inhibition caused by lipid
(A-C) Calcium signal from AgRP neurons in fasted mice in response to vehicle (black) or devazepide (dev, A), ondansetron (ods, B), or JNJ-31020028 (jnj, C) (red). (D) Quantification of ΔF/F from (A-C). Time shown is a 5-min time window 25 min after antagonist administration. (E and F) Calcium signal in fasted mice after intragastric injection of dev or vehicle followed by intragastric infusion of lipid (E) or glucose (F). (G and H) Quantification of of ΔF/F from (E and F). n = 4 mice per group. (I and J) Calcium signal from AgRP neurons in fasted mice after intragastric injection of ods or vehicle followed by intragastric infusion of lipid (I) or glucose (J). (K and L) Quantification of of ΔF/F from (I and J). n = 4 mice per group. (M and N) Calcium signal from AgRP neurons in fasted mice after subcutaneous injection of jnj or vehicle followed by intragastric infusion of lipid (M) or glucose (N). (O and P) Quantification of of ΔF/F from (M and N). n = 4 mice per group. (A-C, E, F, I, J, M, N) traces represent mean ± SEM (G, H, K, L, O, P) Times shown are 5-min windows from the early part of infusion (5 min), the end of infusion (20 min), and 10 min following the end of infusion (30 min). ■ denotes individual mice. Bars represent mean ± SEM. *P < 0.05, ***P < 10-3 compared to vehicle at the indicated time point.
Figure 6
Figure 6. Leptin gradually modulates the activity of AgRP and POMC neurons in fasted animals
(A) Schematic of experiments in (B-E). 3 hour photometry recording from POMC neurons in fasted or fed ob/ob and ob/+ mice injected with leptin. (B and C) Calcium signal from POMC neurons in fasted ob/+ (B) and ob/ob (C) mice after vehicle (black) or leptin (red) injection. (n = 6-8 mice per group). (D and E) Quantification of ΔF/F of POMC neurons after prolonged photometry recording following IP injection of vehicle or leptin in fasted (D) and fed (E) states. (F) Schematic of experiments in (G-J). 3 hour photometry recording from AgRP neurons in fasted or fed ob/ob and ob/+ mice injected with leptin. (G and H) Calcium signal from AgRP neurons in fasted ob/+ (G) and ob/ob (H) mice after vehicle (black) or leptin (red) injection. (n = 7-8 mice per group) (I and J) Quantification of ΔF/F of AgRP neurons after prolonged photometry recording following IP injection of vehicle or leptin in fasted (I) and fed (J) states. (K) Schematic of experiments in (L-O). Body weight, food intake, and photometry signals from AgRP and POMC neurons were measured in ob/ob mice during chronic leptin or vehicle infusion by mini-osmotic pumps. Vehicle treated animals were pair-fed (PF) to leptin treated animals. Mini-osmotic pump was implanted at day 0 (L and M) Food intake (L) and change in body weight (M) following vehicle or leptin infusion. (n = 9 mice per group). (N and O) Quantification of ΔF/F following vehicle (black) or leptin (red) infusion by mini-osmotic pump in POMC (N) and AgRP (O) neurons. (n = 4 mice). (B, C, G, H, L, M, N, O) Traces represent mean ± SEM (D,E,I,J) ■ denotes individual mice. Bars represent mean ΔF/F ± SEM over a 15-min window 3 hours after injection. *P < 0.05, **P < 0.01, ***P < 10-3 See also Figure S5.
Figure 7
Figure 7. Leptin is neither necessary nor sufficient for gating the sensory regulation of AgRP and POMC neurons
(A) Schematic of experiments in (B-D). Photometry recording from POMC neurons in fasted and fed ob/ob and ob/+ mice in response to chow presentation. (B and C) Calcium signal from POMC neurons in ob/ob (B) and ob/+ (C) mice in response to chow presentation in the fed (black) or fasted (red) state. (n = 7-8 mice per group). (D) Quantification of ΔF/F from (B, C). (E) Schematic of experiments in (F-H). Photometry recording from AgRP neurons in fasted and fed ob/ob and ob/+ mice in response to chow presentation (F and G) Calcium signal from AgRP neurons in ob/ob (F) and ob/+ (G) mice in response to chow presentation in the fed (black) or fasted (red) state (n = 6-9 mice per group). (H) Quantification of ΔF/F from (F, G). (I) Schematic of experiments in (J-L). Photometry recording from POMC neurons in fasted ob/ob and ob/+ mice in response to chow presentation after vehicle or leptin injection. (J and K) Calcium signal from POMC neurons in ob/ob (J) and ob/+ (K) mice in response to chow presentation after vehicle (black) or leptin (red) injection. (n = 4-6 mice per group). (L) Quantification of ΔF/F from (J, K). (M) Schematic of experiments in (N-P). Photometry recording from AgRP neurons in fasted ob/ob and ob/+ mice in response to chow presentation after vehicle or leptin injection. (N and O) Calcium signal from AgRP neurons in ob/ob (N) and ob/+ (O) mice in response to chow presentation after vehicle (black) or leptin (red) injection (n= 6-9 mice per group). (P) Quantification of ΔF/F from (N,O). (B, C, F, G, J, K, N, O) Traces represent mean ± SEM (D,H,L,P) ■ denotes individual mice. Bars represent mean ΔF/F ± SEM over a 5-min window following chow presentation. *P < 0.05, **P < 0.01, ***P < 10-3 See also Figure S6.
Figure 8
Figure 8. AgRP neurons are epistatic to leptin's effect on food intake
(A) Schematic of experiments in (B-D). Optogenetic stimulation of AgRP neurons in ad libitum fed WT and ob/ob mice prior to (prestim) or during (costim) food availability. Blue indicates the timing of laser stimulation. (B) Cumulative food intake by ob/ob mice after no stimulation (black), 60 min pre-stimulation (red), or during 60 min co-stimulation (blue). Traces represent mean ± SEM (n = 6-10 mice per group). (C) Quantification of food intake from (B). (D) Raster plots showing feeding pattern in individual mice from (B and C). (E) Schematic of experiments in (F-H). Optogenetic stimulation of AgRP neurons in ad libitum fed, ob/ob mice during chronic vehicle or leptin infusion by mini-osmotic pumps. Stimulation occurred prior to (prestim) or during (costim) food availability as in (A). (F) Bodyweight change in ob/ob mice 3 days after implantation of a mini-osmotic pump infusing vehicle (gray, n = 6 mice) or leptin (red, n = 7 mice) (G) Quantification of food intake by ad libitum fed ob/ob mice from (F) receiving chronic vehicle (gray) or leptin (red) infusion after no stimulation, 60 min pre-stimulation, or during 60 min co-stimulation. (H) Raster plots showing feeding pattern in individual mice from (G). (C, F, G) ■ denotes individual mice. Bars represent mean ± SEM. *P < 0.05, **P < 0.01, ***P < 10-3. (D and H) Each row represents a single trial from a different animal and each point indicates consumption of a 0.02 g pellet. See also Figure S7.

Similar articles

Cited by

References

    1. Acuna-Goycolea C, van den Pol AN. Peptide YY3-36 inhibits both anorexigenic proopiomelanocortin and orexigenic neuropeptide Y neurons: Implications for hypothalamic regulation of energy homeostasis. Journal of Neuroscience. 2005;25:10510–10519. - PMC - PubMed
    1. Andermann ML, Lowell BB. Toward a Wiring Diagram Understanding of Appetite Control. Neuron. 2017;95:757–778. - PMC - PubMed
    1. Andrews ZB, Liu ZW, Walllingford N, Erion DM, Borok E, Friedman JM, Tschop MH, Shanabrough M, Cline G, Shulman GI, et al. UCP2 mediates ghrelin's action on NPY/AgRP neurons by lowering free radicals. Nature. 2008;454:846–851. - PMC - PubMed
    1. Barrachina MD, Martinez V, Wang LX, Wei JY, Tache Y. Synergistic interaction between leptin and cholecystokinin to reduce short-term food intake in lean mice. Proceedings of the National Academy of Sciences of the United States of America. 1997;94:10455–10460. - PMC - PubMed
    1. Becskei C, Lutz TA, Riediger T. Glucose reverses fasting-induced activation in the arcuate nucleus of mice. Neuroreport. 2008;19:105–109. - PubMed

MeSH terms