. 2017 Sep 1;97(3):466-477.
doi: 10.1093/biolre/iox101.

Adrenomedullin improves fertility and promotes pinopodes and cell junctions in the peri-implantation endometrium

Affiliations

Adrenomedullin improves fertility and promotes pinopodes and cell junctions in the peri-implantation endometrium

Brooke C Matson et al. Biol Reprod. .

Abstract

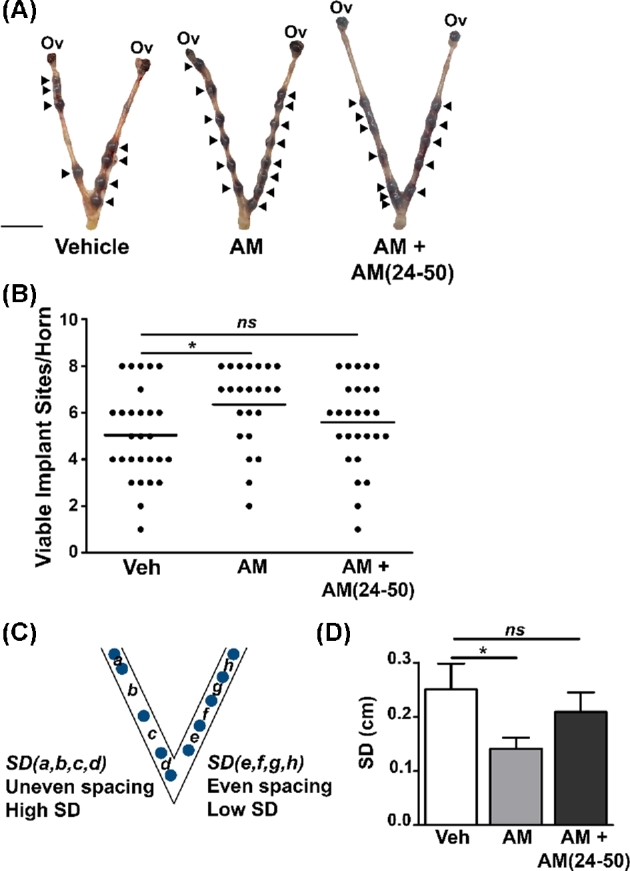
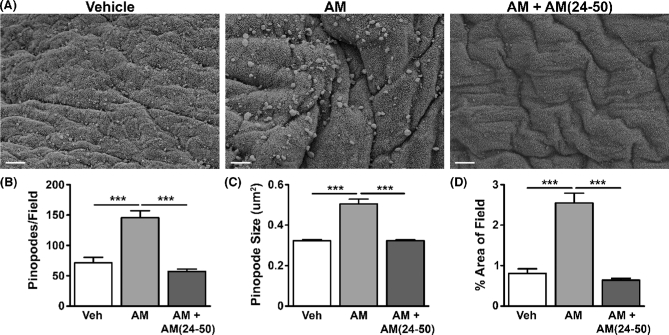
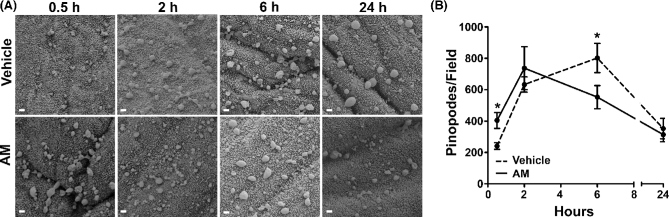
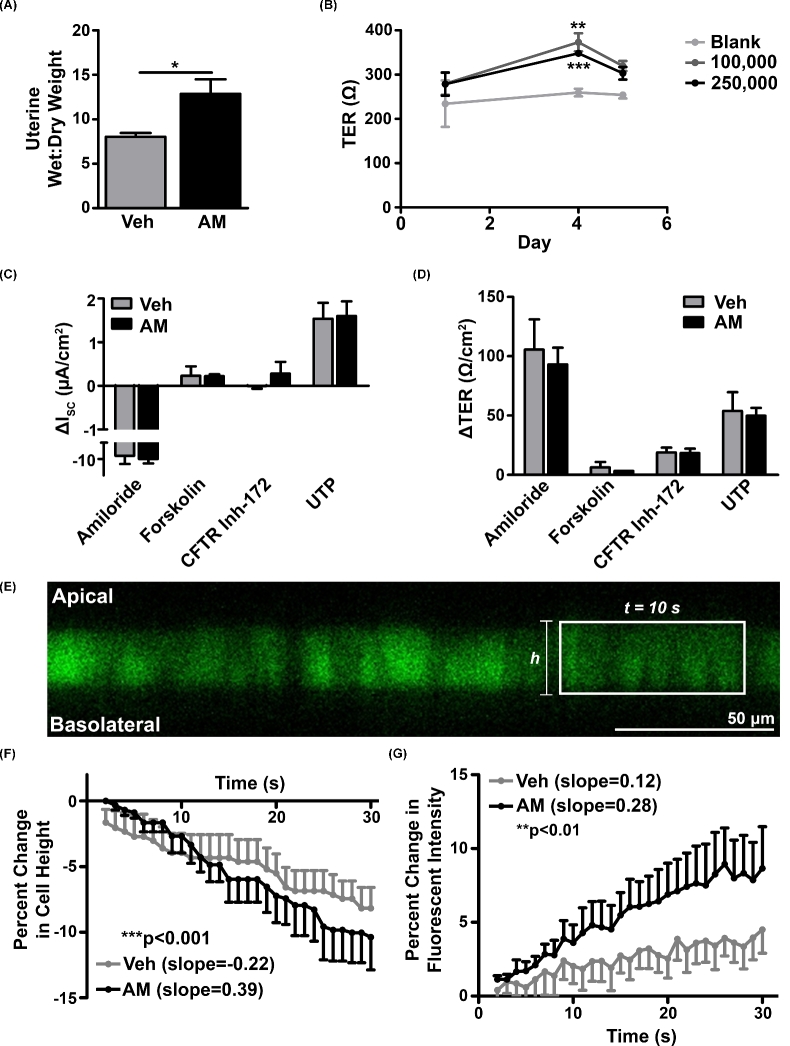
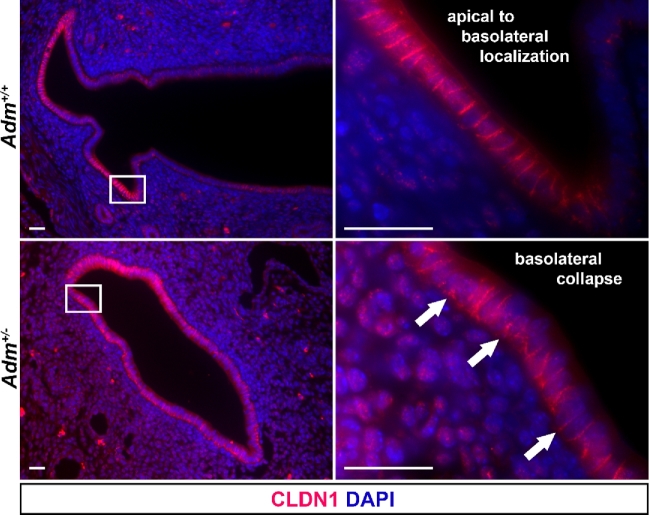
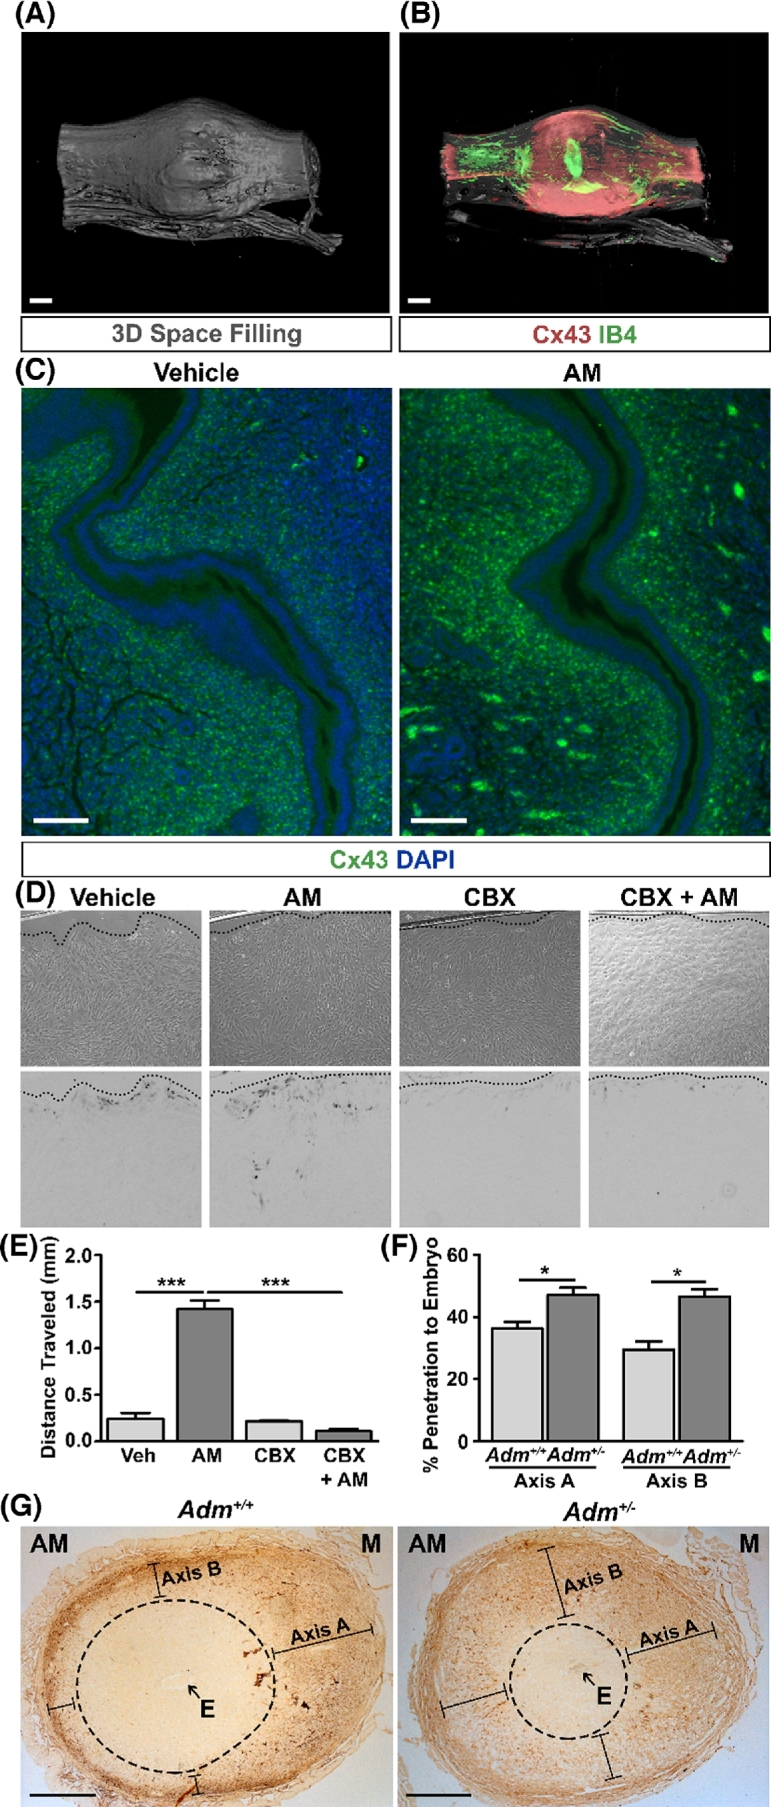
Implantation is a complex event demanding contributions from both embryo and endometrium. Despite advances in assisted reproduction, endometrial receptivity defects persist as a barrier to successful implantation in women with infertility. We previously demonstrated that maternal haploinsufficiency for the endocrine peptide adrenomedullin (AM) in mice confers a subfertility phenotype characterized by defective uterine receptivity and sparse epithelial pinopode coverage. The strong link between AM and implantation suggested the compelling hypothesis that administration of AM prior to implantation may improve fertility, protect against pregnancy complications, and ultimately lead to better maternal and fetal outcomes. Here, we demonstrate that intrauterine delivery of AM prior to blastocyst transfer improves the embryo implantation rate and spacing within the uterus. We then use genetic decrease-of-function and pharmacologic gain-of-function mouse models to identify potential mechanisms by which AM confers enhanced implantation success. In epithelium, we find that AM accelerates the kinetics of pinopode formation and water transport and that, in stroma, AM promotes connexin 43 expression, gap junction communication, and barrier integrity of the primary decidual zone. Ultimately, our findings advance our understanding of the contributions of AM to uterine receptivity and suggest potential broad use for AM as therapy to encourage healthy embryo implantation, for example, in combination with in vitro fertilization.

Keywords: assisted reproductive technology; decidua; endometrium; fertility; implantation; in vitro fertilization (IVF); mechanisms of hormone action; pregnancy; uterus.


Figures

Figure 1.
Figure 1.
AM improves implantation success and spacing in mice. (A) Images of e6.5 embryos within uteri treated with vehicle, AM, or AM + AM(24–50) prior to transfer of eight blastocysts per horn. Arrowheads indicate viable implantation sites as determined by uptake of Evans blue dye. Scale bar, 1 cm. (B) Quantitation of viable implant sites per horn. Dots represent uterine horns. ns, not significant. *P < 0.05, Mann-Whitney test. (C) Illustration of quantitation method for spacing of e6.5 embryos within uterine horns. SD, standard deviation. (D) Quantitation of spacing in vehicle (n = 26), AM (n = 21), and AM + AM(24–50) (n = 25) horns using method depicted in (C). *P < 0.05, unpaired t test with Welch's correction.
Figure 2.
Figure 2.
Scanning electron micrographs of pinopodes and other ultrastructural features of uterine epithelial cells in wild-type mice on days 2.5–3.5 of pseudopregnancy. (A) Box encloses the image displayed in (B). Scale bar, 10 μm. (B) Juxtaposition of a single large pinopode and many smaller pinopodes. Arrow points to a potentially degenerate pinopode. Scale bar, 5 μm. (C) Pinopodes projecting above the epithelial cell layer into the lumen of the uterus. Scale bar, 1 μm. (D) Arrows point to potentially degenerate pinopodes. Arrowheads denote examples of cell–cell borders. Asterisks signify area dense in microvilli. Scale bar, 1 μm.
Figure 3.
Figure 3.
AM promotes pinopode formation and size. (A) Scanning electron micrographs of pinopodes in wild-type pseudopregnant uteri treated with vehicle, AM, or AM + AM (24–50) for 30 min. Scale bars, 5 μm. (B–D) Quantitation of pinopodes per field (B), size (C), and percent area of field (D). n ≥ four fields from n ≥ three animals per treatment group. ***P < 0.001, unpaired t test.
Figure 4.
Figure 4.
AM accelerates pinopode formation dynamics in wild-type mice between days 2.5 and 3.5 of pseudopregnancy. (A) Scanning electron micrographs of vehicle- and AM-treated uteri throughout treatment time course. Scale bars, 1 μm. (B) Quantitation of pinopodes per field throughout treatment time course. n ≥ six fields total from n = three animals per treatment group. *P < 0.05 at indicated time point, Bonferroni post-tests following two-way ANOVA.
Figure 5.
Figure 5.
AM enhances uterine wet:dry weight in vivo and water transport across Ishikawa cells in vitro. (A) Wet:dry weight ratio of wild-type uteri on day 2.5 of pseudopregnancy. n = three animals per treatment group. *P < 0.05, unpaired t test. (B) Change in transepithelial resistance (TER) of Ishikawa cells seeded at densities of 100,000 and 250,000 cells per transwell compared to a blank transwell between days 1 and 5 of culture. n ≥ three cultures per time point. **P < 0.01, ***P < 0.001, unpaired t test at each density compared to blank. (C and D) Changes in short-circuit current (C) and TER (D) after addition of activators and inhibitors of ion channels following vehicle- and AM-pre-treated cultures (n = three per pre-treatment group). (E) Representative image of calcein-loaded Ishikawa cells used in water permeability experiment. Rectangle encloses representative series of adjacent cells analyzed for changes in cell height and fluorescence after addition of hypertonic solution. Scale bar, 50 μm. (F) Percent change in Ishikawa cell height after vehicle (n = five cumulative treatments from three cultures) and AM (n = six cumulative treatments from three cultures) pretreatment followed by hypertonic shock. Data are presented as mean + SEM (vehicle) or mean – SEM (AM). Slopes were calculated by linear regression analysis. ***P < 0.001, ANCOVA. (G) Percent change in calcein fluorescent intensity after hypertonic shock. Data are presented as mean – SEM (vehicle) or mean + SEM (AM). Slopes were calculated by linear regression analysis. **P < 0.01, ANCOVA.
Figure 6.
Figure 6.
AM contributes to proper CLDN1 localization. Immunohistochemistry for CLDN1 in wild-type (n = 3) and Adm+/-(n = 4) e5.5 interimplantation sites. Arrows denote CLDN1 localization, spanning the apical-basolateral axis of epithelial cell lateral borders (Adm+/+) or concentrated on the basolateral side of the epithelial cell layer (Adm+/). Scale bars, 20 μm.
Figure 7.
Figure 7.
AM enhances gap junction expression and communication in uterine stroma. (A and B) Optical projection tomography (OPT) three-dimensional space filling scan (A) and Cx43 expression scan (B) of a wild-type e5.0 implantation site and adjacent interimplantation sites. IB4 lectin staining indicates endothelium and embryonic tissue. Scale bars, 400 μm. (C) Immunohistochemistry for Cx43 in pseudopregnant uteri treated with vehicle or AM for 30 min. Clusters of signal at the periphery of the AM image are autoflurescent red blood cells. n = three animals per treatment group. Scale bars, 100 μm. (D) Bright field (top) and inverted fluorescent (bottom) images of a scrape loading assay in hESCs. Dotted lines indicate location of the scrape. (E) Quantitation of distance traveled by lucifer yellow dye from the scrape. CBX, carbenoxolone, a gap junction inhibitor. n = three fields per treatment group. ***P < 0.001, unpaired t test. (F) Quantitation of distance traveled by biotinylated BSA toward the embryo of e7.5 Adm+/+ (n ≥ 7 per axis) and Adm+/ (n ≥ 25 per axis) implantation sites as a percentage of the total length of the axes depicted in (G). *P < 0.05, unpaired t test. (G) Representative images of e7.5 Adm+/+ and Adm+/ implantation sites stained for diaminobenzidine to assess the penetration of biotinylated BSA toward the embryo. The area within the dashed ellipses represents the zone not penetrated by BSA. Lines represent distance traveled by BSA toward embryo and quantitated in (F). Scale bars, 0.5 mm. AM, anti-mesometrial side; E, embryo; M, mesometrial side.

References

    1. Wang H, Dey SK. Roadmap to embryo implantation: clues from mouse models. Nat Rev Genet 2006; 7:185–199. - PubMed
    1. Cha J, Sun X, Dey SK. Mechanisms of implantation: strategies for successful pregnancy. Nat Med 2012; 18:1754–1767. - PMC - PubMed
    1. Cha J, Dey SK. Cadence of procreation: orchestrating embryo-uterine interactions. Semin Cell Dev Biol 2014; 34:56–64. - PMC - PubMed
    1. Hantak AM, Bagchi IC, Bagchi MK. Role of uterine stromal-epithelial crosstalk in embryo implantation. Int J Dev Biol 2014; 58:139–146. - PMC - PubMed
    1. Scott RT Jr, Ferry K, Su J, Tao X, Scott K, Treff NR. Comprehensive chromosome screening is highly predictive of the reproductive potential of human embryos: a prospective, blinded, nonselection study. Fertil Steril 2012; 97:870–875. - PubMed

MeSH terms