

Effect of number of open charts on intercepted wrong-patient medication orders in an emergency department
- PMID: 29025090
- PMCID: PMC7646860
- DOI: 10.1093/jamia/ocx099
Effect of number of open charts on intercepted wrong-patient medication orders in an emergency department
Abstract
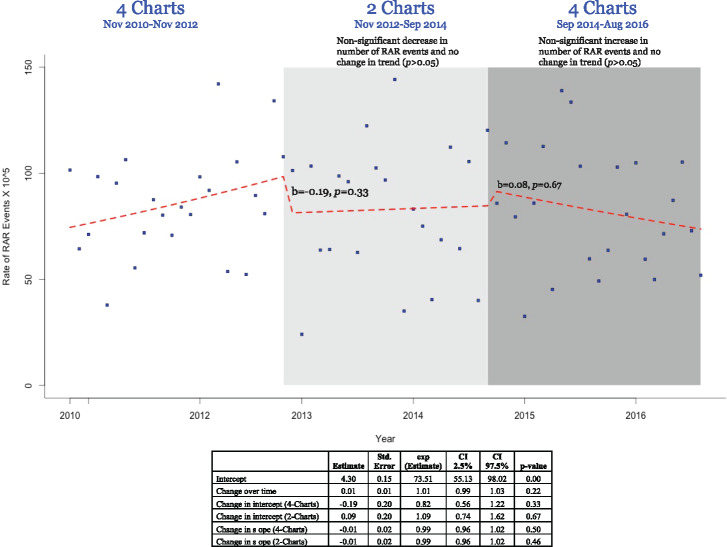
To reduce the risk of wrong-patient errors, safety experts recommend allowing only one patient chart to be open at a time. Due to the lack of empirical evidence, the number of allowable open charts is often based on anecdotal evidence or institutional preference, and hence varies across institutions. Using an interrupted time series analysis of intercepted wrong-patient medication orders in an emergency department during 2010-2016 (83.6 intercepted wrong-patient events per 100 000 orders), we found no significant decrease in the number of intercepted wrong-patient medication orders during the transition from a maximum of 4 open charts to a maximum of 2 (b = -0.19, P = .33) and no significant increase during the transition from a maximum of 2 open charts to a maximum of 4 (b = 0.08, P = .67). These results have implications regarding decisions about allowable open charts in the emergency department in relation to the impact on workflow and efficiency.
Figures
References
-
- Adler-Milstein J, DesRoches CM, Kralovec P et al. , Electronic health record adoption in us hospitals: progress continues, but challenges persist. Health Affairs. 2015;3412:2174–80. - PubMed
-
- Han YY, Carcillo JA, Venkataraman ST et al. , Unexpected increased mortality after implementation of a commercially sold computerized physician order entry system. Pediatrics. 2005;1166:1506–12. - PubMed
Publication types
MeSH terms
Grants and funding
LinkOut - more resources
Full Text Sources
Other Literature Sources
Medical
