. 2017 Oct 12;18(1):781.
doi: 10.1186/s12864-017-4200-x.

Genes for asparagine metabolism in Lotus japonicus: differential expression and interconnection with photorespiration

Affiliations

Genes for asparagine metabolism in Lotus japonicus: differential expression and interconnection with photorespiration

Margarita García-Calderón et al. BMC Genomics. .

Abstract

Background: Asparagine is a very important nitrogen transport and storage compound in plants due to its high nitrogen/carbon ratio and stability. Asparagine intracellular concentration depends on a balance between asparagine biosynthesis and degradation. The main enzymes involved in asparagine metabolism are asparagine synthetase (ASN), asparaginase (NSE) and serine-glyoxylate aminotransferase (SGAT). The study of the genes encoding for these enzymes in the model legume Lotus japonicus is of particular interest since it has been proposed that asparagine is the principal molecule used to transport reduced nitrogen within the plant in most temperate legumes.

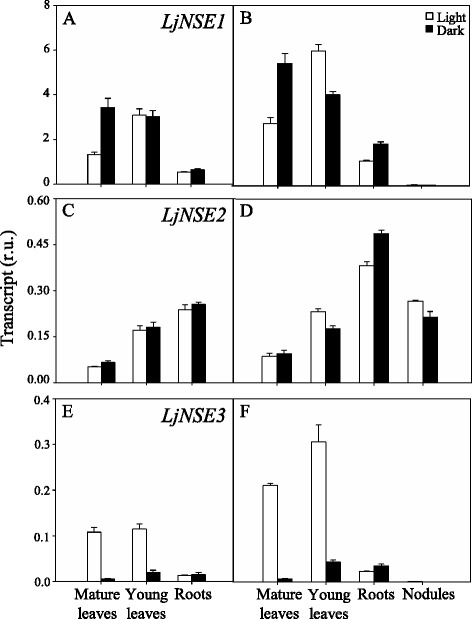
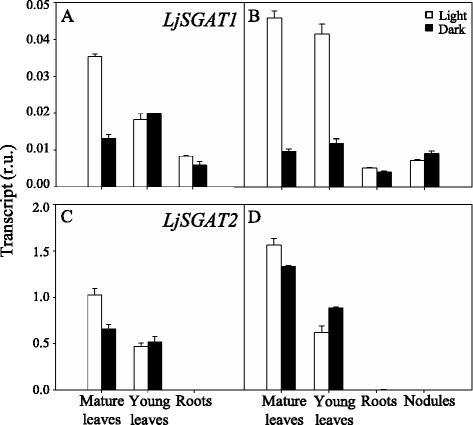
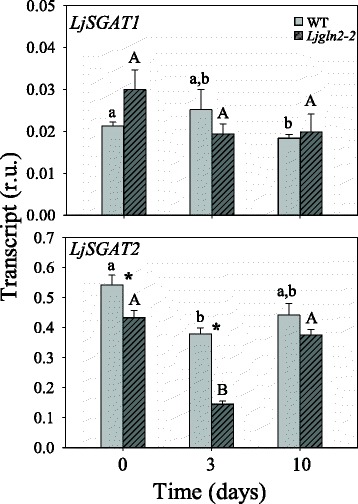
Results: A differential expression of genes encoding for several enzymes involved in asparagine metabolism was detected in L. japonicus. ASN is encoded by three genes, LjASN1 was the most highly expressed in mature leaves while LjASN2 expression was negligible and LjASN3 showed a low expression in this organ, suggesting that LjASN1 is the main gene responsible for asparagine synthesis in mature leaves. In young leaves, LjASN3 was the only ASN gene expressed although at low levels, while all the three genes encoding for NSE were highly expressed, especially LjNSE1. In nodules, LjASN2 and LjNSE2 were the most highly expressed genes, suggesting an important role for these genes in this organ. Several lines of evidence support the connection between asparagine metabolic genes and photorespiration in L. japonicus: a) a mutant plant deficient in LjNSE1 showed a dramatic decrease in the expression of the two genes encoding for SGAT; b) expression of the genes involved in asparagine metabolism is altered in a photorespiratory mutant lacking plastidic glutamine synthetase; c) a clustering analysis indicated a similar pattern of expression among several genes involved in photorespiratory and asparagine metabolism, indicating a clear link between LjASN1 and LjSGAT genes and photorespiration.

Conclusions: The results obtained in this paper indicate the existence of a differential expression of asparagine metabolic genes in L. japonicus and point out the crucial relevance of particular genes in different organs. Moreover, the data presented establish clear links between asparagine and photorespiratory metabolic genes in this plant.

Keywords: Asparaginase genes; Asparagine synthetase genes; Lotus japonicus; Serine-glyoxylate aminotransferase genes.


Conflict of interest statement

Ethics approval and consent to participate

L. japonicus (Regel) Larsen cv. Gifu was initially obtained from Prof. Jens Stougaard (University of Aarhus, Denmark) and then self-propagated at the University of Seville. The L. japonicus Ljgln2–2 mutant used in this work was previously isolated from a mutant screening by Orea et al. [32]. The L. japonicus LjNSE1 mutant seeds were identified by Credali et al. [15] using a TILLING platform (Targeted Induced Local Lesions IN Genomes) developed at the John Innes Centre (Norwich, UK). No endangered plant species were used in this work.

Consent for publication

Not applicable.

Competing interests

The authors declare that they have no competing interests.

Publisher’s Note

Springer Nature remains neutral with regard to jurisdictional claims in published maps and institutional affiliations.

Figures

Fig. 1
Fig. 1
qRT-PCR analysis of LjASN genes expression in different tissues of L. japonicus . Plants were grown for 6 weeks and irrigated with Hornum medium containing NH4NO3 (a, c, e), or inoculated with M. loti and irrigated with Hornum medium without nitrogen (b, d, f). The samples were harvested at 4 h after the beginning of the light or dark period for the quantification of transcripts. Transcript levels are reported as relative units (r.u.). Data are the mean ± SE of three independent biological replicates
Fig. 2
Fig. 2
qRT-PCR analysis of LjNSE genes expression in different tissues of L. japonicus. Plants were grown for 6 weeks and irrigated with Hornum medium containing NH4NO3 (a, c, e), or inoculated with M. loti and irrigated with Hornum medium without nitrogen (b, d, f). The samples were harvested at 4 h after the beginning of the light or dark period for the quantification of transcripts. Transcript levels are reported as relative units (r.u.). Data are the mean ± SE of three independent biological replicates
Fig. 3
Fig. 3
qRT-PCR analysis of LjSGAT genes expression in different tissues of L. japonicus. Plants were grown for 6 weeks and irrigated with Hornum medium (a, c), containing NH4NO3 or inoculated with M. loti and irrigated with Hornum medium without nitrogen (b, d). The samples were harvested at 4 h after the beginning of the light or dark period for the quantification of transcripts. Transcript levels are reported as relative units (r.u.). Data are the mean ± SE of three independent biological replicates
Fig. 4
Fig. 4
qRT-PCR analysis of LjSGAT genes expression in leaves of WT and Ljnse1–4 mutant plants. L. japonicus plants were grown for 6 weeks under normal air conditions. Leaves were harvested at 4 h after the beginning of the light period. Transcript levels are reported as relative units (r.u.). Data are the mean ± SE of three independent biological replicates. * indicates significant differences between WT and Ljnse1–4 mutant plants as determined by Student’s test (P < 0.05)
Fig. 5
Fig. 5
qRT-PCR analysis of LjASN genes expression in leaves of WT and Ljgln2–2 mutant plants. L. japonicus plants grown for 35 days in high CO2 (time zero) were transferred to normal CO2 conditions for the indicated periods of time. Leaves were harvested at the indicated time points. Transcript levels are reported as relative units (r.u.). Data are the mean ± SE of three independent biological replicates. * indicates significant differences between WT and Ljgln2–2 mutant plants; a, b indicate significant differences between CO2 and air conditions at the indicated time points for WT plants; A, B indicate significant differences between CO2 and air conditions at the indicated time points for Ljgln2–2 plants as determined by Student’s test (P < 0.05)
Fig. 6
Fig. 6
qRT-PCR analysis of LjNSE genes expression in leaves of WT and Ljgln2–2 mutant plants. L. japonicus plants grown for 35 days in high CO2 (time zero) were transferred to normal CO2 conditions for the indicated periods of time. Leaves were harvested at the indicated time points. Transcript levels are reported as relative units (r.u.). Data are the mean ± SE of three independent biological replicates. * indicates significant differences between WT and Ljgln2–2 mutant plants; a, b, c: indicate significant differences between CO2 and air conditions at the indicated time points for WT plants; A, B: indicate significant differences between CO2 and air conditions at the indicated time points for Ljgln2–2 plants as determined by Student’s test (P < 0.05)
Fig. 7
Fig. 7
qRT-PCR analysis of LjSGAT genes expression in leaves of WT and Ljgln2–2 mutant plants. L. japonicus plants grown for 35 days in high CO2 (time zero) were transferred to normal CO2 conditions for the indicated periods of time. Leaves were harvested at the indicated time points. Transcript levels are reported as relative units (r.u.). Data are the mean ± SE of three independent biological replicates. * indicates significant differences between WT and Ljgln2–2 mutant plants; a, b: indicate significant differences between CO2 and air conditions at the indicated time points for WT plants; A, B: indicate significant differences between CO2 and air conditions at the indicated time points for Ljgln2–2 plants as determined by Student’s test (P < 0.05)
Fig. 8
Fig. 8
Hierarchical clustering analysis of quantitative RT-PCR data for photorespiratory and nitrogen metabolism genes. Transcript levels were determined at the indicated time periods after the transfer of WT and Ljgln2–2 mutant plants from CO2-enriched (time zero) to normal CO2 conditions. Relative transcript levels of WT plants under CO2-enriched atmosphere were taken as 1. Data are presented as the log2 of the difference of transcript levels between WT and Ljgln2–2. The genes considered and their corresponding accession numbers according to the Kazusa database are: asparagine synthetase (LjASN1, Lj2g3v2291670.1; LjASN2, Lj0g3v0295349.1; LjASN3, Lj0g3v0361789.1); asparaginase (LjNSE1, Lj5g3v0296030.1; LjNSE2, Lj4g3v1736160.1; LjNSE3, Lj0g3v0303539.1); serine hydroxymethyltransferase (LjSHMT1, Lj2g3v1467880.1); ferredoxin-dependent GOGAT (LjGLU1, Lj1g3v4154900.1); NADH-GOGAT (LjGLT1, LjSGA_035611.1*; LjGLT2, LjSGA_037992.1*); serine:glyoxylate aminotransferase (LjSGAT1, Lj6g3v0937010.1; LjSGAT2, Lj2g3v3058530.1); plastidic glutamine synthetase (LjGLN2, Lj6g3v1887800.1); cytosolic glutamine synthetase (LjGLN1.1, Lj2g3v0658180.1; LjGLN1.2, Lj6g3v0410490.1; LjGLN1.3, Lj0g3v0335159.1; LjGLN1.4, LjSGA_058827.1*; LjGLN1.5, LjSGA_019428.1*); glutamate dehydrogenase (LjGDH1, Lj1g3v3975110.1; LjGDH2, Lj4g3v1212370.1; LjGDH3, Lj2g3v1988990.1; LjGDH4, Lj0g3v0102829.1); hydroxypyruvate reductase (LjHPR, Lj5g3v2242500.1); glycine decarboxylase (LjGDC-H1, Lj4g3v0654460.1; LjGDC-P1, chr5.CM0019.20.r2.m*; LjGDC-P2, chr5.LjT34K16.170.r2.m*; LjGDC-T, Lj6g3v1849480.1); glycerate kinase (LjGlyK2, Lj3g3v2247080.1); glycolate oxidase (LjGO2, Lj3g3v1048900.2); plastidic dicarboxylate transporter (LjDiT1, chr5.CM0089.610.r2.d*; LjDiT2.1, Lj6g3v2204740.1) and phosphoglycolate phosphatase (LjPglP1, Lj1g3v2842370.1; LjPglP2, Lj6g3v1708420.1). The gene accession numbers are reported according to the version 3.0 of the L. japonicus genome in the Kazusa database, except in the cases indicated with an asterisk where the version 2.5 of the genome was used
Fig. 9
Fig. 9
Clustering analysis of transcript levels of asparagine metabolism genes and photorespiratory and N metabolism genes. The clustering analysis was carried out with the Expander software using complete linkage. The mean of the expression level of each gene in all the samples analyzed was calculated and transformed in a log2 before clustering analysis. In the color panels, each vertical line represents a single gene, and the color of the line indicates the expression level (in a log scale) of the gene relative to a specific sample: high expression in red, low expression in green. The photorespiratory genes and genes of nitrogen metabolism present in the clustering image are: asparagine synthetase (LjASN1, LjASN2 and LjASN3); asparaginase (LjNSE1 and LjNSE3); nitrate reductase (LjNR, Lj0g3v0006719.1); nitrite reductase (LjNiR, Lj4g3v0588830.1); serine hydroxymethyltransferase (LjSHM1); ferredoxin-dependent glutamate synthase (LjGLU1); NADH-dependent glutamate synthase (LjGLT1 and LjGLT2); serine:glyoxylate aminotransferase (LjSGAT1 and LjSGAT2); plastidic glutamine synthetase (LjGLN2); cytosolic glutamine synthetase (LjGLN1.1, LjGLN1.2, LjGLN1.3 and LjGLN1.5) glutamate dehydrogenase (LjGDH1, LjGDH2, LjGDH3 and LjGDH4); hydroxypyruvate reductase (LjHPR); glycine decarboxylase (LjGDC-H1, LjGDC-P1, LjGDC-P2 and LjGDC-T); glycerate kinase (LjGlyK2); glycolate oxidase (LjGO2); plastidic dicarboxylate transporter (LjDiT1 and LjDiT2.1) and phosphoglycolate phosphatase (LjPglP1 and LjPglP2). The accession numbers of the genes mentioned previously (Fig. 8) can be found in the corresponding figure legend
Fig. 10
Fig. 10
Differential expression of the different genes encoding for LjASN, LjNSE and LjSGAT in L. japonicus . The size of the lettering reflects the relative abundance of the different genes analyzed in the paper. Genes mentioned in this figure are the key genes for the following biochemical pathways: LjASN, asparagine biosynthesis; LjNSE, asparagine degradation; LjSGAT, photorespiration/transamination

References

    1. do Amarante L, Lima JD, Sodek L. Growth and stress conditions cause similar changes in xylem amino acids for different legume species. Environ Exp Bot. 2006;58(1–3):123–129. doi: 10.1016/j.envexpbot.2005.07.002. - DOI
    1. Waterhouse RN, Smyth AJ, Massonneau A, Prosser IM, Clarkson DT. Molecular cloning and characterisation of asparagine synthetase from Lotus japonicus: dynamics of asparagine synthesis in N-sufficient conditions. Plant Mol Biol. 1996;30(5):883–897. doi: 10.1007/BF00020801. - DOI - PubMed
    1. Gaufichon L, Reisdorf-Cren M, Rothstein SJ, Chardon F, Suzuki A. Biological functions of asparagine synthetase in plants. Plant Sci. 2010;179(3):141–153. doi: 10.1016/j.plantsci.2010.04.010. - DOI
    1. Duff SMG. Asparagine synthetase. In: Mello JPF, editor. Amino acids in higher plants. CAB international. 2015. pp. 100–128.
    1. Lam HM, Hsieh MH, Coruzzi G. Reciprocal regulation of distinct asparagine synthetase genes by light and metabolites in Arabidopsis thaliana. Plant J. 1998;16(3):345–353. doi: 10.1046/j.1365-313x.1998.00302.x. - DOI - PubMed

LinkOut - more resources