. 2018 Jan;103(1):126-135.
doi: 10.3324/haematol.2017.177279. Epub 2017 Oct 12.

Histone deacetylase inhibitors downregulate CCR4 expression and decrease mogamulizumab efficacy in CCR4-positive mature T-cell lymphomas

Affiliations

Histone deacetylase inhibitors downregulate CCR4 expression and decrease mogamulizumab efficacy in CCR4-positive mature T-cell lymphomas

Akihiro Kitadate et al. Haematologica. 2018 Jan.

Abstract

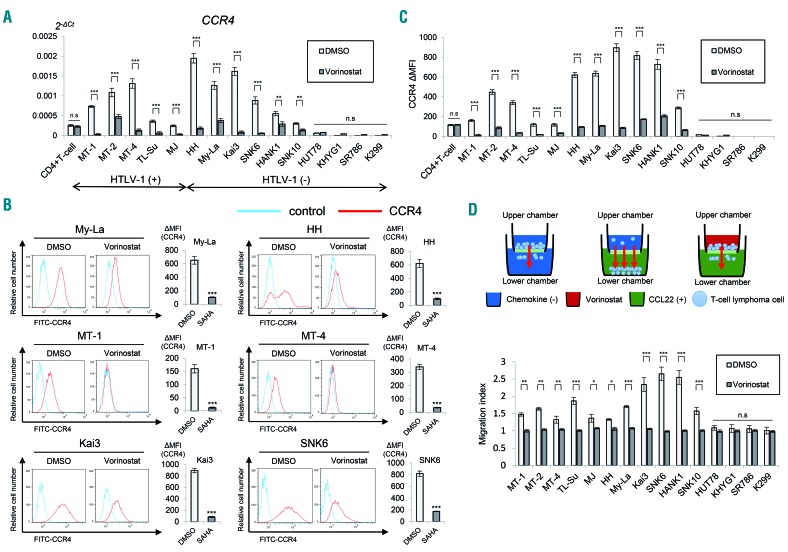
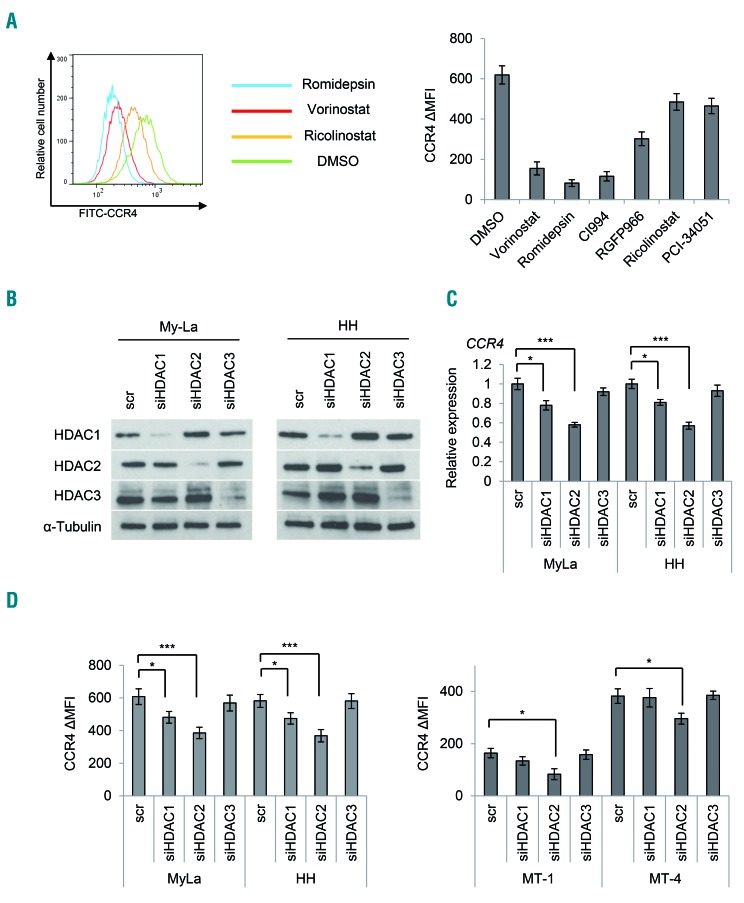
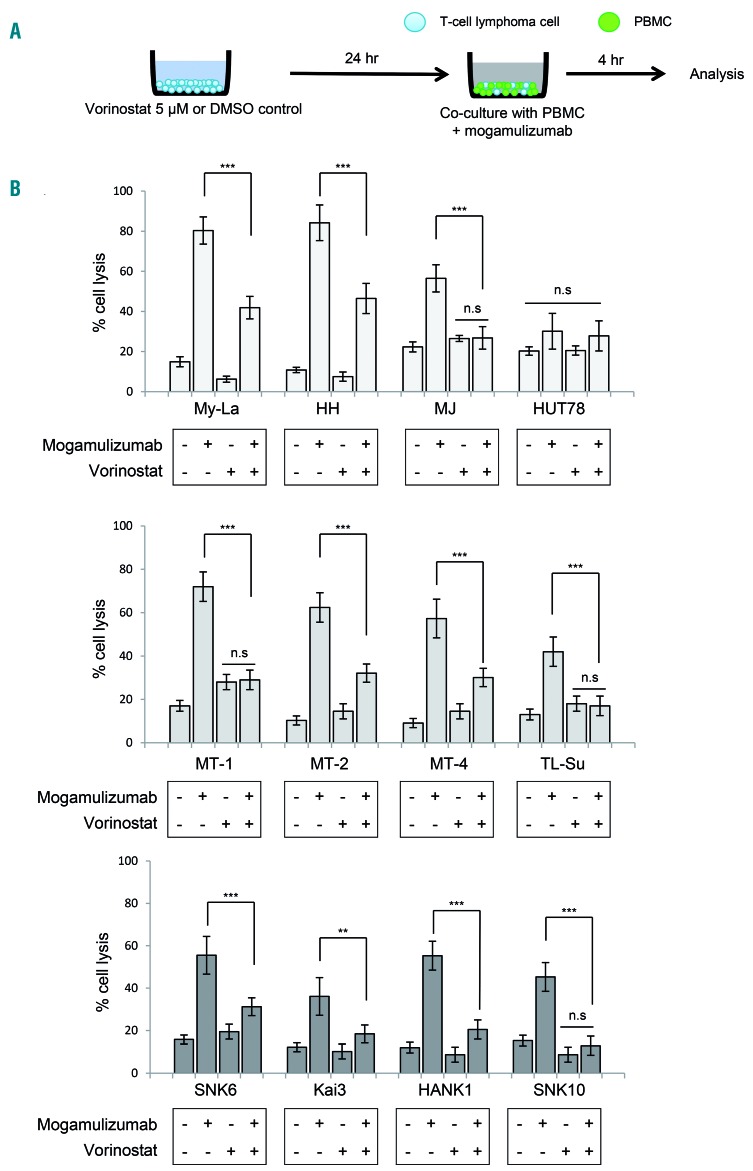
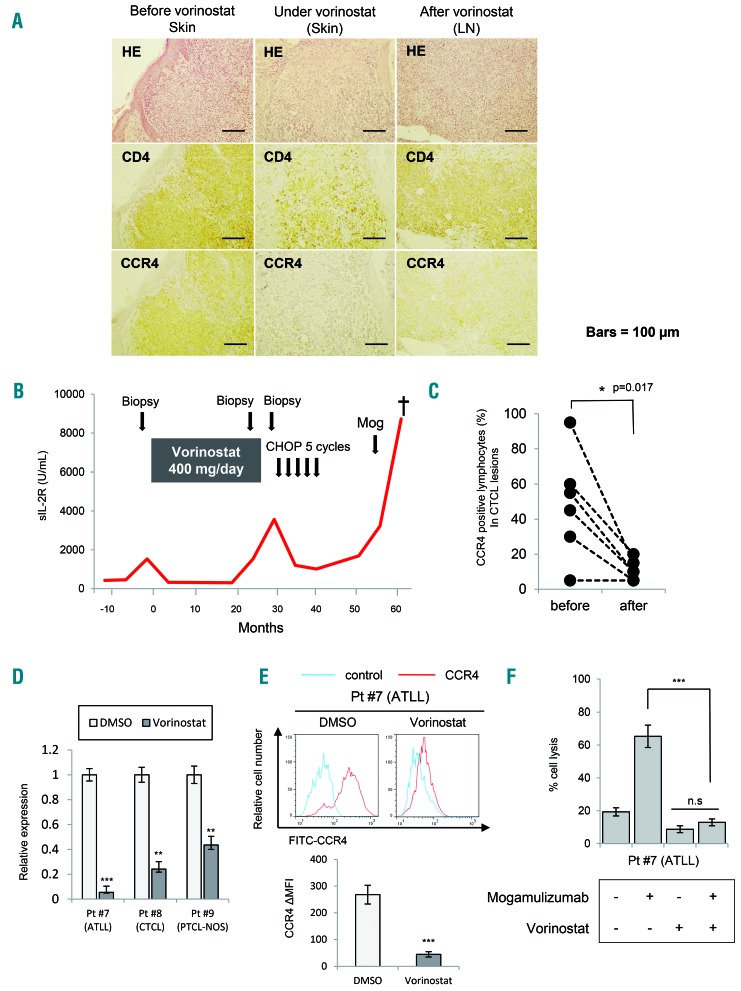
Histone deacetylase inhibitors are promising agents for various T-cell lymphomas, including cutaneous T-cell lymphoma, peripheral T-cell lymphoma, and adult T-cell lymphoma/leukemia. CCR4 is an important therapeutic target molecule because mogamulizumab, an anti-CCR4 antibody, has shown promising efficacy against various T-cell lymphomas. In this study, we examined the in vitro synergistic effects of mogamulizumab and histone deacetylase inhibitors against various T-cell lymphomas. First, we examined the expression of CCR4 mRNA and surface CCR4 in various T-cell lymphoma cell lines and found that it was downregulated upon treatment with vorinostat, a pan-histone deacetylase inhibitor. Next, we used isoform-specific histone deacetylase inhibitors and short-interfering RNA to determine the histone deacetylase isoform involved in the regulation of CCR4, and demonstrated that romidepsin, a class I selective histone deacetylase inhibitor, reduced CCR4 most efficiently. Moreover, among class I histone deacetylases, histone deacetylase 2 knockdown led to a reduction of CCR4 in lymphoma cells, suggesting that CCR4 expression is mainly regulated by histone deacetylase 2. When we examined the CCR4 expression in skin samples from primary cutaneous T-cell lymphoma, obtained from the same patients before and after vorinostat treatment, we found that CCR4 expression was greatly reduced after treatment. Finally, when we conducted an antibody-dependent cell-mediated cytotoxicity assay with mogamulizumab by using various lymphoma cells, we found that the efficacy of mogamulizumab was significantly reduced by pretreatment with vorinostat. Altogether, our results suggest that the primary use of histone deacetylase inhibitors before treatment with mogamulizumab might not be suitable to obtain synergistic effects. Moreover, these results have potential implications for optimal therapeutic sequences in various CCR4-positive T-cell lymphomas.


Figures

Figure 1.
Figure 1.
The pan-histone deacetylase inhibitor, vorinostat reduces CCR4 expression in various T-cell and natural killer-cell lymphoma cell lines. Bars indicate the mean ± standard error of the mean (SEM) of three independent experiments. Asterisks (*) indicate statistical significance: *0.01 ≤ P < 0.05, **0.001 ≤ P < 0.01, ***P < 0.001, n.s: not siginificant. (A) Quantitative RT-PCR analysis of CCR4 in vorinostat-treated T- and NK-cell lymphoma cell lines (5 μM for 24 h). The Student t-test was used to examine statistical significance. x-axis: cell lines. y-axis: 2−ΔCt values for microRNA expression. (B) Flow cytometry analysis of CCR4 in indicated T- and NK-cell lymphoma cells treated with vorinostat. Cells were stained with CCR4-FITC 24 h after vorinostat treatment (5 μM). Representative flow cytometry histograms are shown. ΔMFI (mean fluorescence intensity) values were obtained after subtraction of the isotype control, MFI from CCR4 MFI. SAHA: suberoylanilide hydroxamic acid. (C) ΔMFI of CCR4 in vorinostat-treated T- and NK-cell lymphoma cell lines (5 μM for 24 h). x-axis: cell lines. y-axis: ΔMFI of CCR4 in dimethylsulfoxide (DMSO) or vorinostat-treated T- and NK-cell lymphoma cell lines. (D) Migration assay of lymphoma cells treated with 5 μM vorinostat for 24 h. A schematic illustration of the migration assay is also shown. RFU: relative fluorescence units.
Figure 2.
Figure 2.
Effect of isoform-specific histone deacetylase inhibitors and histone deacetylase knockdown on CCR4 expression. Bars indicate the mean ± standard error of the mean (SEM) of three independent experiments. Asterisks (*) indicate statistical significance: *0.01 ≤ P < 0.05, ***P < 0.001. (A) Flow cytometry analysis of CCR4 in CTCL cells (My-La) treated with various HDAC inhibitors. Cells were stained with CCR4-FITC 24 h after treatment (5 μM vorinostat, 10 nM romidepsin, 50 μM CI994, 20 μM RGFP966, 10 μM ricolinostat, and 75 μM PCI-34051). Left panel: representative flow cytometry histograms are shown. Right panel: ΔMFI of CCR4 in My-La cells treated with HDAC inhibitors. (B) Transient knockdown of HDAC (HDAC1, HDAC2, and HDAC3) in CTCL (My-La and HH) cells. Western blot analysis of HDAC1, HDAC2, and HDAC3 in cells after transient transduction of siHDAC or a scrambled control (scr). Tubulin: protein positive control. (C) Quantitative RT-PCR analysis of CCR4 after transient transfection of siHDAC and a scr in CTCL cells. x-axis: cell lines; y-axis: expression relative to control cells that were assigned a value of 1.0. (D) ΔMFI of CCR4 after transient transfection of siHDAC and scr in CTCL (My-La and HH) and ATLL (MT-1 and MT- 4) cells. x-axis: cell lines; y-axis: ΔMFI of CCR4. MFI: mean fluorescence intensity.
Figure 3.
Figure 3.
Pretreatment of vorinostat significantly decreases mogamulizumab-induced antibody-dependent cell-mediated cytotoxicity. Bars indicate the mean ± standard error of the mean (SEM) of three independent experiments. Asterisks (*) indicate statistical significance: **0.001 ≤ P < 0.01, ***P < 0.001, n.s: not siginificant. (A) A schematic illustration of the ADCC assay is shown. Cells were treated with 5 μM vorinostat for 24 h or dimethylsulfoxide (DMSO) as a control before mogamulizumab treatment. Cytotoxicity was measured using the lactate dehydrogenase assay in the presence of effector cells (peripheral blood mononuclear cells. PBMC) obtained from healthy volunteers and mogamulizumab (10 mg/mL) or the same volume of solvent (control). The ratio of target:effector cells was fixed at 1:50. (B) The ADCC assay against CTCL (upper panel: MyLa, HH, MJ, and HUT78), ATLL (middle panel: MT-1, MT-2, MT-4, and TL-Su), and NK/T-cell lymphoma (lower panel: SNK6, Kai3, HANK1, and SNK10) cell lines. x-axis: cell lines; y-axis: percent cell lysis.
Figure 4.
Figure 4.
CCR4 expression of clinical lymphoma samples before and after vorinostat treatment. Bars indicate the mean ± standard error of the mean (SEM) of three independent experiments. Asterisks (*) indicate statistical significance: *0.01 ≤ P < 0.05, **0.001 ≤ P < 0.01, ***P < 0.001, n.s: not siginificant. (A) CCR4 expression determined by immunohistochemical staining before and after vorinostat treatment. Representative results from samples (skin and lymph nodes) from patient with mycosis fungoides (MF) are shown. Specimens were stained with hematoxylin and eosin (HE), CD4, and CCR4 for a pathological diagnosis and confirmation: 200× magnification. LN: lymph node. (B) Clinical time course in patient (Pt) #1 with MF before and after vorinostat treatment. (C) CCR4-positive lymphocytes (% of total infiltrating lymphocytes) in specimens from six patients (Pt #1 – 6) before and after vorinostat treatment. The Student t-test was used to examine statistical significance. (D) Quantitative RT-PCR analysis of CCR4 in samples of primary T-cell lymphomas (ATLL, CTCL, and PTCL-NOS) (Pt #7 – 9) exposed to 5 μM vorinostat for 24 h. (E) ΔMFI of CCR4 in a sample of primary ATLL (Pt #7) treated with 5 μM vorinostat for 24 h. (F) ADCC assay against a sample of primary ATLL. Cells were treated with 5 μM vorinostat for 24 h or control cells treated with dimethylsulfoxide (DMSO) before mogamulizumab treatment. Cytotoxicity was measured using the lactate dehydrogenase assay in peripheral blood mononuclear cells obtained from healthy volunteers and mogamulizumab (10 mg/mL) or the same volume of solvent (control). The ratio of target: effector cells was fixed at 1:50.

Similar articles

Cited by

References

    1. WHO Classification of Tumours of Haematopoietic and Lymphoid tissues 2008. 4th ed. Lyon, France: International Agency for Research on Cancer (IARC).
    1. Swerdlow SH, Campo E, Pileri SA, et al. The 2016 revision of the World Health Organization classification of lymphoid neoplasms. Blood. 2016;127(20):2375–2390. - PMC - PubMed
    1. O’Leary HM, Savage KJ. Update on the World Health Organization classification of peripheral T-cell lymphomas. Curr Hematol Malig Rep. 2009;4(4): 227–235. - PubMed
    1. Savage KJ. Therapies for peripheral T-cell lymphomas. Hematology Am Soc Hematol Educ Program. 2011;2011:515–524. - PubMed
    1. Vose J, Armitage J, Weisenburger D. International peripheral T-cell and natural killer/T-cell lymphoma study: pathology findings and clinical outcomes. J Clin Oncol. 2008;26(25):4124–4130. - PubMed

Publication types

MeSH terms

LinkOut - more resources