. 2017 Nov 17;358(6365):941-946.
doi: 10.1126/science.aam9305. Epub 2017 Oct 12.

Metabolic recycling of ammonia via glutamate dehydrogenase supports breast cancer biomass

Affiliations

Metabolic recycling of ammonia via glutamate dehydrogenase supports breast cancer biomass

Jessica B Spinelli et al. Science. .

Abstract

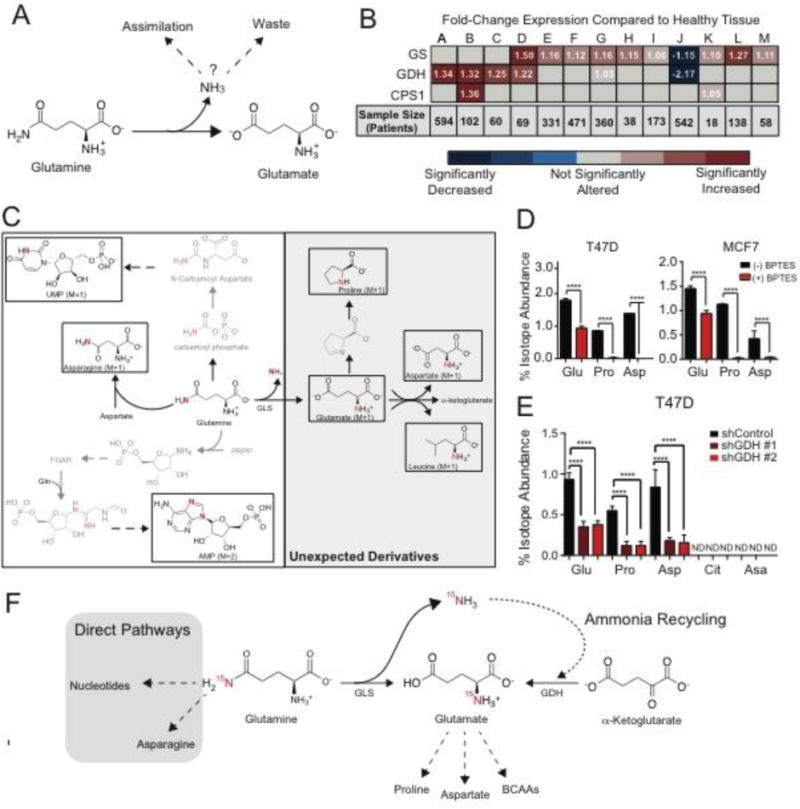
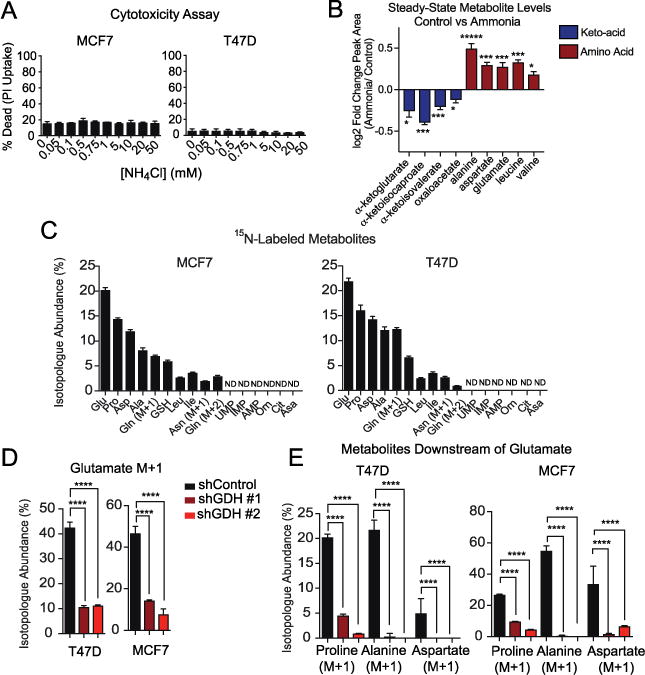
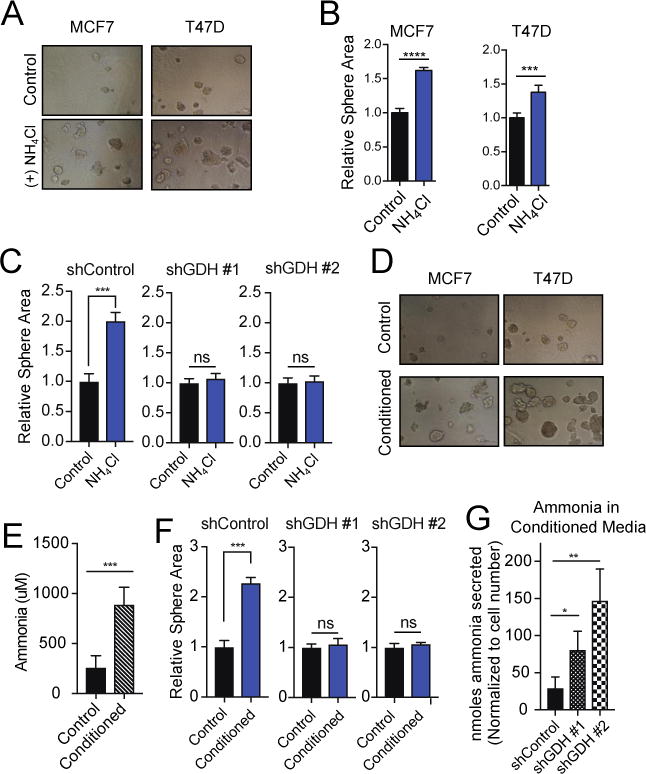
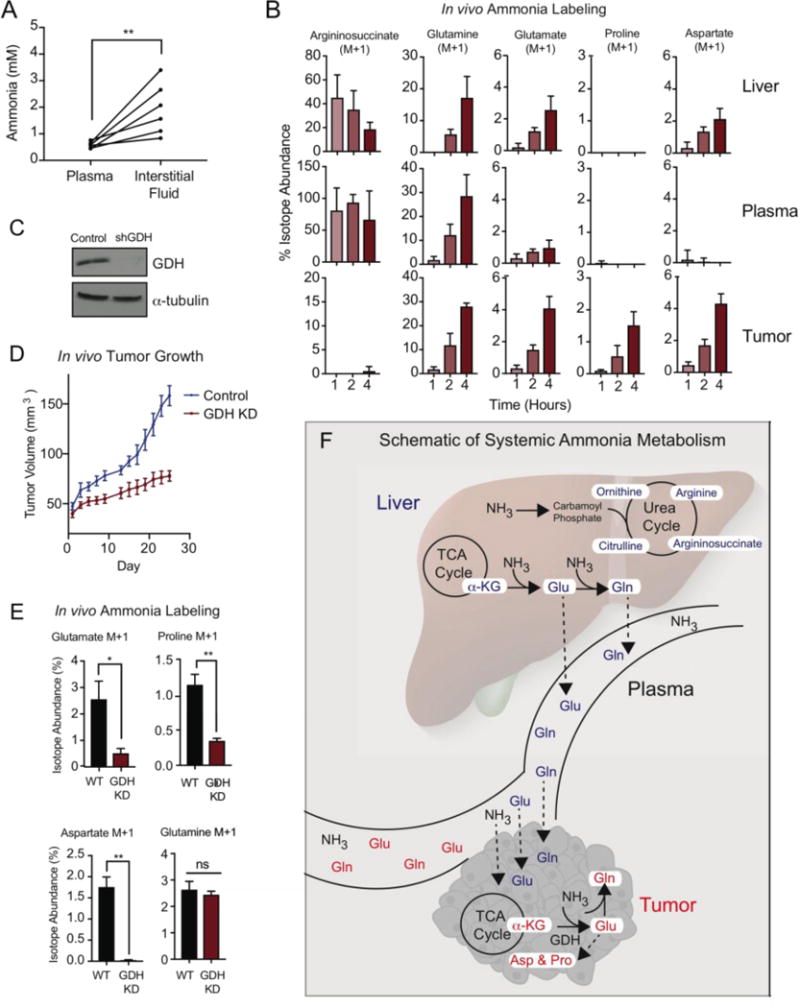
Ammonia is a ubiquitous by-product of cellular metabolism; however, the biological consequences of ammonia production are not fully understood, especially in cancer. We found that ammonia is not merely a toxic waste product but is recycled into central amino acid metabolism to maximize nitrogen utilization. In our experiments, human breast cancer cells primarily assimilated ammonia through reductive amination catalyzed by glutamate dehydrogenase (GDH); secondary reactions enabled other amino acids, such as proline and aspartate, to directly acquire this nitrogen. Metabolic recycling of ammonia accelerated proliferation of breast cancer. In mice, ammonia accumulated in the tumor microenvironment and was used directly to generate amino acids through GDH activity. These data show that ammonia is not only a secreted waste product but also a fundamental nitrogen source that can support tumor biomass.


Figures

Figure 1
Figure 1. Glutamine-Derived ammonia is recycled
A. Schematic of fates of ammonia in cancer. B. mRNA expression of ammonia-assimilating enzymes from The Cancer Genome Atlas in cancer compared to its normal tissue. Fold-change (cancer/normal) for GS (Glutamine Synthetase), GDH1 (Glutamate Dehydrogenase), and CPS1 (Carbamoyl Phosphate Synthetase 1) RNA levels were assessed using Oncomine.org. Values are the mean of fold change (cancer/normal) measured across the number of patients listed. (A) Ovarian Serous Cystadenocarcinoma, (B) Colon Adenocarcinoma, (C) Rectal Adenocarcinoma, (D) Lobular & Ductal Breast Carcinoma, (E) Lung Adenocarcinoma, (F) Squamous Lung Cell Carcinoma, (G) Endometrial Adenocarcinoma, (H) Bladder Urothelial Carcinoma, (I) Gastric Adenocarcinoma, (J) Glioblastoma, (K) Pancreatic Adenocarcinoma, (L) Hepatocellular Carcinoma, (M) Cutaneous Melanoma. C. Schematic of 15N-isotopologues after treatment with 15N-(amide)glutamine. D. Isotopologue abundance of unexpected 15N-(amide)glutamine derivatives +/− 1 uM BPTES in T47D and MCF7 cell lines. Values represent mean +/− SEM, n=4 per condition. E. Isotope abundance of 15N-(amide)glutamine-derived metabolites in control cells and cells depleted of GDH (shGDH#1 & shGHD#2). ND= 15N-Isotopologue not detected. Glu = Glutamate M+1, Pro = Proline M+1, Asp = Aspartate M+1, Cit = Citrulline M+1, Asa = Argininosuccinate M+1. Values represent mean +/− SEM, n=4 per condition. F. Schematic of ammonia recycling. For all comparisons two-tailed t test was used. *P < 0.05, **P < 0.01, ***P<0.001, ****P<0.0001.
Figure 2
Figure 2. Ammonia is assimilated by GDH to generate amino acids
A. Propidium Iodide (PI) staining of cells treated with a dose of NH4Cl for 48 hours. Values represent mean +/− SEM, n=3. Representative experiment of three replicates. B. Heat map of fold-change in steady-state abundance of keto- and amino acids involved in transaminase reactions in T47D cells treated with 0.75 mM NH4Cl. Values represent mean +/− SEM, n=4. Representative experiment of two replicates. C. Abundance of 15N-isotopologues in MCF7 and T47D cells after 8 hours of treatment with 0.75 mM 15NH4Cl. (M+1) indicates a single nitrogen labeled and (M+2) indicates two nitrogen labeled. Values are scaled to account for total intracellular ammonia and represent mean +/− SEM, n=4. D. Isotopologue abundance of glutamate (M+1) in MCF7 and T47D cells treated for 8 hours with 0.75 mM 15NH4Cl in control and GDH-depleted cells. Values are scaled to account for total intracellular ammonia and represent mean +/− SEM, n=4. E. Abundance of 15N-isotopologues for metabolites downstream of glutamate treated for 8 hours with 0.75 mM 15NH4Cl in control and GDH depleted cells. Values are scaled to account for total intracellular ammonia and represent mean +/− SEM, n=4. For all comparisons two-tailed t test was used. *P < 0.05, **P < 0.01, ***P<0.001, ****P<0.0001.
Figure 3
Figure 3. Ammonia stimulates breast cancer growth and proliferation
A. Representative images of 3D culture models of MCF7 and T47D cells treated with 0.5 mM NH4Cl compared to control conditions. B. Quantification of average sphere area of 100–200 spheres per well in 3D culture models of MCF7 and T47D cells treated with ammonia and control conditions for 7 days. Values represent mean area +/− SEM, n=4. Representative experiment of five replicates. C. Quantification of average sphere area of 200–250 spheres per well in 3D culture models of MCF7 cells harboring stable shRNA-mediated knockdown of GDH or control hairpin. Cells were treated for 8 days. Values represent mean area +/− SEM, n=4. Representative experiment of three replicates. D. Representative images of MCF7 and T47D cells in control conditions (daily media change) and conditioned media (media changed every 72 hours). Cells were treated for 8 days. E. Ammonia measurement in conditioned media compared to control after 8 days. F. Quantification of average sphere area of 200–250 spheres per well in 3D culture models of MCF7 control cells or cells depleted of GDH. Cells were treated in control or conditioned media for 8 days. Values represent mean area +/− SEM, n=4. Representative experiment of three replicates. G. Nmoles ammonia secreted per cell after 72 hours in control cells or cells depleted of GDH. Values represent mean +/− SEM, n=3. For all comparisons two-tailed t test was used. *P < 0.05, **P < 0.01, ***P<0.001, ****P<0.0001.
Figure 4
Figure 4. Contributions of systemic and tumor autonomous ammonia metabolism to amino acid synthesis
A. Measurement of ammonia in the interstitial fluids of the tumor microenvironment (TME) compared to plasma isolated from ER(+) breast cancer xenograft models. Lines connect values of ammonia in the plasma to that in the interstitial fluid of the TME. B. Isotope abundance of 15N-isotopologues isolated from the liver, plasma and tumor of mice IP injected with a bolus (9.0 mmol/kg) of 15NH4Cl. Tissues were harvested 1, 2, or 4 hours after injection. Values represent mean +/− SEM, n=4. 15N-isotopologues were corrected for natural abundance of tissues harvested from a control mouse treated with 9.0 mmol/kg NH4Cl for 4 hours. C. Western blot of GDH knockdown in T47D xenograft tumors. D. In vivo tumor growth of T47D control and GDH-depleted xenograft models (n=15 mice per group). Values represent mean tumor volume +/− SEM. E. In vivo tracing of 15NH4Cl in T47D control and GDH-depleted xenograft models. Values represent mean isotopologue abundance +/− SEM, n=4. F. Schematic of systemic and tumor autonomous ammonia metabolism. For all comparisons two-tailed t test was used. *P < 0.05, **P < 0.01, ***P<0.001, ****P<0.0001.

Comment in

References

    1. Pavlova NN, Thompson CB. The Emerging Hallmarks of Cancer Metabolism. Cell metabolism. 2016;23:27–47. - PMC - PubMed
    1. Vyas S, Zaganjor E, Haigis MC. Mitochondria and Cancer. Cell. 2016;166:555–566. - PMC - PubMed
    1. Coloff JL, et al. Differential Glutamate Metabolism in Proliferating and Quiescent Mammary Epithelial Cells. Cell metabolism. 2016;23:867–880. - PubMed
    1. Vander Heiden MG, Cantley LC, Thompson CB. Understanding the Warburg effect: the metabolic requirements of cell proliferation. Science. 2009;324:1029–1033. - PMC - PubMed
    1. Eng CH, Yu K, Lucas J, White E, Abraham RT. Ammonia derived from glutaminolysis is a diffusible regulator of autophagy. Science signaling. 2010;3:ra31. - PubMed

Publication types