. 2017 Oct 12;7(1):13079.
doi: 10.1038/s41598-017-12960-w.

Electropermeabilization of Inner and Outer Cell Membranes with Microsecond Pulsed Electric Fields: Quantitative Study with Calcium Ions

Affiliations

Electropermeabilization of Inner and Outer Cell Membranes with Microsecond Pulsed Electric Fields: Quantitative Study with Calcium Ions

Hanna Hanna et al. Sci Rep. .

Abstract

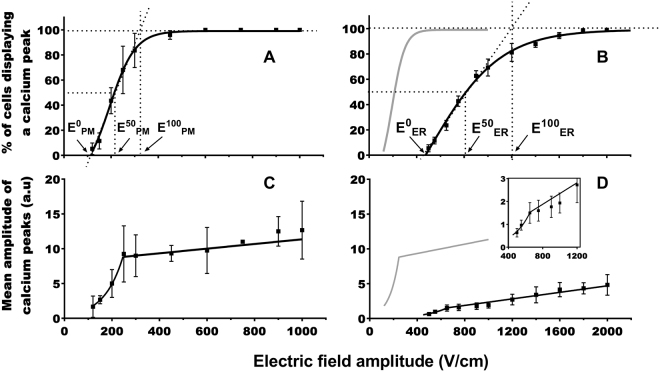
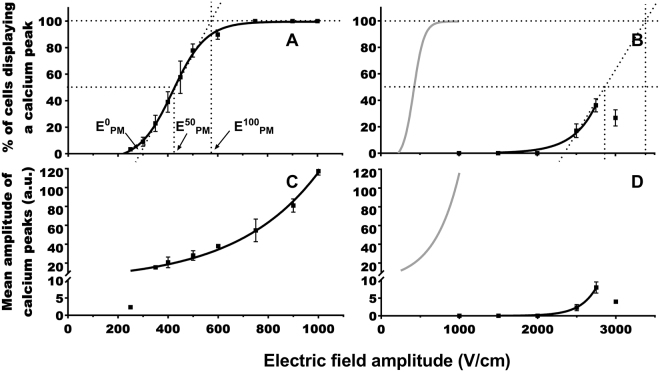
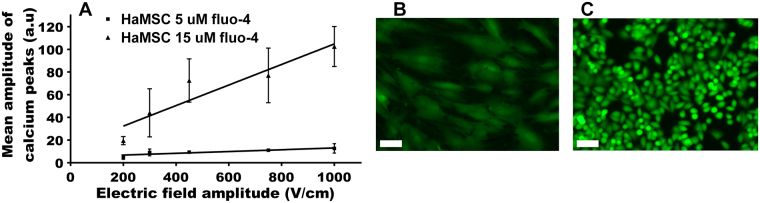
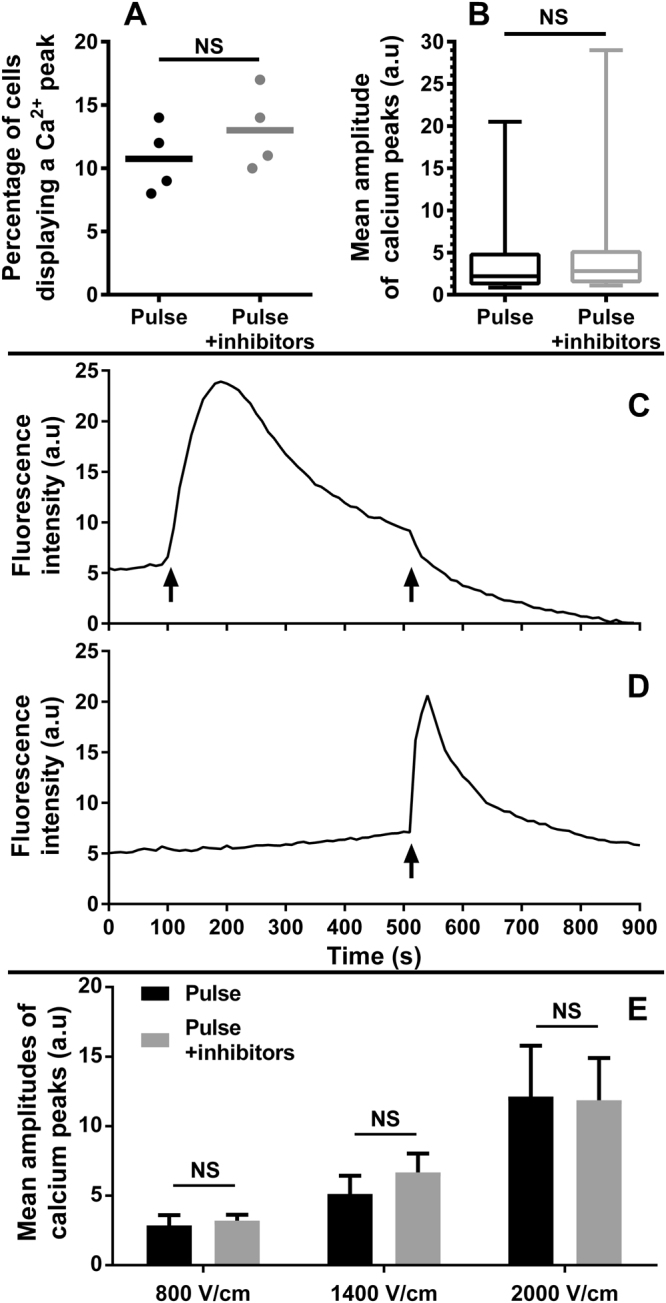
Microsecond pulsed electric fields (μsPEF) permeabilize the plasma membrane (PM) and are widely used in research, medicine and biotechnology. For internal membranes permeabilization, nanosecond pulsed electric fields (nsPEF) are applied but this technology is complex to use. Here we report that the endoplasmic reticulum (ER) membrane can also be electropermeabilized by one 100 µs pulse without affecting the cell viability. Indeed, using Ca2+ as a permeabilization marker, we observed cytosolic Ca2+ peaks in two different cell types after one 100 µs pulse in a medium without Ca2+. Thapsigargin abolished these Ca2+ peaks demonstrating that the calcium is released from the ER. Moreover, IP3R and RyR inhibitors did not modify these peaks showing that they are due to the electropermeabilization of the ER membrane and not to ER Ca2+ channels activation. Finally, the comparison of the two cell types suggests that the PM and the ER permeabilization thresholds are affected by the sizes of the cell and the ER. In conclusion, this study demonstrates that µsPEF, which are easier to control than nsPEF, can permeabilize internal membranes. Besides, μsPEF interaction with either the PM or ER, can be an efficient tool to modulate the cytosolic calcium concentration and study Ca2+ roles in cell physiology.


Conflict of interest statement

The authors declare that they have no competing interests.

Figures

Figure 1
Figure 1
Response of the haMSC exposed to one pulse of 100 μs in DMEM (panels A and C) or in SMEM-EGTA (panels B and D). (A,B) Percentage of cells displaying calcium peaks. (C and D): Mean amplitude of the calcium peaks. E0, E50, and E100 are the values of the electric field amplitudes needed to respectively start to permeabilize the cells, and for the permeabilization of 50% and 100% of the cells. The gray curves in (B,D) represent the curves (A,C), respectively. The inset in (D) represent a magnification of the transition between the fast and the slow increase of the amplitude of the calcium peaks. (n = 3 to 7 independent experiments).
Figure 2
Figure 2
Response of the DC-3F cells exposed to one pulse of 100 μs in DMEM (panels A and C) or in SMEM-EGTA (panels B and D). (A,B) Percentage of cells displaying calcium peaks. (C,D) Mean amplitude of the calcium peaks. For E0, E50, and E100, refer to Fig. 1. The gray curves in (B,D) represent the curves (A,C), respectively. (n = 3 to 5 independent experiments).
Figure 3
Figure 3
(A) Mean amplitude of the calcium peaks in haMSC after incubation of the cells in 5 or 15 µM fluo-4 AM (n = 3 independent experiments); (B,C) Calcein fluorescence in haMSC (panel B) and DC-3F (panel C) cells incubated in the presence of 5 µM calcein AM for 30 minutes at 37 °C. Scale bar 50 µm.
Figure 4
Figure 4
Origin of the calcium peaks. Cells were incubated with 10 μM of Fluo-4 AM and exposed to various inhibitors. (A,B) Response of haMSC in DMEM in the presence of VOCCs inhibitors. (A) percentage of cells presenting a Ca2+ peak (n = 4 independent experiments), the line represents the mean, p = 0.4 (Mann-Whitney test). (B) Mean amplitude of Ca2+ peaks (4 independent experiments with 39 cells for “Pulse” and 49 cells for “Pulse + inhibitors”), whiskers indicate 5th to 95th percentile range, p = 0.828 (Mann-Whitney test). Cells were exposed to one pulse of 150 V/cm (100 µs), in the presence or absence of 10 µM verapamil and 5 µM mibefradil. (C,D) Response of haMSC in SMEM-EGTA with or without thapsigargin addition. Arrow at 100 s: addition of 2 µM thapsigargin. arrows at 500 s: electric pulse of 2000 V/cm. The background fluctuations were corrected by subtracting the fluorescence of an area without cells for every time point. Graphs are representative of 3 independent experiments (E) haMSC electropulsed in a medium without calcium (SMEM-EGTA) mean amplitude of the calcium peaks in the presence or the absence of 50 µM of 2-APB, 50 µM of Dantrolene and 25 µM of Flecainide. Data are mean ± SD (n = 3 independent experiments). No significant effect of the inhibitors was observed (two-way ANOVA followed by Tukey multiple comparisons test).
Figure 5
Figure 5
Endoplasmic reticulum of the 2 cell types labelled by the protein D1ER (×63). (A,B) haMSC; (C,D) DC-3F cells. The images were taken without zooming for the haMSC and using a ×2 zoom for the DC-3F cells (Nuclei were labelled with by Hoechst 33342). (A,C) Confocal pictures. (B,D) examples of ER identification.
Figure 6
Figure 6
Cells viability after exposure to one 100 μs pulse in a medium with calcium (DMEM) or without calcium (SMEM-EGTA). (A) haMSC (n = 3 independent experiments). (B) DC-3F cells (n = 3 to 5 independent experiments in triplicates). Data are means ± SD. Statistical significance represented: p < 0.0001 (++++ and ****), p < 0.05 (+) are for comparison respectively to the DMEM and SMEM-EGTA controls (Ctrl) (two-way ANOVA followed by Dunnett’s multiple comparison test).
Figure 7
Figure 7
DC-3F cells electrofusion after one pulse in SMEM-EGTA. (A) control, (B,C) 20 min after a pulse of 2000 V/cm.

References

    1. Sale AJ, Hamilton WA. Effects of high electric fields on micro-organisms. 3. Lysis of erythrocytes and protoplasts. Biochim. Biophys. Acta. 1968;163:37–43. doi: 10.1016/0005-2736(68)90030-8. - DOI - PubMed
    1. Mir LM, Banoun H, Paoletti C. Introduction of definite amounts of nonpermeant molecules into living cells after electropermeabilization: direct access to the cytosol. Exp. Cell Res. 1988;175:15–25. doi: 10.1016/0014-4827(88)90251-0. - DOI - PubMed
    1. Neumann E, Schaefer-Ridder M, Wang Y, Hofschneider PH. Gene transfer into mouse lyoma cells by electroporation in high electric fields. EMBO J. 1982;1:841–845. - PMC - PubMed
    1. Belehradek M, et al. Electrochemotherapy, a new antitumor treatment. First clinical phase I-II trial. Cancer. 1993;72:3694–3700. doi: 10.1002/1097-0142(19931215)72:12<3694::AID-CNCR2820721222>3.0.CO;2-2. - DOI - PubMed
    1. Sersa G, Kranjc S, Scancar J, Krzan M, Cemazar M. Electrochemotherapy of mouse sarcoma tumors using electric pulse trains with repetition frequencies of 1 Hz and 5 kHz. J. Membr. Biol. 2010;236:155–162. doi: 10.1007/s00232-010-9268-z. - DOI - PubMed

Publication types

MeSH terms

Substances