

Plane of nutrition affects the phylogenetic diversity and relative abundance of transcriptionally active methanogens in the bovine rumen
- PMID: 29026096
- PMCID: PMC5638848
- DOI: 10.1038/s41598-017-13013-y
Plane of nutrition affects the phylogenetic diversity and relative abundance of transcriptionally active methanogens in the bovine rumen
Abstract
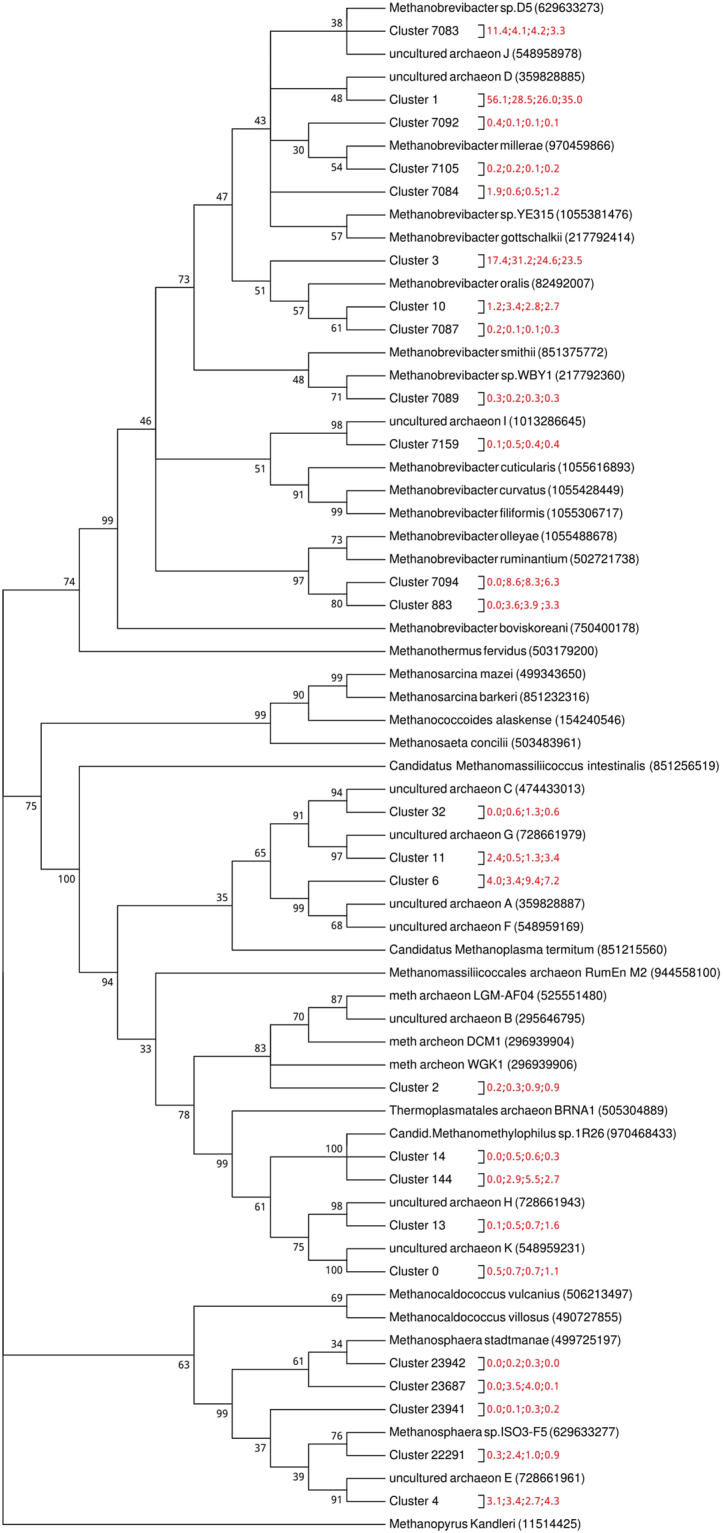
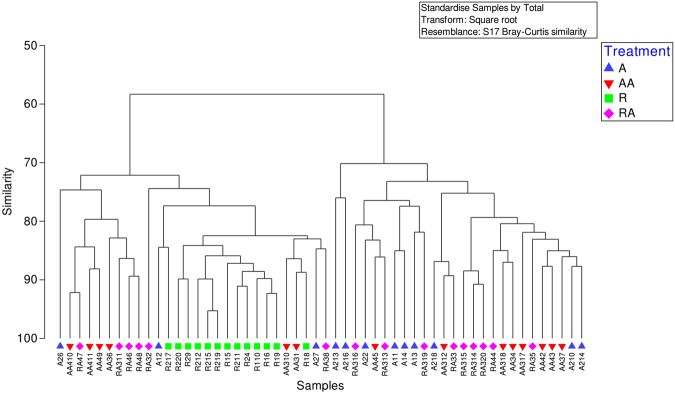
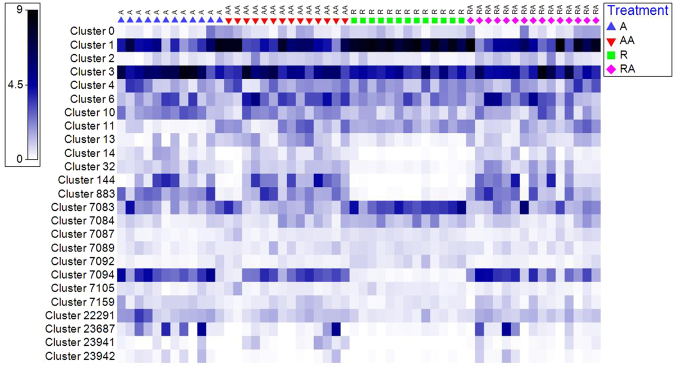
Methane generated during enteric fermentation in ruminant livestock species is a major contributor to global anthropogenic greenhouse gas emissions. A period of moderate feed restriction followed by ad libitum access to feed is widely applied in cattle management to exploit the animal's compensatory growth potential and reduce feed costs. In the present study, we utilised microbial RNA from rumen digesta samples to assess the phylogenetic diversity of transcriptionally active methanogens from feed-restricted and non-restricted animals. To determine the contribution of different rumen methanogens to methanogenesis during dietary restriction of cattle, we conducted high-throughput mcrA cDNA amplicon sequencing on an Illumina MiSeq and analysed both the abundance and phylogenetic origin of different mcrA cDNA sequences. When compared to their unrestricted contemporaries, in feed-restricted animals, the methanogenic activity, based on mcrA transcript abundance, of Methanobrevibacter gottschalkii clade increased while the methanogenic activity of the Methanobrevibacter ruminantium clade and members of the Methanomassiliicoccaceae family decreased. This study shows that the quantity of feed consumed can evoke large effects on the composition of methanogenically active species in the rumen of cattle. These data potentially have major implications for targeted CH4 mitigation approaches such as anti-methanogen vaccines and/or tailored dietary management.
Conflict of interest statement
The authors declare that they have no competing interests.
Figures


References
-
- Agreement, P. United Nations Framework Convention on Climate Change. Paris, France (2015).
-
- Change, I.P.o.C. Climate change 2014: mitigation of climate change(Cambridge University Press, 2015).
-
- Tubiello, F. et al. Agriculture, forestry and other land use emissions by sources and removals by sinks. Statistics Division, Food and Agriculture Organization, Rome (2014).
-
- McCabe MS, et al. Illumina MiSeq Phylogenetic Amplicon Sequencing Shows a Large Reduction of an Uncharacterised Succinivibrionaceae and an Increase of the Methanobrevibacter gottschalkii Clade in Feed Restricted Cattle. PLOS ONE. 2015;10:e0133234. doi: 10.1371/journal.pone.0133234. - DOI - PMC - PubMed
MeSH terms
Substances
LinkOut - more resources
Full Text Sources
Other Literature Sources
