. 2017 Oct 12;7(1):13042.
doi: 10.1038/s41598-017-13382-4.

Evidence of Early-Stage Selection on EPAS1 and GPR126 Genes in Andean High Altitude Populations

Affiliations

Evidence of Early-Stage Selection on EPAS1 and GPR126 Genes in Andean High Altitude Populations

Christina A Eichstaedt et al. Sci Rep. .

Abstract

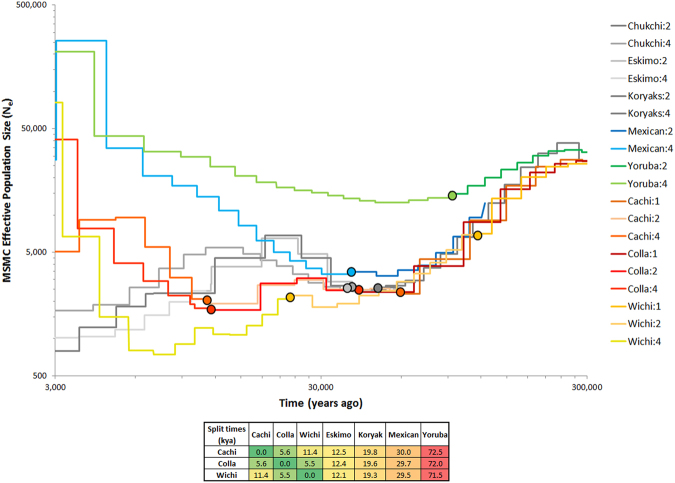
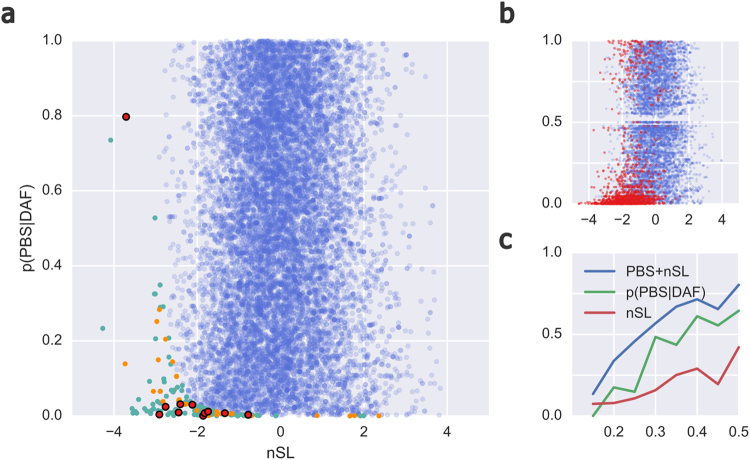
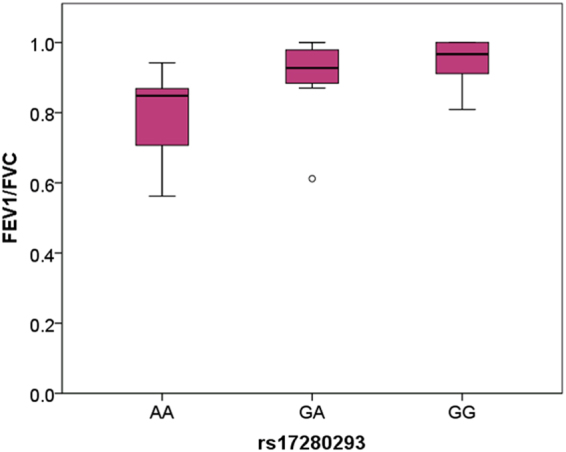
The aim of this study is to identify genetic variants that harbour signatures of recent positive selection and may facilitate physiological adaptations to hypobaric hypoxia. To achieve this, we conducted whole genome sequencing and lung function tests in 19 Argentinean highlanders (>3500 m) comparing them to 16 Native American lowlanders. We developed a new statistical procedure using a combination of population branch statistics (PBS) and number of segregating sites by length (nSL) to detect beneficial alleles that arose since the settlement of the Andes and are currently present in 15-50% of the population. We identified two missense variants as significant targets of selection. One of these variants, located within the GPR126 gene, has been previously associated with the forced expiratory volume/forced vital capacity ratio. The other novel missense variant mapped to the EPAS1 gene encoding the hypoxia inducible factor 2α. EPAS1 is known to be the major selection candidate gene in Tibetans. The derived allele of GPR126 is associated with lung function in our sample of highlanders (p < 0.05). These variants may contribute to the physiological adaptations to hypobaric hypoxia, possibly by altering lung function. The new statistical approach might be a useful tool to detect selected variants in population studies.


Conflict of interest statement

The authors declare that they have no competing interests.

Figures

Figure 1
Figure 1
MSMC plot, effective population sizes and split times of Collas, Native American lowlanders, Siberians and Africans. Effective population size (Ne) and split time estimates are based on 1, 2 or 4 genomes for the Native Americans and on 2 and 4 genomes for the other populations. Coloured dots show where the MSMC curves based on 1, 2 or 4 genomes were joined together to provide a comprehensive representation of the changes in Ne over time for each of the analysed population. Around 100,000 years the out of Africa exit starts to reduce population size in non-Africans. Yoruba show a limited decline as they remain in Africa. Ne of Collas rises up to 30,000 units 3,000 years ago. Andean highlanders: Collas; Calchaquíes (Cachi): intermediate altitude population in Argentina (2300 m); American lowlanders: Mexican, Wichí; Siberians: Eskimo, Koryaks, Chukchi.
Figure 2
Figure 2
Distribution of nSL + PBS and power calculations. (a) Observed joint distribution of nSL and p(PBS|DAF) of all exonic SNPs (blue), with top-1% outliers coloured teal (not missense), orange (missense) or red with black border (missense; the 11 highly damaging variants). (b) Simulated joint distribution of nSL and p(PBS|DAF), with X- and Y-axes as in (a). Results from neutral scenarios are shown in blue, with those from selected scenarios (s = 0.02) in red. Note the clustering of selected SNPs in the low-p(PBS|DAF), low-nSL regime, corresponding to that detected by our PBS + nSL selection statistic; also note the especial clustering of most damaging missense variants in (a) in this region of the plot. (c) Power from the simulations of the three statistics to detect selection, with selected variants with a p-value ≤ 0.0062 classified as successful detections. X- and Y-axes are derived allele frequency and power, respectively.
Figure 3
Figure 3
FEV1/FVC in Collas sorted by derived allele frequency. The ratio increases with number of derived alleles indicating an improvement of lung function in Collas. One-tailed p-value = 0.029, r2 = 0.195; FEV1: forced expiratory volume in the first second, FVC: forced vital capacity.

References

    1. Pleurdeau D. Human Technical Behavior in the African Middle StoneAge: The Lithic Assemblage of Porc-Epic Cave (Dire Dawa, Ethiopia) Afr. Archaeol. Rev. 2005;22:177–197. doi: 10.1007/s10437-006-9000-7. - DOI
    1. Eichstaedt CA, et al. Genetic and phenotypic differentiation of an Andean intermediate altitude population. Physiol. Rep. 2015;3:e12376. doi: 10.14814/phy2.12376. - DOI - PMC - PubMed
    1. Rupert JL, Hochachka PW. Genetic approaches to understanding human adaptation to altitude in the Andes. J. Exp. Biol. 2001;204:3151–3160. - PubMed
    1. Frank, S. Pueblos Originarios de América. (Ediciones de Sol S.R.L., 2008).
    1. Rothhammer F, Silva C. Peopling of Andean South America. Am. J. Phys. Anthropol. 1989;78:403–410. doi: 10.1002/ajpa.1330780308. - DOI - PubMed

Publication types

Substances

LinkOut - more resources