

Application of stable-isotope labelling techniques for the detection of active diazotrophs
- PMID: 29027346
- PMCID: PMC5814836
- DOI: 10.1111/1462-2920.13954
Application of stable-isotope labelling techniques for the detection of active diazotrophs
Erratum in
-
Application of stable-isotope labelling techniques for the detection of active diazotrophs.Environ Microbiol. 2022 Oct;24(10):4962-4963. doi: 10.1111/1462-2920.16213. Environ Microbiol. 2022. PMID: 36254867 Free PMC article. No abstract available.
Abstract
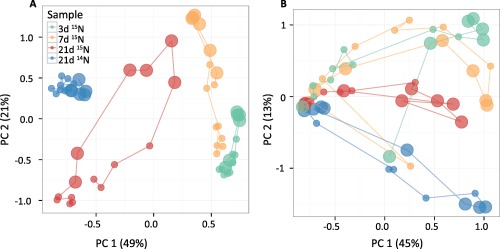
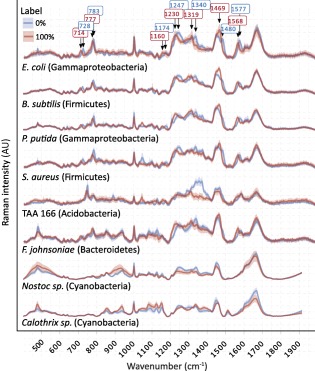
Investigating active participants in the fixation of dinitrogen gas is vital as N is often a limiting factor for primary production. Biological nitrogen fixation is performed by a diverse guild of bacteria and archaea (diazotrophs), which can be free-living or symbionts. Free-living diazotrophs are widely distributed in the environment, yet our knowledge about their identity and ecophysiology is still limited. A major challenge in investigating this guild is inferring activity from genetic data as this process is highly regulated. To address this challenge, we evaluated and improved several 15 N-based methods for detecting N2 fixation activity (with a focus on soil samples) and studying active diazotrophs. We compared the acetylene reduction assay and the 15 N2 tracer method and demonstrated that the latter is more sensitive in samples with low activity. Additionally, tracing 15 N into microbial RNA provides much higher sensitivity compared to bulk soil analysis. Active soil diazotrophs were identified with a 15 N-RNA-SIP approach optimized for environmental samples and benchmarked to 15 N-DNA-SIP. Lastly, we investigated the feasibility of using SIP-Raman microspectroscopy for detecting 15 N-labelled cells. Taken together, these tools allow identifying and investigating active free-living diazotrophs in a highly sensitive manner in diverse environments, from bulk to the single-cell level.
© 2017 The Authors. Environmental Microbiology published by Society for Applied Microbiology and John Wiley & Sons Ltd.
Figures


Similar articles
-
Functional Single-Cell Approach to Probing Nitrogen-Fixing Bacteria in Soil Communities by Resonance Raman Spectroscopy with 15N2 Labeling.Anal Chem. 2018 Apr 17;90(8):5082-5089. doi: 10.1021/acs.analchem.7b05080. Epub 2018 Mar 27. Anal Chem. 2018. PMID: 29557648
-
Stable isotope probing with 15N2 reveals novel noncultivated diazotrophs in soil.Appl Environ Microbiol. 2007 May;73(10):3196-204. doi: 10.1128/AEM.02610-06. Epub 2007 Mar 16. Appl Environ Microbiol. 2007. PMID: 17369332 Free PMC article.
-
Advancements in the application of NanoSIMS and Raman microspectroscopy to investigate the activity of microbial cells in soils.FEMS Microbiol Ecol. 2015 Oct;91(10):fiv106. doi: 10.1093/femsec/fiv106. Epub 2015 Aug 30. FEMS Microbiol Ecol. 2015. PMID: 26324854 Free PMC article.
-
Marine Non-Cyanobacterial Diazotrophs: Moving beyond Molecular Detection.Trends Microbiol. 2016 Nov;24(11):916-927. doi: 10.1016/j.tim.2016.07.002. Epub 2016 Jul 29. Trends Microbiol. 2016. PMID: 27476748 Review.
-
Non-cyanobacterial diazotrophs: global diversity, distribution, ecophysiology, and activity in marine waters.FEMS Microbiol Rev. 2023 Nov 1;47(6):fuac046. doi: 10.1093/femsre/fuac046. FEMS Microbiol Rev. 2023. PMID: 36416813 Free PMC article. Review.
Cited by
-
Advances in monitoring soil microbial community dynamic and function.J Appl Genet. 2020 May;61(2):249-263. doi: 10.1007/s13353-020-00549-5. Epub 2020 Feb 15. J Appl Genet. 2020. PMID: 32062778 Review.
-
Evaluation of Primers Targeting the Diazotroph Functional Gene and Development of NifMAP - A Bioinformatics Pipeline for Analyzing nifH Amplicon Data.Front Microbiol. 2018 Apr 30;9:703. doi: 10.3389/fmicb.2018.00703. eCollection 2018. Front Microbiol. 2018. PMID: 29760683 Free PMC article.
-
Gold-FISH enables targeted NanoSIMS analysis of plant-associated bacteria.New Phytol. 2023 Oct;240(1):439-451. doi: 10.1111/nph.19112. Epub 2023 Jun 28. New Phytol. 2023. PMID: 37381111 Free PMC article.
-
Microbial phenomics linking the phenotype to fonction: The potential of Raman spectroscopy.J Microbiol. 2021 Mar;59(3):249-258. doi: 10.1007/s12275-021-0590-1. Epub 2021 Jan 26. J Microbiol. 2021. PMID: 33496936 Review.
-
15N-DNA stable isotope probing reveals niche differentiation of ammonia oxidizers in paddy soils.Appl Microbiol Biotechnol. 2024 May 24;108(1):342. doi: 10.1007/s00253-024-13170-x. Appl Microbiol Biotechnol. 2024. PMID: 38789552 Free PMC article.
References
-
- Addison, S.L. , McDonald, I.R. , and Lloyd‐Jones, G. (2010) Identifying diazotrophs by incorporation of nitrogen from 15N2 into RNA. Appl Microbiol Biotechnol 87: 2313–2322. - PubMed
-
- Angel, R. (2012) Total nucleic acid extraction from soil. Protoc Exch. doi:10.1038/protex.2012.046. - DOI
-
- Angel, R. , and Conrad, R. (2013) Elucidating the microbial resuscitation cascade in biological soil crusts following a simulated rain event. Environ Microbiol 15: 2799–2815. - PubMed
-
- Aoyagi, T. , Hanada, S. , Itoh, H. , Sato, Y. , Ogata, A. , and Friedrich, M.W. (2015) Ultra‐high‐sensitivity stable‐isotope probing of rRNA by high‐throughput sequencing of isopycnic centrifugation gradients. Environ Microbiol Rep 7: 282–287. - PubMed
Publication types
MeSH terms
Substances
Grants and funding
LinkOut - more resources
Full Text Sources
Other Literature Sources
Miscellaneous
