. 2018 Jan;12(1):225-236.
doi: 10.1038/ismej.2017.162. Epub 2017 Oct 13.

Geobiological feedbacks and the evolution of thermoacidophiles

Affiliations

Geobiological feedbacks and the evolution of thermoacidophiles

Daniel R Colman et al. ISME J. 2018 Jan.

Abstract

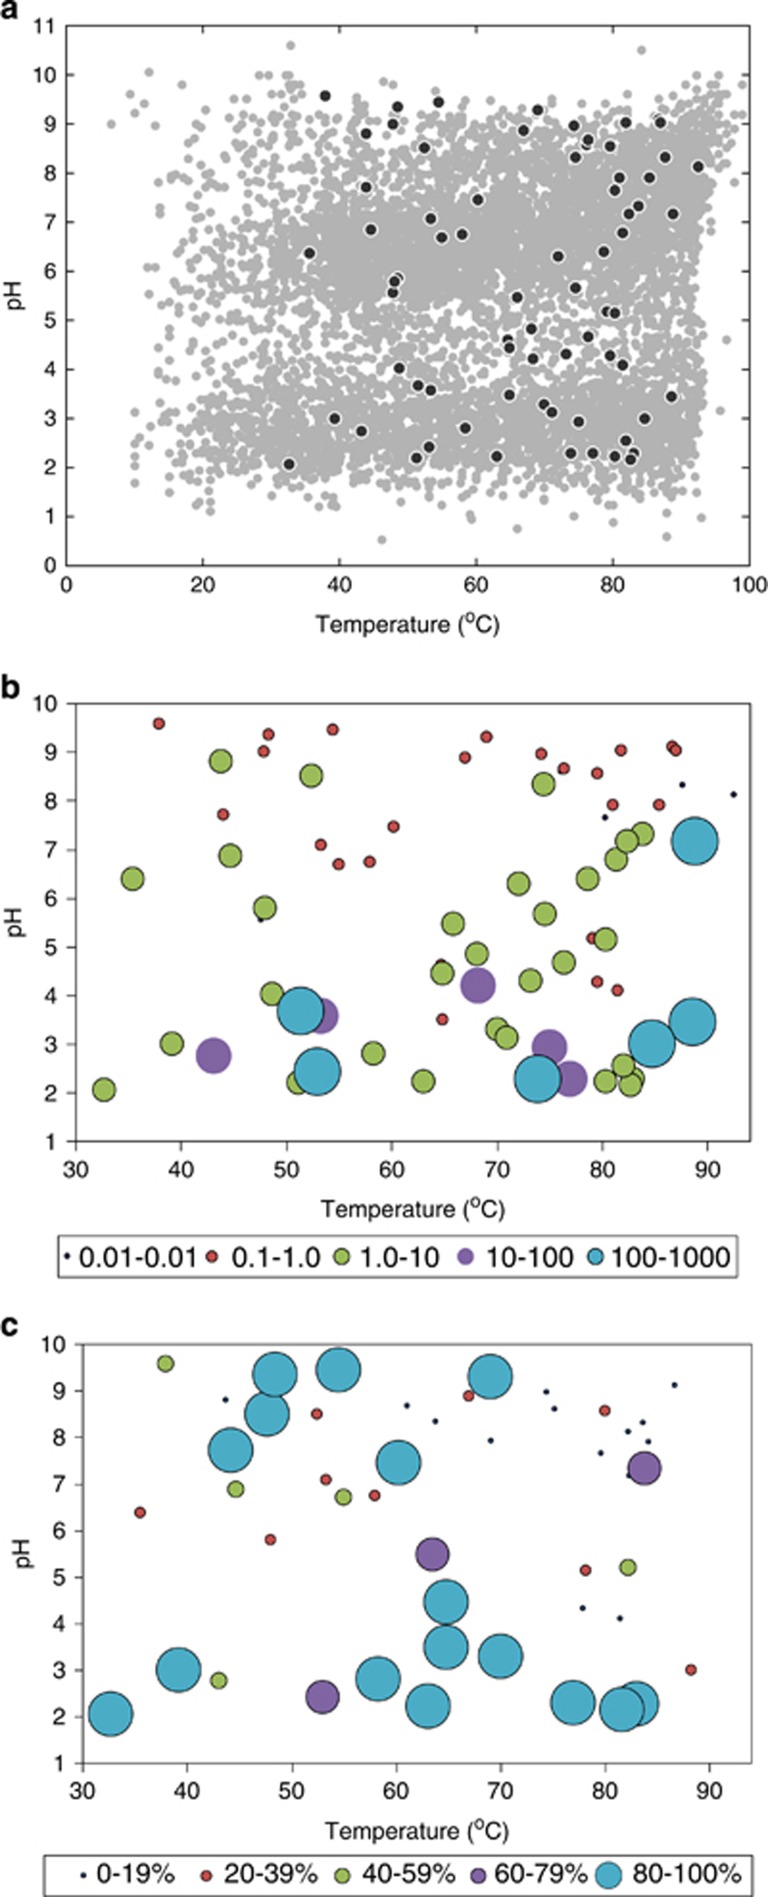
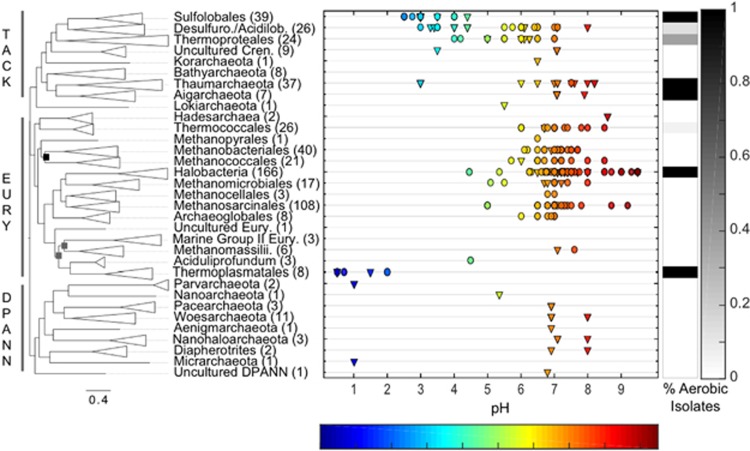
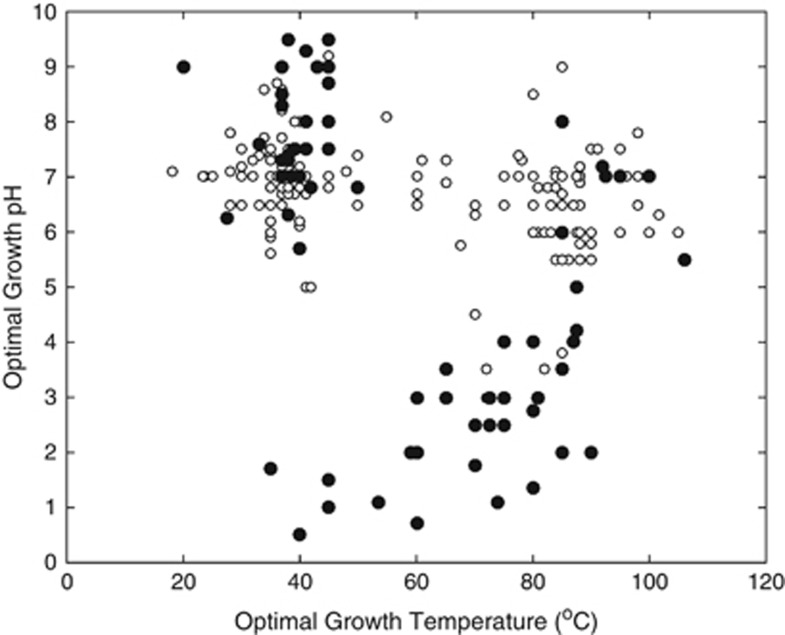
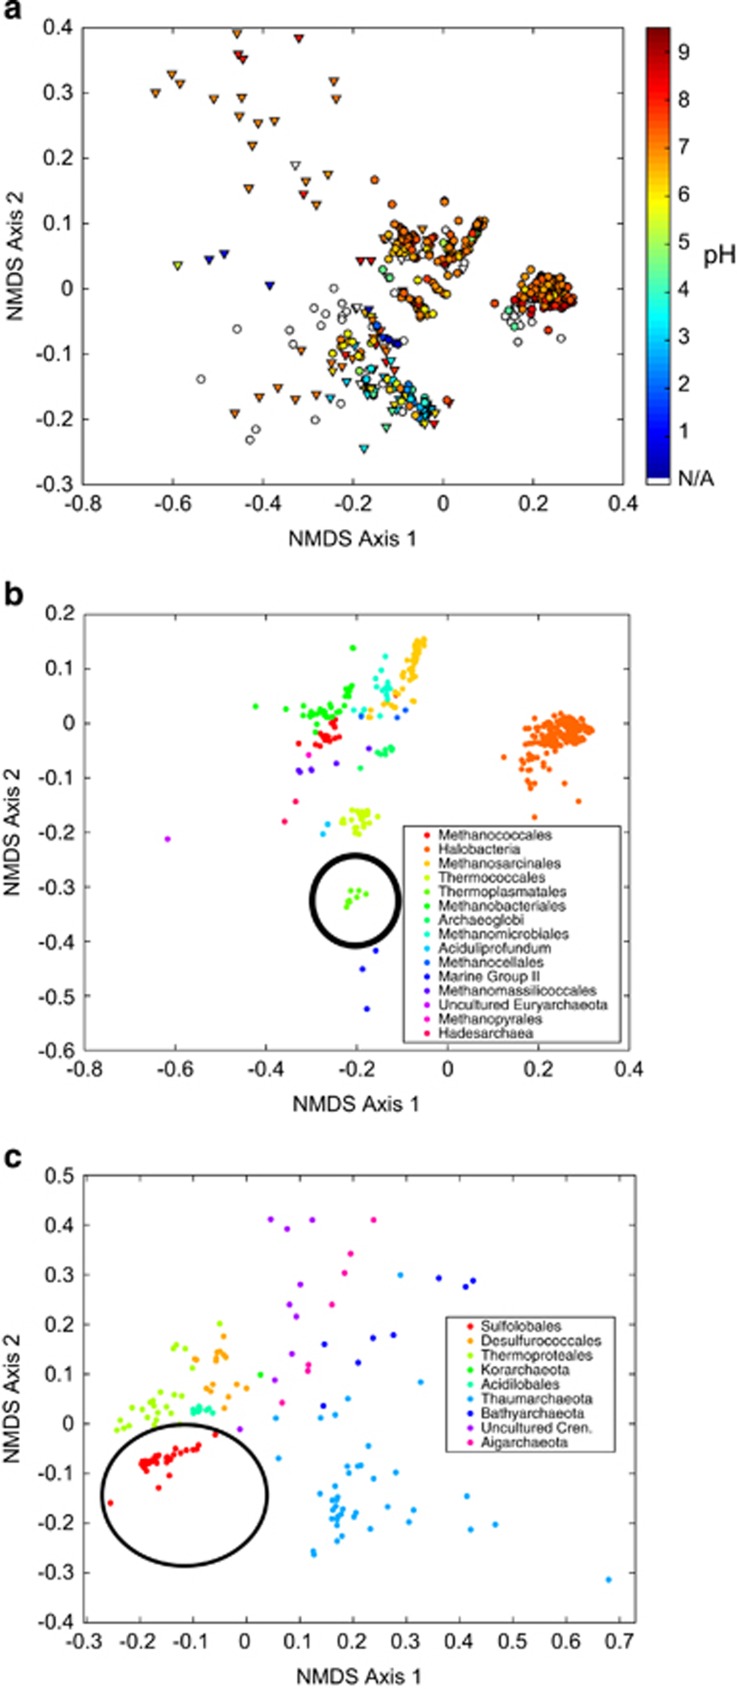
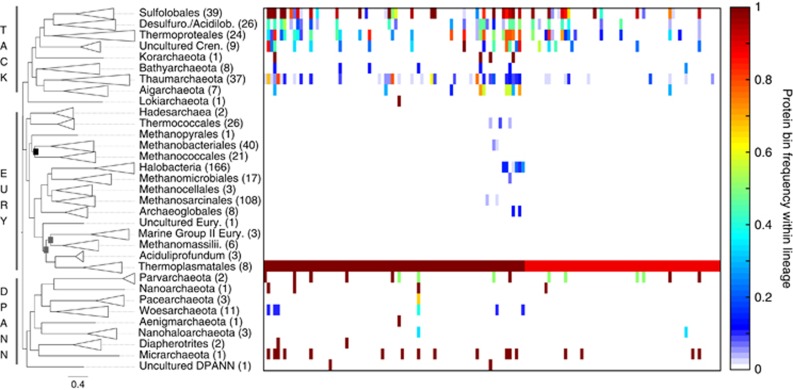
Oxygen-dependent microbial oxidation of sulfur compounds leads to the acidification of natural waters. How acidophiles and their acidic habitats evolved, however, is largely unknown. Using 16S rRNA gene abundance and composition data from 72 hot springs in Yellowstone National Park, Wyoming, we show that hyperacidic (pH<3.0) hydrothermal ecosystems are dominated by a limited number of archaeal lineages with an inferred ability to respire O2. Phylogenomic analyses of 584 existing archaeal genomes revealed that hyperacidophiles evolved independently multiple times within the Archaea, each coincident with the emergence of the ability to respire O2, and that these events likely occurred in the recent evolutionary past. Comparative genomic analyses indicated that archaeal thermoacidophiles from independent lineages are enriched in similar protein-coding genes, consistent with convergent evolution aided by horizontal gene transfer. Because the generation of acidic environments and their successful habitation characteristically require O2, these results suggest that thermoacidophilic Archaea and the acidity of their habitats co-evolved after the evolution of oxygenic photosynthesis. Moreover, it is likely that dissolved O2 concentrations in thermal waters likely did not reach levels capable of sustaining aerobic thermoacidophiles and their acidifying activity until ~0.8 Ga, when present day atmospheric levels were reached, a time period that is supported by our estimation of divergence times for archaeal thermoacidophilic clades.


Conflict of interest statement

The authors declare no conflict of interest.

Figures

Figure 1
Figure 1
Temperature and pH of hot springs that were sampled and the dominance of aerobic Archaea in acidic hot springs. (a) Temperature and pH for spring samples (black circles; n=72) are overlaid on temperature and pH of thermal features downloaded from the Yellowstone National Park Research Coordination Network database (gray circles; n=7693). (b) The ratio of archaeal:bacterial 16S rRNA genes from 72 YNP hot springs plotted as a function of spring temperature and pH. Legend below x axis provides size and color for corresponding ratio magnitude. (c) The percentage of the archaeal community inferred to be capable of aerobic respiration, based on physiological inference to the closest related cultivar, nearest cultivated isolate or genome in springs that yielded 16S rRNA gene sequence.
Figure 2
Figure 2
Phylogenetic placement of archaeal acidophiles, pH optima and corresponding O2 usage profiles. The Maximum Likelihood tree was constructed using a concatenation of between 53 and 104 phylogenetic marker genes for 584 archaeal genomes (median n=103; 0.05 percentile n=70). Order-level (or above) lineages are collapsed in the tree. All nodes shown exhibited bootstraps >95% except where black boxes (>70%) or gray boxes (< 70%) are shown. Scale bar shows expected number of substitutions per site. pH optima (scatterplot) and O2 usage data (black/white heatmap on right, as a % of isolates that are aerobic) are given for each lineage where cultivars are available. pH optima for cultivars are shown as circles, whereas environmental pH of reconstructed genomes or cultivation media pH (non-optima) are shown as triangles.
Figure 3
Figure 3
Optimal growth pH, optimal incubation temperature and O2 usage for archaeal cultivars. Each point represents a single archaeal cultivar (N=255) that is colored based on the ability (aerobe; black circles; n=76) or inability (anaerobe; white circles; n=179) to incorporate O2 into their metabolism.
Figure 4
Figure 4
Similarity in protein-coding genes among archaeal genomes. (a) Nonmetric multidimensional scaling (NMDS) plot of protein-coding gene bins among all archaeal genomes. Symbols are as in Figure 2: cultivar genomes are shown as circles and reconstructed genomes from environmental samples are shown as triangles. Symbol color refers to pH optima or environmental pH according to the scale on the right. (b) NMDS plots including only Euryarchaeota genomes and (c) TACK superphylum genomes. Thermoplasmatales and Sulfolobales are indicated with black circles in b, c, respectively. Each point represents a genome, and points are colored according to taxonomic orders as given by the legends on the right. Axes represent relative positioning of genomes to one another, such that points closer together are more similar, and points farther apart are less similar.
Figure 5
Figure 5
Heatmap showing the distribution of Thermoplasmatales-enriched protein-coding genes among non-Euryarchaeota genomes. The Maximum Likelihood tree is the same as shown in Figure 2. Protein bin distribution is only shown for those protein-coding genes with >87% frequency within the Thermoplasmatales lineage (n=138), and which most differentiate the Thermoplasmatales from other Euryarchaeaota based on ‘indicator’ values. Annotations for each protein bin are given in Supplementary Table S7.

References

    1. Acinas SG, Marcelino LA, Klepac-Ceraj V, Polz MF. (2004). Divergence and redundancy of 16 S rRNA sequences in genomes with multiple rrn operons. J Bacteriol 186: 2629–2635. - PMC - PubMed
    1. Baker BJ, Banfield JF. (2003). Microbial communities in acid mine drainage. FEMS Microbiol Ecol 44: 139–152. - PubMed
    1. Baker BJ, Comolli LR, Dick GJ, Hauser LJ, Hyatt D, Dill BD et al. (2010). Enigmatic, ultrasmall, uncultivated Archaea. Proc Natl Acad Sci USA 107: 8806–8811. - PMC - PubMed
    1. Baker-Austin C, Dopson M. (2007). Life in acid: pH homeostasis in acidophiles. Trends Microbiol 15: 165–171. - PubMed
    1. Battistuzzi FU, Feijao A, Hedges SB. (2004). A genomic timescale of prokaryote evolution: insights into the origin of methanogenesis, phototrophy, and the colonization of land. BMC Evol Biol 4: 1–14. - PMC - PubMed

Substances