

Ex vivo validation of photo-magnetic imaging
- PMID: 29028040
- PMCID: PMC6855589
- DOI: 10.1364/OL.42.004171
Ex vivo validation of photo-magnetic imaging
Abstract
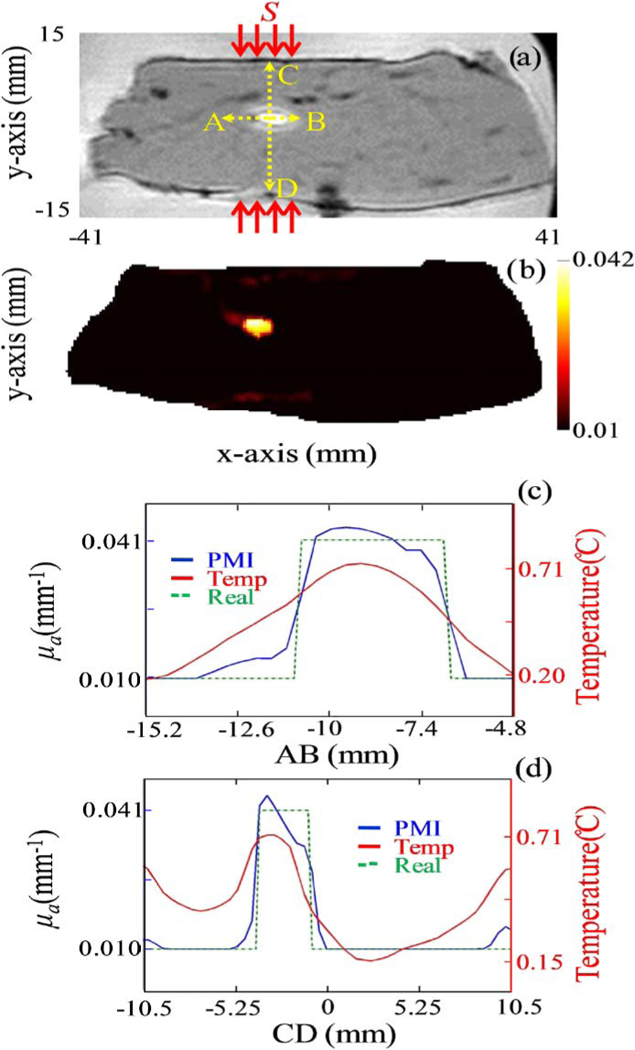
We recently introduced a new high-resolution diffuse optical imaging technique termed photo-magnetic imaging (PMI), which utilizes magnetic resonance thermometry (MRT) to monitor the 3D temperature distribution induced in a medium illuminated with a near-infrared light. The spatiotemporal temperature distribution due to light absorption can be accurately estimated using a combined photon propagation and heat diffusion model. High-resolution optical absorption images are then obtained by iteratively minimizing the error between the measured and modeled temperature distributions. We have previously demonstrated the feasibility of PMI with experimental studies using tissue simulating agarose phantoms. In this Letter, we present the preliminary ex vivo PMI results obtained with a chicken breast sample. Similarly to the results obtained on phantoms, the reconstructed images reveal that PMI can quantitatively resolve an inclusion with a 3 mm diameter embedded deep in a biological tissue sample with only 10% error. These encouraging results demonstrate the high performance of PMI in ex vivo biological tissue and its potential for in vivo imaging.
Figures


References
-
- Gibson A, Hebden J, and Arridge SR, Phys. Med. Biol 50, R1 (2005). - PubMed
-
- Hebden J, Arridge S, and Delpy D, Phys. Med. Biol 42, 825 (1997). - PubMed
-
- Arridge SR and Lionheart WRB, Opt. Lett 23, 882 (1998). - PubMed
-
- Yalavarthy PK, Pogue BW, Dehghani H, and Paulsen KD, Med. Phys 34, 2085 (2007). - PubMed
MeSH terms
Grants and funding
LinkOut - more resources
Full Text Sources
Other Literature Sources
