Comparative Study
. 2019 Jan 18;20(1):288-298.
doi: 10.1093/bib/bbx115.

Comparative analysis of differential gene expression tools for RNA sequencing time course data

Affiliations
Comparative Study

Comparative analysis of differential gene expression tools for RNA sequencing time course data

Daniel Spies et al. Brief Bioinform. .

Abstract

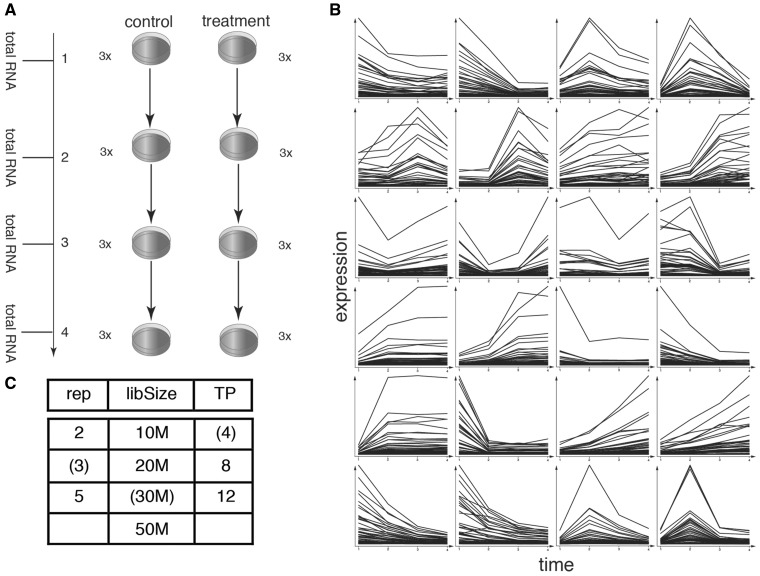
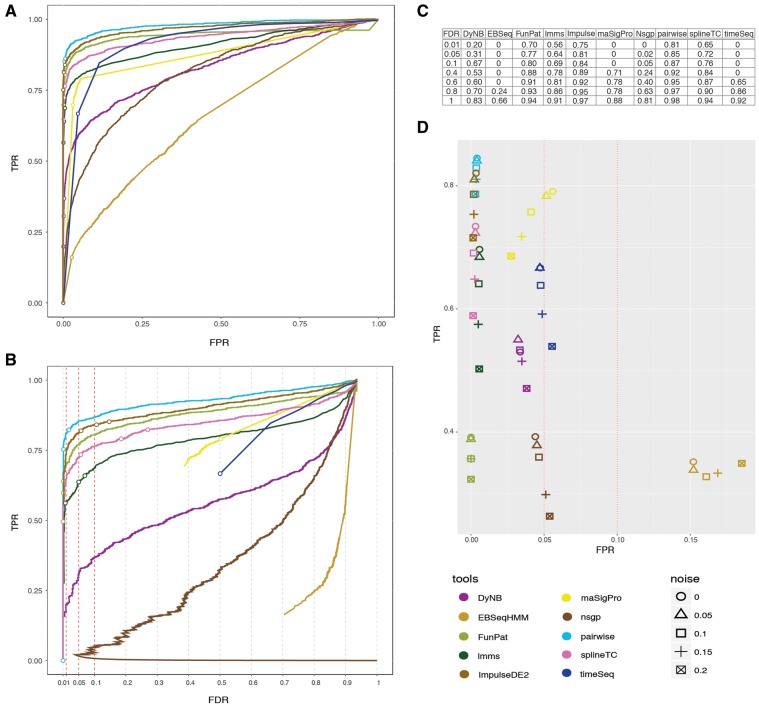
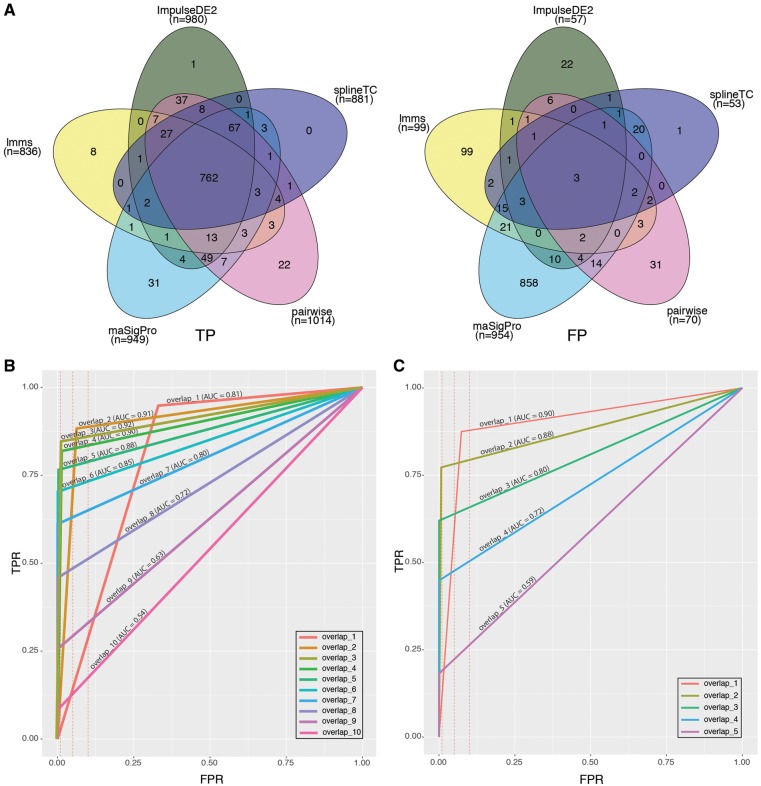
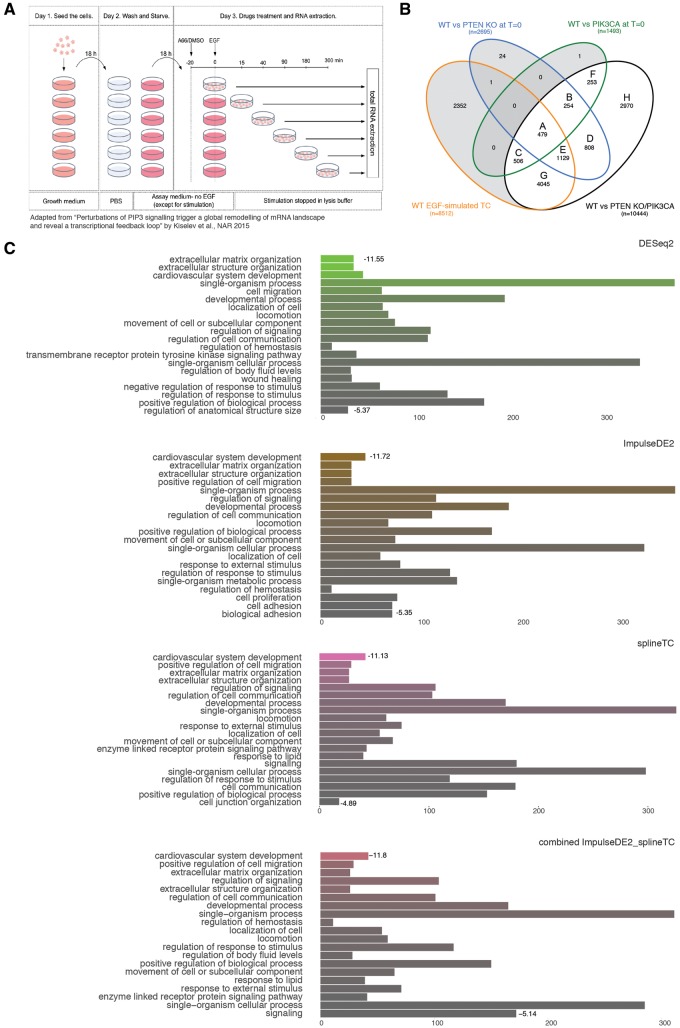
RNA sequencing (RNA-seq) has become a standard procedure to investigate transcriptional changes between conditions and is routinely used in research and clinics. While standard differential expression (DE) analysis between two conditions has been extensively studied, and improved over the past decades, RNA-seq time course (TC) DE analysis algorithms are still in their early stages. In this study, we compare, for the first time, existing TC RNA-seq tools on an extensive simulation data set and validated the best performing tools on published data. Surprisingly, TC tools were outperformed by the classical pairwise comparison approach on short time series (<8 time points) in terms of overall performance and robustness to noise, mostly because of high number of false positives, with the exception of ImpulseDE2. Overlapping of candidate lists between tools improved this shortcoming, as the majority of false-positive, but not true-positive, candidates were unique for each method. On longer time series, pairwise approach was less efficient on the overall performance compared with splineTC and maSigPro, which did not identify any false-positive candidate.


Figures

Figure 1
Figure 1
The standard experimental design (A) consisted of two TCs having 4 time points with three replicates each. A single value for each gene was sampled from a negative binomial distribution using mean/dispersion value pairs of a biological data set. Time points and replicates were then drawn from the same distribution and expression patterns applied by multiplying with the pattern vector. Of the total 24 patterns that were simulated, each consisted of 50 genes, resulting in the simulation of 1200 DEGs in total (B). As genes were drawn from a negative binomial distribution, each pattern mostly consists of lowly expressed genes and a few highly expressed genes. (C) Other experimental designs were tested by increasing or reducing the library size, replicates or time points (standard parameters in parenthesis).
Figure 2
Figure 2
Results of standard simulation scenario. (A) ROC showing the TPR and FPR on the x and y axis, respectively. FDR thresholds of 0.01, 0.05 and 0.1 are indicated by rings on each curve. (B) TPR/FDR curves with ring indicated adjusted P-value thresholds of 0.01, 0.05 and 0.1. (C) AUC fraction (ranging from 0/worst to 1/best) calculated for the ROC on several FDR thresholds. (D) Performance of TC tools on noisy data ranging from 0.05 to 0.2 white noise added to the samples.
Figure 3
Figure 3
Results of overlapping candidate lists. (A) Overlaps of true-positive (left) and false-positive (right) candidates of top five tools. (B) ROC curve with computed AUC for overlaps of candidate lists. The number of the overlap indicates the minimum number of lists sharing candidates. (C) ROC curve with computed AUC for top five tools. FPR thresholds of 0.01, 0.05 and 0.1 are indicated by dashed red lines.
Figure 4
Figure 4
Experimental design and results of published data on PIP3 signaling perturbations. (A) Experimental design and processing steps of samples. (B) DESeq2 overlaps of DEGs between TCs and T0 for further categorization and GO analysis. (C) GO enrichment for Class A DEGs for each method and the combined approach. The length of the bar depicts the number of enriched genes in each term. Log10 P-value is indicated by color (increasing from colored to gray), and is shown for the first and last term to indicate the range.

References

    1. Nagalakshmi U, Wang Z, Waern K. The transcriptional landscape of the yeast genome defined by RNA sequencing. Science 2008;320:1341–4. - PMC - PubMed
    1. Acerbi E, Viganò E, Poidinger M. Continuous time Bayesian networks identify Prdm1 as a negative regulator of TH17 cell differentiation in humans. Sci Rep 2016;6:23128. - PMC - PubMed
    1. do Amaral MN, Arge LW, Benitez LC. Comparative transcriptomics of rice plants under cold, iron, and salt stresses. Funct Integr Genomics 2016;16:567–79. - PubMed
    1. Giannopoulou EG, Elemento O, Ivashkiv LB.. Use of RNA sequencing to evaluate rheumatic disease patients. Arthritis Res Ther 2015;17:167. - PMC - PubMed
    1. Sudmant PH, Alexis MS, Burge CB.. Meta-analysis of RNA-seq expression data across species, tissues and studies. Genome Biol 2015;16:287. - PMC - PubMed

Publication types

MeSH terms