. 2017 Dec 1;40(12):zsx167.
doi: 10.1093/sleep/zsx167.

Time-on-Task Effect During Sleep Deprivation in Healthy Young Adults Is Modulated by Dopamine Transporter Genotype

Affiliations

Time-on-Task Effect During Sleep Deprivation in Healthy Young Adults Is Modulated by Dopamine Transporter Genotype

Brieann C Satterfield et al. Sleep. .

Abstract

Study objectives: The time-on-task (TOT) effect and total sleep deprivation (TSD) have similar effects on neurobehavioral functioning, including increased performance instability during tasks requiring sustained attention. The TOT effect is exacerbated by TSD, suggesting potentially overlapping mechanisms. We probed these mechanisms by investigating genotype-phenotype relationships on psychomotor vigilance test (PVT) performance for 3 a-priori selected genes previously linked to the TOT effect and/or TSD: dopamine active transporter 1 (DAT1), catechol-O-methyltransferase (COMT), and tumor necrosis factor alpha (TNFα).

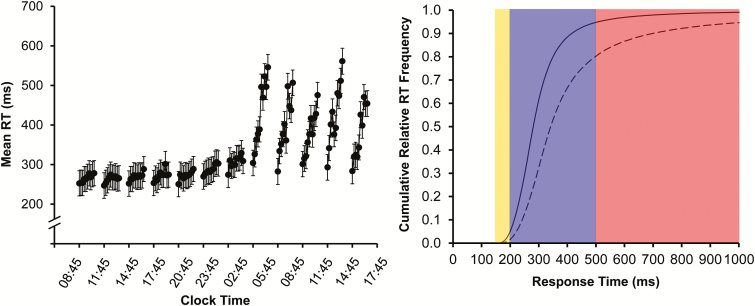
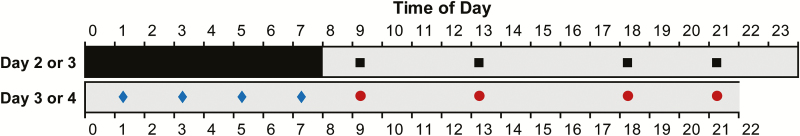
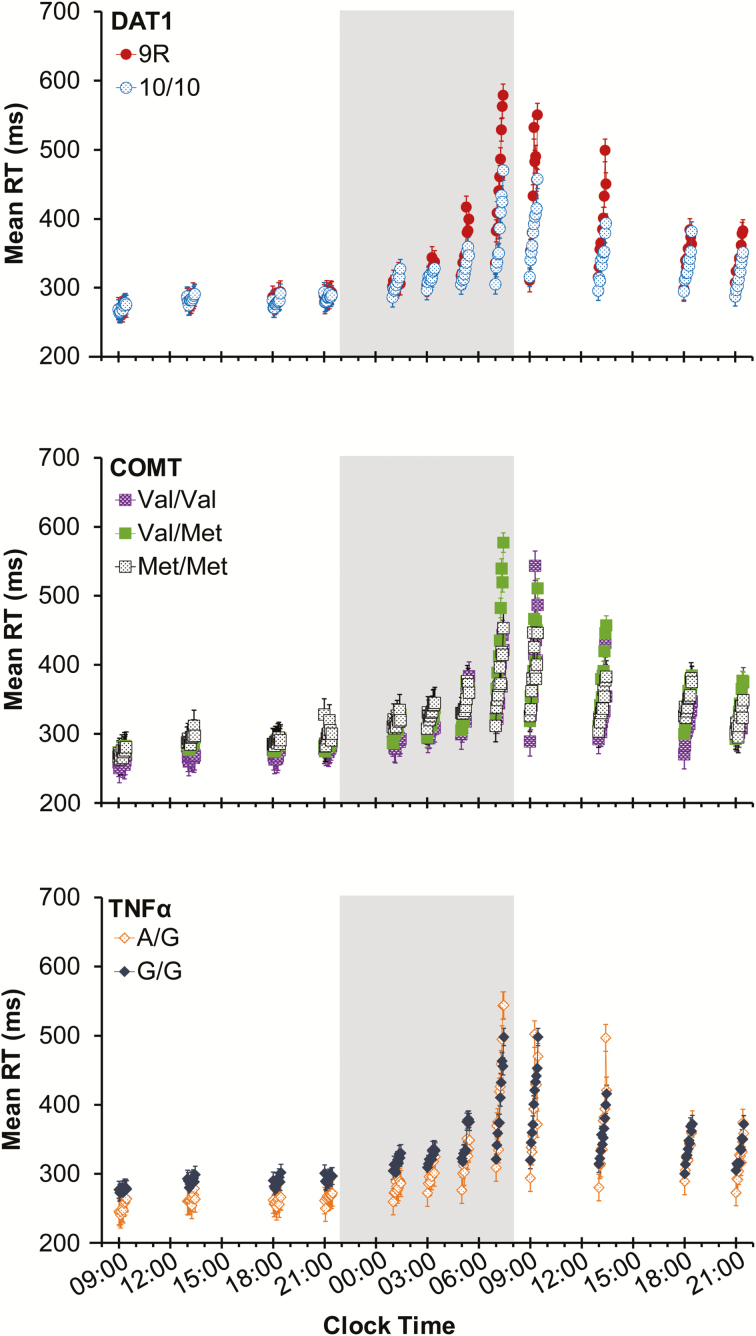
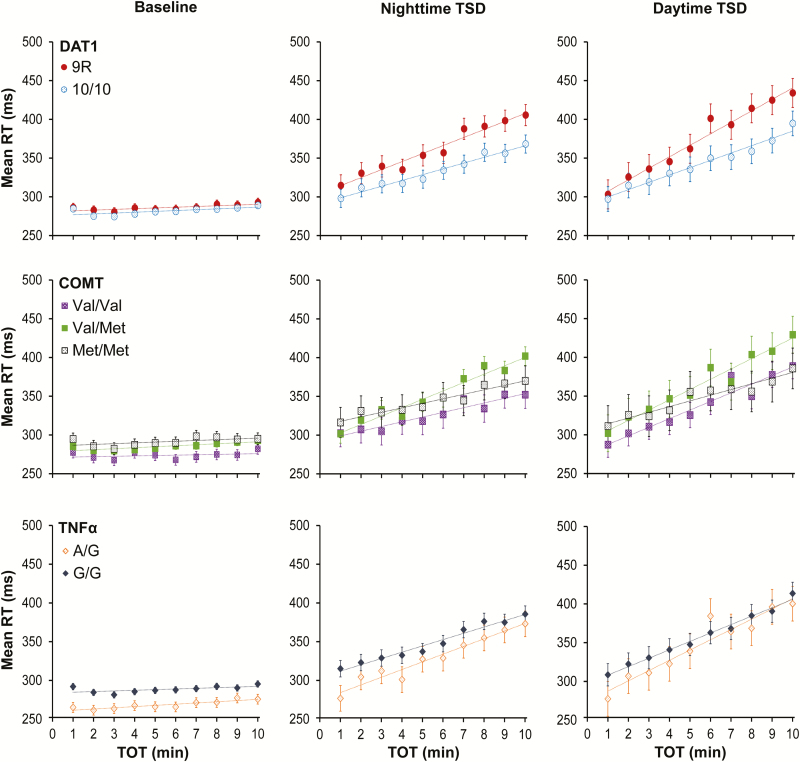
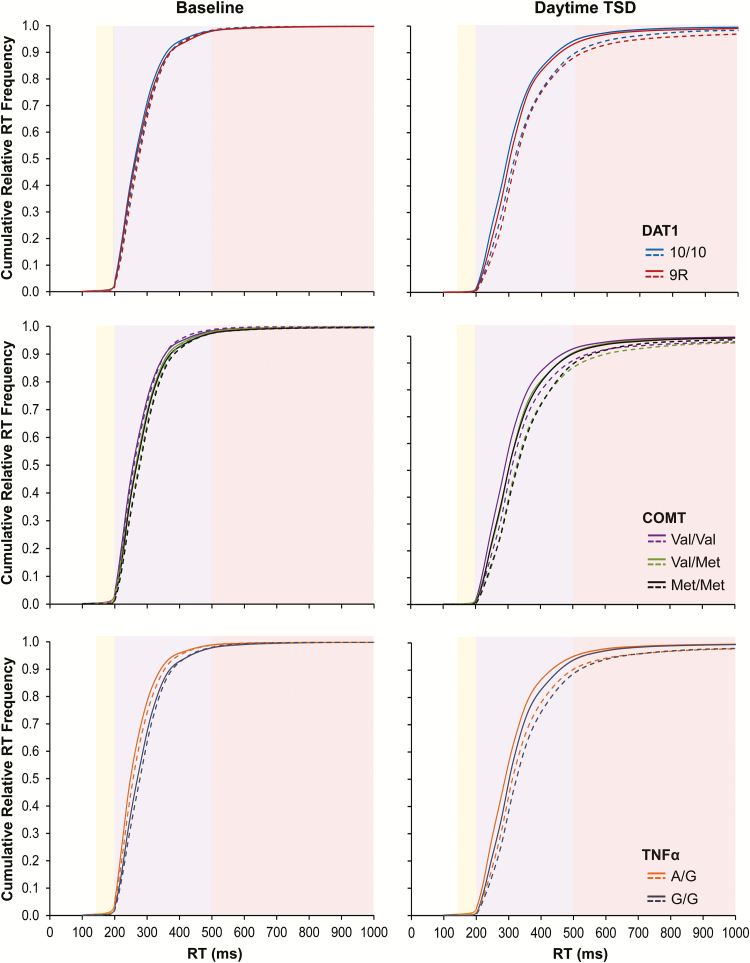
Methods: N = 82 healthy adults participated in 1 of 3 laboratory studies. A 10-min PVT was administered repeatedly during 38 h of TSD. We assessed changes in response time (RT) across each minute of the PVT as a function of time awake and genotype. Additionally, cumulative relative RT frequency distributions were constructed to examine changes in performance from the first to the second 5 min of the PVT as a function of genotype.

Results: DAT1, COMT, and TNFα were associated with differences in the build-up of the TOT effect across the 10-min PVT. DAT1 additionally modulated the interaction between TSD and the TOT effect. Subjects homozygous for the DAT1 10-repeat allele were relatively protected against TOT deficits on the PVT during TSD compared to carriers of the 9-repeat allele.

Conclusions: DAT1 is known to regulate dopamine reuptake and is highly expressed in the striatum. Our results implicate striatal dopamine in mechanisms involved in performance instability that appear to be common to TSD and the TOT effect. Furthermore, DAT1 may be a candidate biomarker of resilience to the build-up of performance impairment across TOT due to TSD.

Keywords: catechol-O-methyltransferase (COMT); cognitive performance; dopamine active transporter 1 (DAT1); fatigue; mental workload; psychomotor vigilance test (PVT); striatum; total sleep deprivation; tumor necrosis factor alpha (TNFα); vigilance decrement.


Figures

Figure 1
Figure 1
Illustration of analysis approaches. Left: mean RT (±standard error) in 1-min bins for each of twelve 10-min PVTs administered at 3-h intervals across 38 h of total sleep deprivation in an earlier study (16 healthy subjects). The graph shows the increase in mean RT across the 1-min bins in each test bout, with the rate of change increasing substantially with progressing time awake. Data are plotted against the start times of the PVT bouts; placement of the 1-min bins in each test bout is not to scale on the clock time axis. Graph modified from Grant et al. with permission from Springer Science+Business Media. Right: cumulative relative RT frequency distributions, showing on the ordinate the number of responses (expressed relative to the grand total number of responses) that is equal to or faster than a given RT on the abscissa. The curves shown here represent cumulative relative RT frequency distributions in the first 5 min (solid curve) versus second 5 min (dashed curve) of the 10-min PVT under conditions of sleep deprivation (simulated based on the diffusion model for one-choice reaction-time tasks using exaggerated parameter values for illustration purposes). The yellow-shaded area contains the fastest RTs, where the 2 curves begin to separate (notice they start at the same point on the RT axis in this illustration). The purple-shaded portion shows the heart of the cumulative relative frequency distributions, where the curves are separating progressively. Notice that the vertical separation is maximal at ~500 ms, which coincides with the cut-off traditionally used to define lapses of attention (ie, RTs ≥ 500 ms) on the PVT. The red-shaded area shows the slower RTs or lapse domain, where the curves begin to approach each other again (ultimately asymptoting on 1 if the abscissa were extended). PVT = psychomotor vigilance test; RT = response time.
Figure 2
Figure 2
Simplified schematic of the laboratory study design. After 1 (studies 1 and 2) or 2 (study 3) baseline days with 10 h sleep opportunities (22:00–08:00), subjects were kept awake for at least 38 h under constant behavioral monitoring. The PVT was administered at 2–5 h intervals throughout scheduled wakefulness. Test bouts serving as baseline (hours 1–14 of wakefulness) are indicated with a black square; test bouts capturing nighttime sleep deprivation (hours 15–24 of wakefulness) are indicated with a blue diamond; and test bouts capturing daytime sleep deprivation (hours 25–38 of wakefulness) are indicated with a red circle. Gray denotes scheduled wakefulness, and black indicates a baseline sleep opportunity (starting at 22:00 on the preceding day). Subjects went to bed for recovery sleep at 22:00 on day 3 (studies 1 and 2) or were kept awake for an additional 24 h (study 3) (not shown). PVT = psychomotor vigilance test.
Figure 3
Figure 3
Mean RT (±standard error) in 1-min bins on the 10-min PVT across test bouts during 38 h of TSD, for each of the 3 genes. Data are plotted against the start times of the PVT bouts; placement of the 1-min bins in each test bout is not to scale on the clock time axis. Shaded area: nighttime test bouts during TSD. PVT = psychomotor vigilance test; RT = response time; TSD = total sleep deprivation.
Figure 4
Figure 4
Mean RT (±standard error) in 1-min bins on the 10-min PVT, collapsed over intervals of time awake, for each of the 3 genes. Left panels correspond to the baseline period (09:00–21:59; from 1 up to 14 h wakefulness); middle panels correspond to the nighttime TSD period (23:00–07:59; from 15 up to 23 h wakefulness); right panels correspond to the daytime TSD period (09:00–21:59; from 25 up to 38 h wakefulness). Trend lines are included to depict the general rate of change in RTs across the 10-min PVT. PVT = psychomotor vigilance test; RT = response time; TOT = time-on-task; TSD = total sleep deprivation.
Figure 5
Figure 5
Cumulative relative RT frequency distributions for each gene during the baseline period (left panels) and the daytime TSD period (right panels). Solid curves correspond to performance during the first 5 min (1–5) of the 10-min PVT; dashed curves correspond to performance during the second 5 min (6–10) of the 10-min PVT. The yellow-shaded area contains the fastest RTs; the purple-shaded area shows the heart of the cumulative relative frequency distributions; and the red-shaded area shows the slower RTs or lapse domain (cf. Figure 1, right). PVT = psychomotor vigilance test; RT = response time; TSD = total sleep deprivation.

References

    1. Davies DR, Parasuraman R.. The Psychology of Vigilance. London: Academic Press; 1982.
    1. Lim J, Kwok K. The effects of varying break length on attention and time on task. Hum Factors. 2016; 58(3): 472–481. - PubMed
    1. Hancock PA, Hart SG. Defeating terrorism: what can human factors/ergonomics offer?Ergon Des. 2002; 10(1): 6–16.
    1. McFadden SM, Vimalachandran A, Blackmore E. Factors affecting performance on a target monitoring task employing an automatic tracker. Ergonomics. 2004; 47(3): 257–280. - PubMed
    1. Caldwell JA. Fatigue in aviation. Travel Med Infect Dis. 2005; 3(2): 85–96. - PubMed

Publication types

Substances