. 2017 Apr 28;8(39):65022-65041.
doi: 10.18632/oncotarget.17531. eCollection 2017 Sep 12.

Metabolic characterization and pathway analysis of berberine protects against prostate cancer

Affiliations

Metabolic characterization and pathway analysis of berberine protects against prostate cancer

Xianna Li et al. Oncotarget. .

Abstract

Recent explosion of biological data brings a great challenge for the traditional methods. With increasing scale of large data sets, much advanced tools are required for the depth interpretation problems. As a rapid-developing technology, metabolomics can provide a useful method to discover the pathogenesis of diseases. This study was explored the dynamic changes of metabolic profiling in cells model and Balb/C nude-mouse model of prostate cancer, to clarify the therapeutic mechanism of berberine, as a case study. Here, we report the findings of comprehensive metabolomic investigation of berberine on prostate cancer by high-throughput ultra performance liquid chromatography-mass spectrometry coupled with pattern recognition methods and network pathway analysis. A total of 30 metabolite biomarkers in blood and 14 metabolites in prostate cancer cell were found from large-scale biological data sets (serum and cell metabolome), respectively. We have constructed a comprehensive metabolic characterization network of berberine to protect against prostate cancer. Furthermore, the results showed that berberine could provide satisfactory effects on prostate cancer via regulating the perturbed pathway. Overall, these findings illustrated the power of the ultra performance liquid chromatography-mass spectrometry with the pattern recognition analysis for large-scale biological data sets may be promising to yield a valuable tool that insight into the drug action mechanisms and drug discovery as well as help guide testable predictions.

Keywords: UPLC-Q/TOF-MS; metabolome; metabolomics; pathway analysis; prostate cancer.


Conflict of interest statement

CONFLICTS OF INTEREST The authors declare no competing financial interests.

Figures

Figure 1
Figure 1. Berberine inhibited the proliferation and induced the apoptosis of 22RV1 human prostate cancer cells
(A) Berberine caused the cell morphological changes on 22RV1 human prostate cancer cells. (B) Different concentrations of berberine inhibited the proliferation of 22RV1 human prostate cancer cells for 24 h, 48 h, 72 h and the cell viability was determined by MTT assay. (C) 22RV1 human prostate cancer cells were treated with the concentrations of 50 μM berberine for 24 h, 48 h, 72 h and the cell apoptosis was analyzed with annexin V-FITC/PI staining.
Figure 2
Figure 2. Berberine suppressed 22RV1 prostate cancer cell xenograft growth
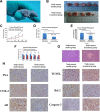
(A) A representative picture of xenograft tumor growth in nude mice subcutaneously inoculated with 22RV1 human prostate cancer cells. (B) Representative tumor among model group and treatment group. (C) The curve of average tumor volume among model group and treatment group during the treatment experimental period. (D) The comparisons of average tumor volume between model group and treatment group for 28 days. (E) The comparisons of average tumor weight between model group and treatment group for 28 days. (F) The comparisons of IOD value of PSA, AR, COX-2, Bcl-2 and Caspase-3 between model group and treatment group. (G) H&E staining of histological evaluation. (Magnification 100×). (H) TUNEL analysis and the expression of PSA, AR, COX-2, Bcl-2 and Caspase-3 in IHC analysis. (Magnification 400×). *P < 0.05, **P < 0.01 vs model group.
Figure 3
Figure 3. Serum metabolomics analysis
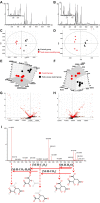
(A) UPLC-Q/TOF-MS/MS BPI serum chromatograms in positive mode; (B) UPLC-Q/TOF-MS/MS BPI serum chromatograms in negative mode; (C) PCA score plots for control and nude-mouse model group in positive mode; (D) PCA score plots for control and nude-mouse model group in negative mode; (E) 3D score plots of OPLS-DA based on serum metabolites discriminating control and nude-mouse model group in positive mode; (F) 3D score plots of OPLS-DA based on serum metabolites discriminating control and nude-mouse model group in negative mode; (G) Serum metabolite biomarkers in the VIP and S-plot between control and nude-mouse model group in positive mode; (H) Serum metabolite biomarkers in the VIP and S-plot between control and nude-mouse model group in negative mode; (I) Chemical structure and mass fragment information of isocitric acid in negative mode.
Figure 4
Figure 4. Pathway and metabolic networks analysis
(A) Pathway analysis with MetaboAnalyst tool; (B) Construction of the altered metabolic network associated prostate cancer model based on KEGG pathway database.
Figure 5
Figure 5. Serum metabolic profiling characterization and multivariate data analysis
(A) 3D score plots of OPLS-DA based on serum metabolites discriminating control group, nude-mouse model group and nude-mouse treatment group in both positive and negative mode; (B) VIP scores of the serum metabolite marker candidates; (C) The heatmap visualization for serum samples from the control, model group and treatment group; (D) Relative signal intensities of the serum metabolites identified by UPLC-Q/TOF-MS/MS.
Figure 6
Figure 6. Cell metabolic profiling characterization and multivariate data analysis
(A) The PCA score plots of 22RV1 prostate cancer cells treatment of berberine at 12 h, 24 h, 36 h, 48 h and 72 h in both positive mode and negative mode; (B) VIP scores of the cell metabolite marker candidates; (C) The heatmap visualization for 22RV1 prostate cancer cell samples from the cell control group and cell treatment group; (D) Relative signal intensities of the cell metabolites identified by UPLC-Q/TOF-MS/MS.
Figure 7
Figure 7. Ingenuity pathways analysis of metabolite biomarkers
(A) Top canonical pathways identified by IPA that are searched of serum metabolites; (B) The biological functions of serum metabolite biomarkers; (C) The biologically active functions network of main serum metabolite biomarkers; (D) IPA analysis reveals a network of signaling pathways searched by serum metabolite biomarkers.

References

    1. Zhang A, Zhou X, Zhao H, Zou S, Ma CW, Liu Q, Sun H, Liu L, Wang X. Metabolomics and proteomics technologies to explore the herbal preparation affecting metabolic disorders using high resolution mass spectrometry. Mol Biosyst. 2017;13:320–329. - PubMed
    1. Zhang T, Zhang A, Qiu S, Sun H, Han Y, Guan Y, Wang X. High-throughput metabolomics approach reveals new mechanistic insights for drug response of phenotypes of geniposide towards alcohol-induced liver injury by using liquid chromatography coupled to high resolution mass spectrometry. Mol Biosyst. 2016;13:73–82. - PubMed
    1. Chu H, Zhang A, Han Y, Lu S, Kong L, Han J, Liu Z, Sun H, Wang X. Metabolomics approach to explore the effects of Kai-Xin-San on Alzheimer’s disease using UPLC/ESI-Q-TOF mass spectrometry. J Chromatogr B Analyt Technol Biomed Life Sci. 2016;1015:50–61. - PubMed
    1. Nan Y, Zhou X, Liu Q, Zhang A, Guan Y, Lin S, Kong L, Han Y, Wang X. Serum metabolomics strategy for understanding pharmacological effects of ShenQi pill acting on kidney yang deficiency syndrome. J Chromatogr B Analyt Technol Biomed Life Sci. 2016;1026:217–26. - PubMed
    1. Zhang A, Yan G, Zhou X, Wang Y, Han Y, Guan Y, Sun H, Wang X. High resolution metabolomics technology reveals widespread pathway changes of alcoholic liver disease. Mol Biosyst. 2016;12:262–73. - PubMed