Clinical Trial
. 2017 Dec 21;130(25):2762-2773.
doi: 10.1182/blood-2017-08-803353. Epub 2017 Oct 13.

Single-cell RNA-seq reveals a distinct transcriptome signature of aneuploid hematopoietic cells

Affiliations
Clinical Trial

Single-cell RNA-seq reveals a distinct transcriptome signature of aneuploid hematopoietic cells

Xin Zhao et al. Blood. .

Abstract

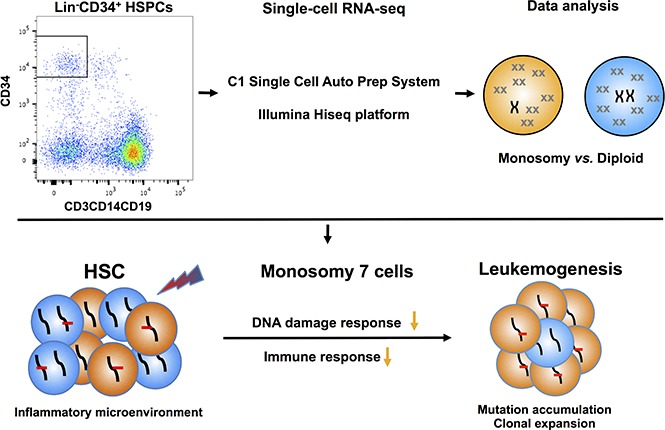
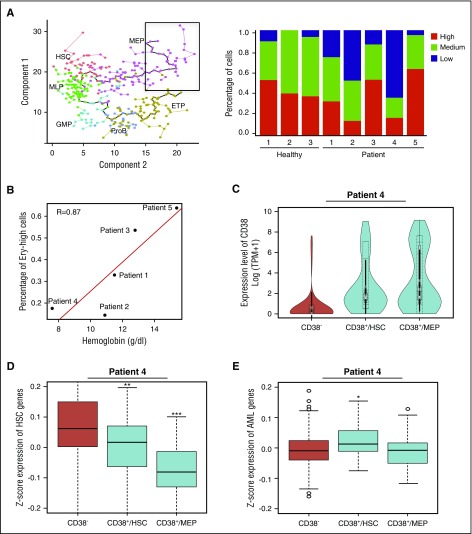
Cancer cells frequently exhibit chromosomal abnormalities. Specific cytogenetic aberrations often are predictors of outcome, especially in hematologic neoplasms, such as monosomy 7 in myeloid malignancies. The functional consequences of aneuploidy at the cellular level are difficult to assess because of a lack of convenient markers to distinguish abnormal from diploid cells. We performed single-cell RNA sequencing (scRNA-seq) to study hematopoietic stem and progenitor cells from the bone marrow of 4 healthy donors and 5 patients with bone marrow failure and chromosome gain or loss. In total, transcriptome sequences were obtained from 391 control cells and 588 cells from patients. We characterized normal hematopoiesis as binary differentiation from stem cells to erythroid and myeloid-lymphoid pathways. Aneuploid cells were distinguished from diploid cells in patient samples by computational analyses of read fractions and gene expression of individual chromosomes. We confirmed assignment of aneuploidy to individual cells quantitatively, by copy-number variation, and qualitatively, by loss of heterozygosity. When we projected patients' single cells onto the map of normal hematopoiesis, diverse patterns were observed, broadly reflecting clinical phenotypes. Patients' monosomy 7 cells showed downregulation of genes involved in immune response and DNA damage checkpoint and apoptosis pathways, which may contribute to the clonal expansion of monosomy 7 cells with accumulated gene mutations. scRNA-seq is a powerful technique through which to infer the functional consequences of chromosome gain and loss and explore gene targets for directed therapy.


Conflict of interest statement

Conflict-of-interest disclosure: The authors declare no competing financial interests.

Figures

None
Graphical abstract
Figure 1.
Figure 1.
Hematopoietic heterogeneity in healthy donors quantified by scRNA-seq. CD34+CD38 and CD34+CD38+ cells from 4 healthy donors (healthy 1-4) were sorted by surface-membrane markers and subjected to analyses. (A) The schematic pipeline consisting of 3 major analytic components: differentiation analysis with cells from healthy donors, identification and characterization of monosomy 7 cells with gene expression, and validation of monosomy identification with loss of reterozygosity (LOH). CNV, copy-number variation; CRE, chromosome relative expression; GATK, Genome Analysis Toolkit. (B) CD38 expression levels in CD34+CD38 and CD34+CD38+ cells. Each dot represents a single cell. y-axis, batch-corrected gene expression levels. (C) Cumulative distribution of fold changes of expression of hematopoietic cell type signature genes between CD34+CD38 and CD34+CD38+ cells. Each dot represents a gene. B-NK, B cell–natural killer cell precursor; CMP, common myeloid progenitor; ETP, earliest thymic progenitor; GMP, granulocyte-monocyte progenitor; MEP, megakaryocytic-erythroid progenitor; MLP, multilymphoid progenitor; ProB, pro–B cell. y-axis, cumulative distribution; x-axis, log (marker gene expression levels in CD34+CD38+ cells/marker gene expression levels in CD34+CD38 cells). (D) t-distributed stochastic neighbor embedding (tSNE) plot of single-cell gene expression data. Single cells from 4 healthy donors (healthy 1-4) are represented by different symbols. Highly variable genes (1024) across all healthy donors were used in tSNE analysis.
Figure 2.
Figure 2.
Detection of CNVs in single cells from patients. (A) Average gene expression for each chromosome in single cells from patients and healthy donors. Average gene expression levels of individual chromosomes from 4 healthy donors were used for comparison. Chromosome mapping read values were median-centered. The top and bottom of the bar represent the 25% and 75% quartiles. (B) Heatmaps of CNV signals obtained by sliding window analysis. scRNA-seq data of patients were normalized against those of healthy donors. Copy-number changes were examined in 22 chromosomes (columns) for patients’ individual cells (rows). (C) CNV signals on chromosome 7 obtained from healthy donors and patient 3 by sliding window analysis. Two black lines show 95% confidence intervals. 7q11-21 and 7q22-36 are indicated in blue and red, respectively. (D) Cytogenetic abnormalities detected by fluorescence in situ hybridization. Probes used to detect specific chromosomes were: CDKN2C and CKS1B for chromosome 1, CEN 8 for chromosome 8, and CEN7 and D7S486 for chromosome 7. (E) Histograms of read ratios on chromosome 7 in patients 1 and 2. Pink, cells from patients; blue, cells from healthy donors; purple, distribution overlap between each patient and healthy donors; y-axis, frequency of cell number; and x-axis, ratios of reads on chromosome 7 in individual cells relative to reads on all chromosomes in the same cell.
Figure 3.
Figure 3.
Hematopoietic differentiation of marrow cells from healthy donors and patients. (A) Ordering of individual cells from 4 healthy donors (colored circles) into a 2-dimensional independent component space of hematopoietic lineages using Monocle. Lines connecting circles indicate edges of the minimum spanning tree (MST). A solid black line shows the main path of the MST, which provides a backbone for pseudotime ordering of cells by Monocol. ETP, earliest thymic progenitor; GMP, granulocyte-monocyte progenitor; MLP, multilymphoid progenitor; ProB, pro–B cell. (B-D) Mapping of patient cells onto normal MST by the nearest neighbor method (averaging locations of 5 nearest cells on the tree). Hollow circles indicate cells with monosomy 7 or del(7q) from patients 1, 2, 3, and 4 (patient 5 had trisomy 8).
Figure 4.
Figure 4.
Impaired hematopoietic differentiation of patients’ cells. (A) Expression of early erythroid maturation genes in MEP cells from healthy donors and patients. Cells encircled in a black box (y location > 15 and x location > 15) in the left panel were analyzed for expression of early erythroid maturation genes; the right panel shows frequency of cells with different expression levels of erythroid genes. Healthy donor 4 was not included because of a limited cell number included in the black square. ETP, earliest thymic progenitor; GMP, granulocyte-monocyte progenitor; MLP, multilymphoid progenitor; ProB, pro–B cell. (B) Correlation of erythroid gene expression levels with hemoglobin concentration. Patient 2 had a hemoglobin concentration of 10.9 g/dL at time of marrow sample collection, which decreased to 9 g/dL 3 months later. (C) CD38 expression levels in cells of patient 4. CD38, CD34+CD38 cells; CD38+/HSC, CD34+CD38+ cells within the HSC/MLP population (x location < 10 on minimum spanning tree ); and CD38+/MEP, CD34+CD38+ cells within the MEP population (x location ≥ 10). (D-E) Expression levels of HSC genes or AML genes in cells of patient 4. *P < .05, **P < .01, and ***P < .001.
Figure 5.
Figure 5.
Downregulated genes and increased SNP frequencies in monosomy 7 cells. (A) Venn diagram of downregulated genes in patients 1 and 2 and patient 4 MEP. Patient 4 MEP cells were defined as cells that clustered to the MEP population from supplemental Figure 7D. Numbers in brackets indicate genes located on chromosome 7. (B) Downregulated genes in monosomy 7 CD34+ cells in patients 1 and 2 and patient 4 MEP (P < .05) were combined and subjected to network construction. Genes involved in different signaling pathway groups are highlighted in different border colors. Genes on chromosome 7 are highlighted in red. (C) The number of SNPs per cell in patient 4. CD38, CD34+CD38 cells; CD38+/HSC, CD34+CD38+ cells within the HSC/multilymphoid progenitor population (x location < 10 on MST); and CD38+/MEP, CD34+CD38+ cells within the MEP population (x location ≥ 10).
Figure 6.
Figure 6.
Proposed mechanism of clonal expansion and DNA damage accumulation in monosomy 7 cells. DNA damage from multiple environmental and intrinsic sources activates DNA damage response, resulting in a number of cellular responses, such as induction of cell-cycle arrest and repair of the lesions. In case of irreparable damage, cells undergo senescence or apoptosis. HSPCs are under an inflammatory microenvironment in BMF, resulting in dysregulated apoptosis signaling (this part of figure is adapted from Gañán-Gómez et al). The frequently overexpressed and/or constitutively activated transmembrane receptors (Fas, tumor necrosis factor [TNF] receptor 1 [TNFR1], TNFR2, Toll-like receptors [TLRs], and interferon-γ (IFN-γ) receptor [IFNGR]), their associated signal transducers, and recruited T cells induce apoptosis of HSCs through different signaling pathways. Dysregulated pathways or genes in monosomy 7 cells are highlighted in orange. Failure to repair DNA damage as well as impaired response to immune signaling in monosomy 7 cells might result in DNA damage accumulation and clonal expansion, and finally lead to leukemogenesis.

Comment in

References

    1. Brennan CW, Verhaak RG, McKenna A, et al. ; TCGA Research Network. The somatic genomic landscape of glioblastoma [published correction appears in Cell. 2014;157(3):753]. Cell. 2013;155(2):462-477. - PMC - PubMed
    1. Arber DA, Orazi A, Hasserjian R, et al. . The 2016 revision to the World Health Organization classification of myeloid neoplasms and acute leukemia. Blood. 2016;127(20):2391-2405. - PubMed
    1. Klatte T, Rao PN, de Martino M, et al. . Cytogenetic profile predicts prognosis of patients with clear cell renal cell carcinoma. J Clin Oncol. 2009;27(5):746-753. - PubMed
    1. Panani AD, Roussos C. Cytogenetic and molecular aspects of lung cancer. Cancer Lett. 2006;239(1):1-9. - PubMed
    1. Crawley JJ, Furge KA. Identification of frequent cytogenetic aberrations in hepatocellular carcinoma using gene-expression microarray data. Genome Biol. 2002;3(12):RESEARCH0075. - PMC - PubMed

Publication types

Supplementary concepts