

Association Between QT-Interval Components and Sudden Cardiac Death: The ARIC Study (Atherosclerosis Risk in Communities)
- PMID: 29030380
- PMCID: PMC5659833
- DOI: 10.1161/CIRCEP.117.005485
Association Between QT-Interval Components and Sudden Cardiac Death: The ARIC Study (Atherosclerosis Risk in Communities)
Abstract
Background: Several reports have demonstrated that prolongation of the QT interval is associated with sudden cardiac death (SCD). However, it is unknown whether any of the components within the QT interval are responsible for its association with SCD.
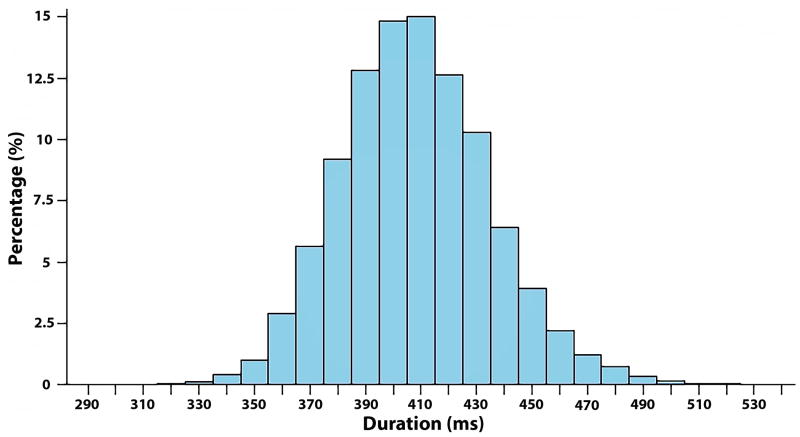
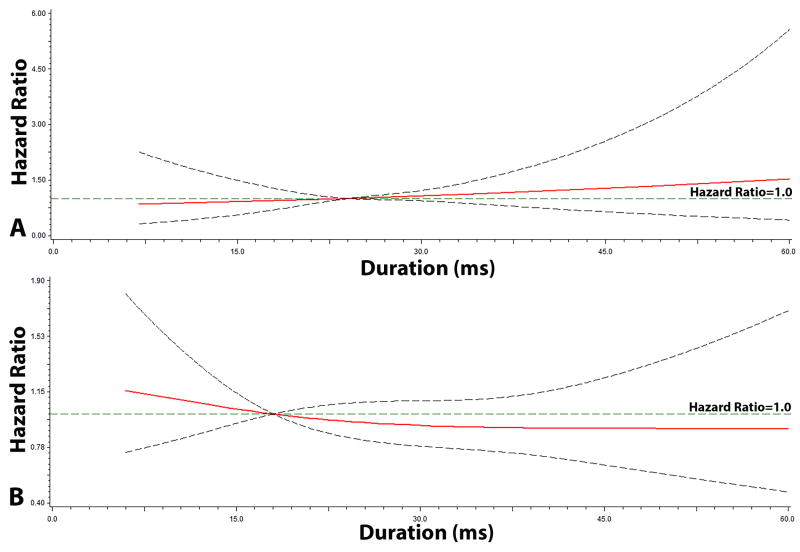
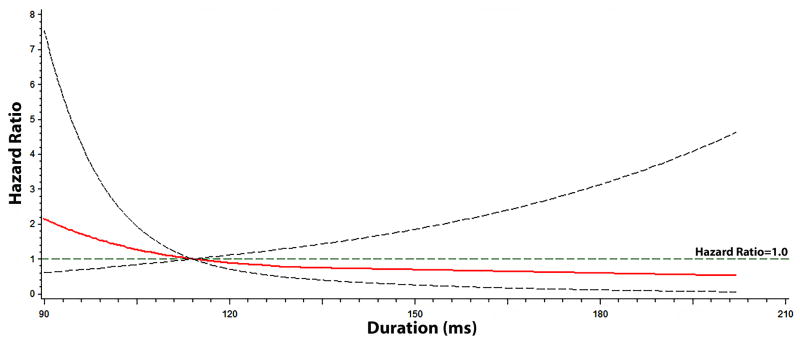
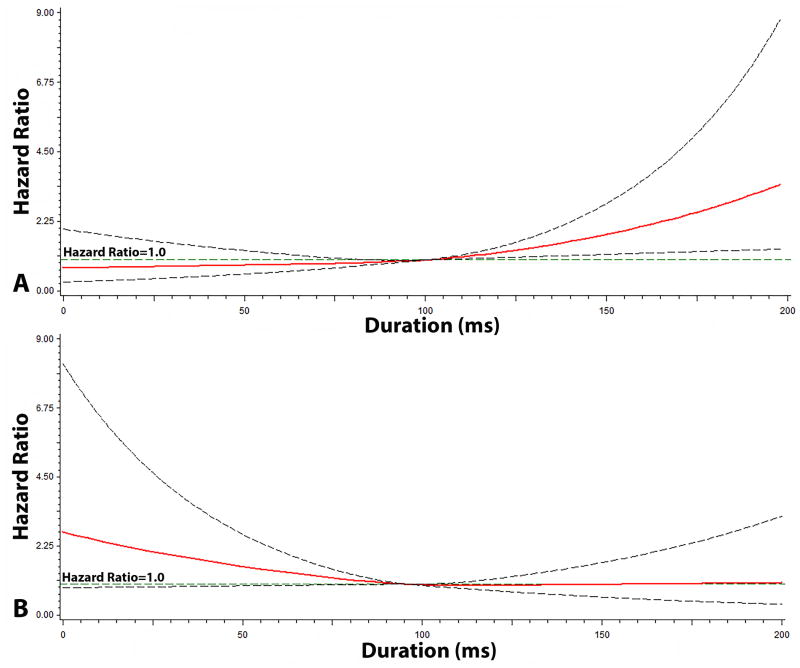
Methods and results: We examined the association of the individual QT-interval components (R-wave onset to R-peak, R-peak to R-wave end, ST-segment, T-wave onset to T-peak, and T-peak to T-wave end) with SCD in 12 241 participants (54±5.7 years; 26% black; 55% women) from the ARIC study (Atherosclerosis Risk in Communities). The QT interval and its components were measured at baseline (1987-1989) from 12-lead ECGs. SCD cases were adjudicated by a group of physicians through December 31, 2012. During a median follow-up of 23.6 years, a total of 346 cases of SCD were identified. Although prolongation of the QT interval was associated with a 49% increased risk of SCD (hazard ratio, 1.49; 95% confidence interval, 1.01-2.18), only the T-wave onset to T-peak component (per 1-SD increase: hazard ratio, 1.19; 95% confidence interval, 1.06-1.34) was associated with SCD and not any of the other components in separate models. When all of the QT-interval components were included in the same model, T-wave onset to T-peak remained the strongest predictor of SCD (per 1-SD increase: hazard ratio, 1.21; 95% confidence interval, 1.06-1.37).
Conclusions: The risk of SCD with the QT interval is driven by prolongation of the T-wave onset to T-peak component. This suggests that shifting the focus from the overall QT interval to its individual components will refine SCD prediction in the community.
Keywords: death, sudden, cardiac; follow-up studies; humans; risk.
© 2017 American Heart Association, Inc.
Figures
Comment in
-
Risk Stratification for Sudden Cardiac Death in Individuals Without Structural Disease: Implications From Studies of Rare Genetic Arrhythmic Disorders.Circ Arrhythm Electrophysiol. 2017 Oct;10(10):e005774. doi: 10.1161/CIRCEP.117.005774. Circ Arrhythm Electrophysiol. 2017. PMID: 29030381 No abstract available.
References
-
- Algra A, Tijssen JG, Roelandt JR, Pool J, Lubsen J. QTc prolongation measured by standard 12-lead electrocardiography is an independent risk factor for sudden death due to cardiac arrest. Circulation. 1991;83:1888–94. - PubMed
-
- Straus SM, Kors JA, De Bruin ML, van der Hooft CS, Hofman A, Heeringa J, Deckers JW, Kingma JH, Sturkenboom MC, Stricker BH, Witteman JC. Prolonged QTc interval and risk of sudden cardiac death in a population of older adults. J Am Coll Cardiol. 2006;47:362–7. - PubMed
-
- Yan GX, Antzelevitch C. Cellular basis for the normal T wave and the electrocardiographic manifestations of the long-QT syndrome. Circulation. 1998;98:1928–36. - PubMed
Publication types
MeSH terms
Grants and funding
- HHSN268201100012C/HL/NHLBI NIH HHS/United States
- HHSN268201100009I/HL/NHLBI NIH HHS/United States
- HHSN268201100010C/HL/NHLBI NIH HHS/United States
- HHSN268201100008C/HL/NHLBI NIH HHS/United States
- HHSN268201100007C/HL/NHLBI NIH HHS/United States
- HHSN268201100011I/HL/NHLBI NIH HHS/United States
- HHSN268201100011C/HL/NHLBI NIH HHS/United States
- F32 HL134290/HL/NHLBI NIH HHS/United States
- HHSN268201100005I/HL/NHLBI NIH HHS/United States
- HHSN268201100007I/HL/NHLBI NIH HHS/United States
- HHSN268201100005G/HL/NHLBI NIH HHS/United States
- HHSN268201100008I/HL/NHLBI NIH HHS/United States
- HHSN268201100006C/HL/NHLBI NIH HHS/United States
- R01 HL118277/HL/NHLBI NIH HHS/United States
- HHSN268201100009C/HL/NHLBI NIH HHS/United States
- HHSN268201100005C/HL/NHLBI NIH HHS/United States
- R01 HL111089/HL/NHLBI NIH HHS/United States
- R01 HL116747/HL/NHLBI NIH HHS/United States
LinkOut - more resources
Full Text Sources
Other Literature Sources
Medical
