

Quantitative time-course metabolomics in human red blood cells reveal the temperature dependence of human metabolic networks
- PMID: 29030425
- PMCID: PMC5712598
- DOI: 10.1074/jbc.M117.804914
Quantitative time-course metabolomics in human red blood cells reveal the temperature dependence of human metabolic networks
Abstract
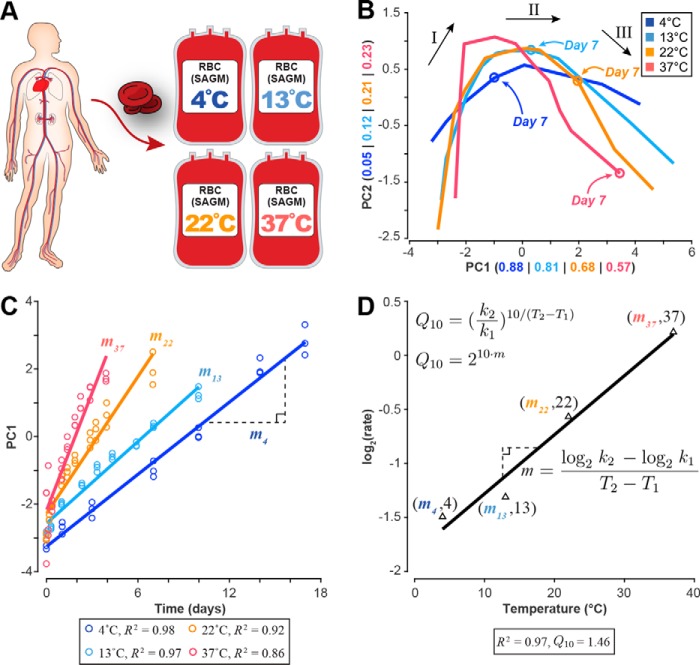
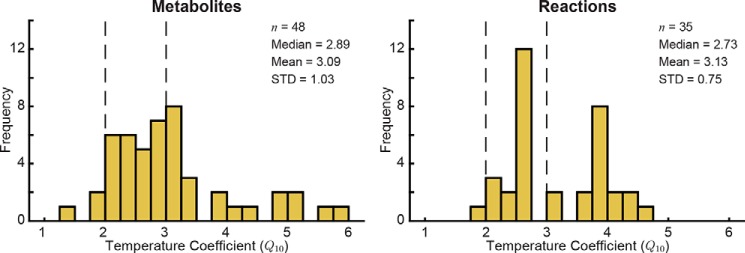
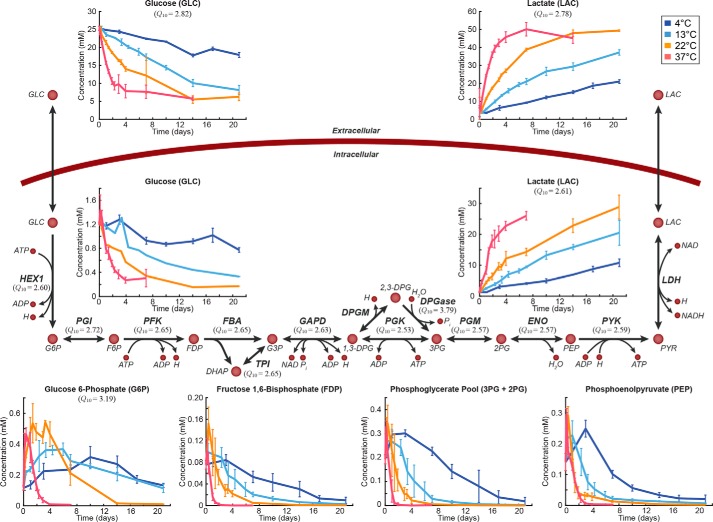
The temperature dependence of biological processes has been studied at the levels of individual biochemical reactions and organism physiology (e.g. basal metabolic rates) but has not been examined at the metabolic network level. Here, we used a systems biology approach to characterize the temperature dependence of the human red blood cell (RBC) metabolic network between 4 and 37 °C through absolutely quantified exo- and endometabolomics data. We used an Arrhenius-type model (Q10) to describe how the rate of a biochemical process changes with every 10 °C change in temperature. Multivariate statistical analysis of the metabolomics data revealed that the same metabolic network-level trends previously reported for RBCs at 4 °C were conserved but accelerated with increasing temperature. We calculated a median Q10 coefficient of 2.89 ± 1.03, within the expected range of 2-3 for biological processes, for 48 individual metabolite concentrations. We then integrated these metabolomics measurements into a cell-scale metabolic model to study pathway usage, calculating a median Q10 coefficient of 2.73 ± 0.75 for 35 reaction fluxes. The relative fluxes through glycolysis and nucleotide metabolism pathways were consistent across the studied temperature range despite the non-uniform distributions of Q10 coefficients of individual metabolites and reaction fluxes. Together, these results indicate that the rate of change of network-level responses to temperature differences in RBC metabolism is consistent between 4 and 37 °C. More broadly, we provide a baseline characterization of a biochemical network given no transcriptional or translational regulation that can be used to explore the temperature dependence of metabolism.
Keywords: computational biology; erythrocyte; metabolism; metabolomics; systems biology.
© 2017 by The American Society for Biochemistry and Molecular Biology, Inc.
Conflict of interest statement
The authors declare that they have no conflicts of interest with the contents of this article
Figures
References
-
- van't Hoff J. H., Cohen E., and Ewan T. (1896) Studies in Chemical Dynamics, pp. 130–136, Frederick Muller and Co., Amsterdam
-
- Behradek J. (1930) Temperature coefficients in biology. Biol. Rev. Camb. Philos. Soc. 5, 30–58
-
- Elias M., Wieczorek G., Rosenne S., and Tawfik D. S. (2014) The universality of enzymatic rate-temperature dependency. Trends Biochem. Sci. 39, 1–7 - PubMed
Publication types
MeSH terms
Grants and funding
LinkOut - more resources
Full Text Sources
Other Literature Sources
