. 2017 Dec 8;292(49):20313-20327.
doi: 10.1074/jbc.M117.802736. Epub 2017 Oct 13.

A retractable lid in lecithin:cholesterol acyltransferase provides a structural mechanism for activation by apolipoprotein A-I

Affiliations

A retractable lid in lecithin:cholesterol acyltransferase provides a structural mechanism for activation by apolipoprotein A-I

Kelly A Manthei et al. J Biol Chem. .

Abstract

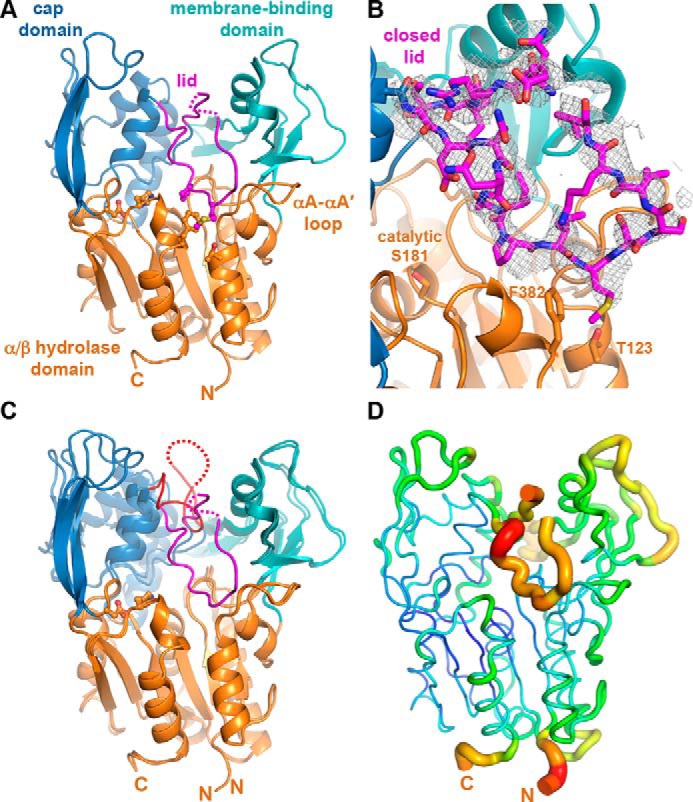
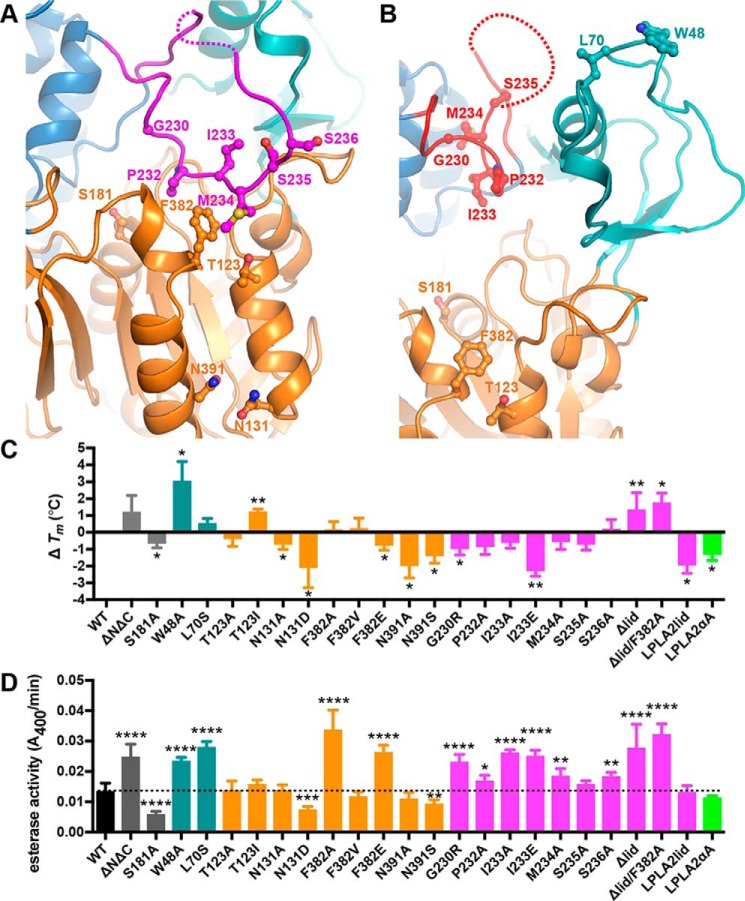
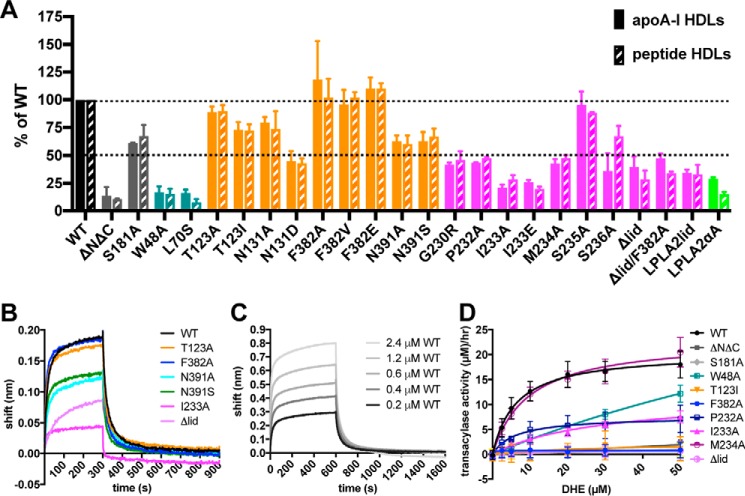
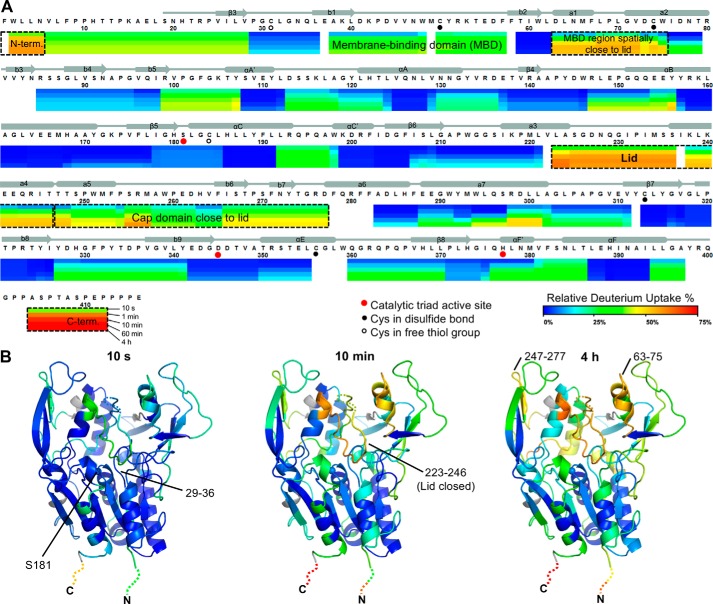
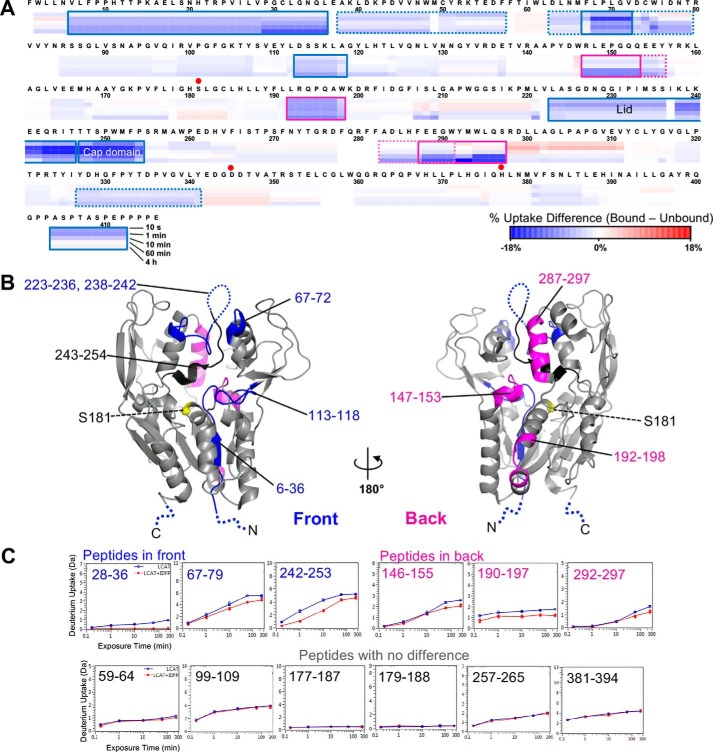
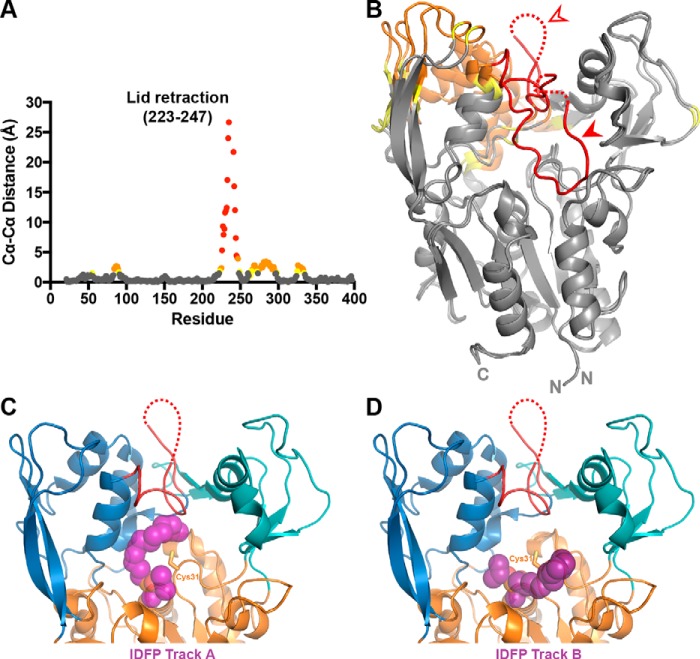
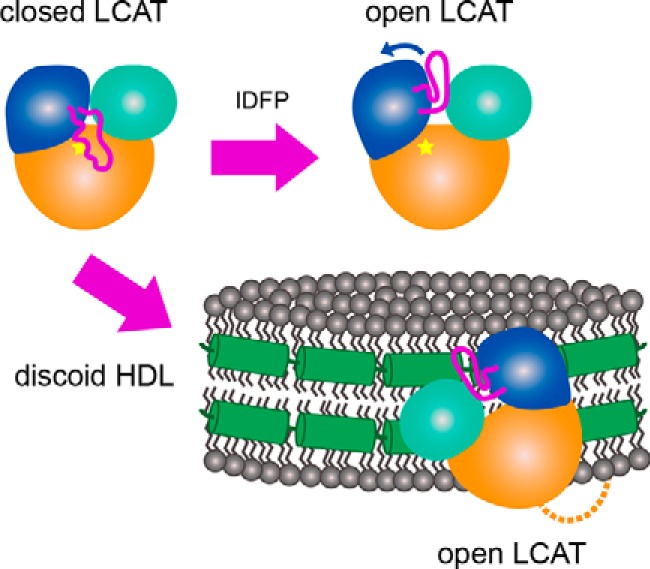
Lecithin:cholesterol acyltransferase (LCAT) plays a key role in reverse cholesterol transport by transferring an acyl group from phosphatidylcholine to cholesterol, promoting the maturation of high-density lipoproteins (HDL) from discoidal to spherical particles. LCAT is activated through an unknown mechanism by apolipoprotein A-I (apoA-I) and other mimetic peptides that form a belt around HDL. Here, we report the crystal structure of LCAT with an extended lid that blocks access to the active site, consistent with an inactive conformation. Residues Thr-123 and Phe-382 in the catalytic domain form a latch-like interaction with hydrophobic residues in the lid. Because these residues are mutated in genetic disease, lid displacement was hypothesized to be an important feature of apoA-I activation. Functional studies of site-directed mutants revealed that loss of latch interactions or the entire lid enhanced activity against soluble ester substrates, and hydrogen-deuterium exchange (HDX) mass spectrometry revealed that the LCAT lid is extremely dynamic in solution. Upon addition of a covalent inhibitor that mimics one of the reaction intermediates, there is an overall decrease in HDX in the lid and adjacent regions of the protein, consistent with ordering. These data suggest a model wherein the active site of LCAT is shielded from soluble substrates by a dynamic lid until it interacts with HDL to allow transesterification to proceed.

Keywords: HDX MS; acyltransferase; apolipoprotein; cholesterol; conformational change; crystallography; high-density lipoprotein (HDL); inhibitor; lecithin; structural biology.


Conflict of interest statement

J. A., C. L., and M. J. A. declare that they are employees of MedImmune, the global biologics R&D arm of AstraZeneca, and own stock/stock options in AstraZeneca

Figures

Figure 1.
Figure 1.
LCAT has a lid that shields the active site. A, 3.1-Å X-ray crystal structure of LCAT in a closed, extended lid conformation. Residues 240–241 (dashed line) were not modeled. Side chains of assayed residues in the lid, lid latch, and catalytic triad are shown as ball and stick models. B, |Fo| − |Fc| omit map contoured at 2 σ for the LCAT lid (residues 226–246). C, closed conformation overlaid with the open-2Fab LCAT structure (PDB entry 5BV7), with red lid and unmodeled residues 236–242 indicated with a dashed line. D, closed lid structure shown using the B-factor putty representation in PyMOL. The blue to green coloring and small tube width indicates lower B-factors, and the yellow to red coloring and wide tube indicates higher B-factors.
Figure 2.
Figure 2.
Disruption of the lid and its interactions with the catalytic core enhances LCAT esterase activity. A and B, close-up view of LCAT, highlighting residues examined in biochemical studies from our closed (A) and the open-2Fab (B) structures. C, change in Tm relative to WT LCAT as measured by DSF. Error bars are the S.D. of at least three independent experiments performed in triplicate (see supplemental Table S1). (*, 0.01 < p < 0.05; **, 0.001 < p < 0.01 via two-tailed t test). D, soluble esterase activity. pNPB hydrolysis is shown for each variant. The dashed line indicates the rate of WT LCAT for ease of comparison. Error bars represent the standard deviation (S.D.) of at least three independent experiments. (*, 0.01 < p < 0.05; **, 0.001 < p < 0.01; ***, p < 0.001; ****, p < 0.0001 via a two-tailed t test).
Figure 3.
Figure 3.
HDL binding and activity defects in LCAT variants. A, maximal response for LCAT variants binding to HDLs made with apoA-I (solid) or peptide HDLs (dashed) normalized with respect to WT LCAT. B, representative BLI data used for generation of binding analysis in A. A single experiment is depicted with apoA-I HDLs and all LCAT variants at 0.2 μm. C, WT LCAT analyzed with apoA-I HDLs at different concentrations to determine Kd values. D, most LCAT variants have defects in DHE-ester formation. Acyltransferase data for a subset of LCAT variants at 7.5 μg/ml mixed with peptide HDLs containing DHE.
Figure 4.
Figure 4.
LCAT dynamics using HDX MS. A, relative deuterium uptake is shown using a color gradient for each of the five different time points. The most dynamic regions are highlighted using dashed boxes. Most of the α/β hydrolase domain, including catalytic triad residues (Ser-181, Asp-345, and His-377, red dots), has a relatively rigid conformation. B, relative percent deuterium uptake is mapped on the closed structure at 10 s, 10 min, and 4 h with the same coloring as in A. The N and C termini are not observed in the crystal structures but are indicated with dashed lines colored to show their relative deuterium uptake.
Figure 5.
Figure 5.
HDX MS differential heat map due to IDFP binding mapped on the primary and tertiary structures of LCAT. A, differences in deuterium uptake between IDFP-bound and unbound LCAT by sequence. The blue color in the sequence heat map represents decreased deuterium uptake upon IDFP binding. B, differences mapped on the open-2Fab structure (PBD entry 5BV7). The location of peptides with increased protection are indicated in magenta for the back of LCAT, and in blue and black for the front. Residues 243–254 (black) exhibited the highest degree of protection. The position of Ser-181 is indicated by a yellow sphere. C, examples of individual peptide deuterium uptake plots.
Figure 6.
Figure 6.
Changes associated with lid-opening and IDFP binding. A, changes in Cα–Cα distance are graphed for residues between our closed LCAT structure and the open-2Fab structure, aligned on their α/β hydrolase domains. There is a gap in the plot due to unmodeled residues in the two compared crystal structures (residues 236–240). Residues with Cα–Cα differences above 4 Å are colored in red, distances between 2 and 4 Å in orange, and distances 1.5 and 2 Å in yellow. B, Cα–Cα distances from A mapped onto the structures with the same color scheme. The filled arrowhead points to the closed lid, and the open arrowhead points to the open lid. C and D, IDFP-bound LPLA2 (PDB code 4X91) was aligned with the open-2Fab structure using PyMOL. The two tracks observed for IDFP, as observed in the LPLA2 structure, are shown with track A in C and track B in D. IDFP is modeled as purple spheres bound to the active-site serine.
Figure 7.
Figure 7.
A model describing the proposed conformational change induced by IDFP and HDL. In solution, LCAT is in a closed state (top left) where the dynamic lid is extended over the active site (indicated by the star). As IDFP or other large hydrophobic molecules bind, we propose that the lid retracts into an open conformation (top right). The bottom arrow indicates HDL binding, which based on these data would involve the N-terminal region (dashed line), lid (magenta), and membrane-binding domain (teal). LCAT would then be positioned such that the hydrophobic active site is exposed to HDL to extract substrate for acyl transfer. The specific region of LCAT that contacts apoA-I (green helices) on HDL is unknown.

References

    1. Calabresi L., Simonelli S., Gomaraschi M., and Franceschini G. (2012) Genetic lecithin:cholesterol acyltransferase deficiency and cardiovascular disease. Atherosclerosis 222, 299–306 - PubMed
    1. Glomset J. A. (1968) The plasma lecithins:cholesterol acyltransferase reaction. J. Lipid Res. 9, 155–167 - PubMed
    1. Chen C. H., and Albers J. J. (1982) Distribution of lecithin-cholesterol acyltransferase (LCAT) in human plasma lipoprotein fractions. Evidence for the association of active LCAT with low-density lipoproteins. Biochem. Biophys. Res. Commun. 107, 1091–1096 - PubMed
    1. Zhao Y., Thorngate F. E., Weisgraber K. H., Williams D. L., and Parks J. S. (2005) Apolipoprotein E is the major physiological activator of lecithin-cholesterol acyltransferase (LCAT) on apolipoprotein B lipoproteins. Biochemistry 44, 1013–1025 - PubMed
    1. Kuivenhoven J. A., Pritchard H., Hill J., Frohlich J., Assmann G., and Kastelein J. (1997) The molecular pathology of lecithin:cholesterol acyltransferase (LCAT) deficiency syndromes. J. Lipid Res. 38, 191–205 - PubMed

Publication types

MeSH terms

Substances

LinkOut - more resources