Household triclosan and triclocarban effects on the infant and maternal microbiome
- PMID: 29030459
- PMCID: PMC5709730
- DOI: 10.15252/emmm.201707882
Household triclosan and triclocarban effects on the infant and maternal microbiome
Abstract
In 2016, the US Food and Drug Administration banned the use of specific microbicides in some household and personal wash products due to concerns that these chemicals might induce antibiotic resistance or disrupt human microbial communities. Triclosan and triclocarban (referred to as TCs) are the most common antimicrobials in household and personal care products, but the extent to which TC exposure perturbs microbial communities in humans, particularly during infant development, was unknown. We conducted a randomized intervention of TC-containing household and personal care products during the first year following birth to characterize whether TC exposure from wash products perturbs microbial communities in mothers and their infants. Longitudinal survey of the gut microbiota using 16S ribosomal RNA amplicon sequencing showed that TC exposure from wash products did not induce global reconstruction or loss of microbial diversity of either infant or maternal gut microbiotas. Broadly antibiotic-resistant species from the phylum Proteobacteria, however, were enriched in stool samples from mothers in TC households after the introduction of triclosan-containing toothpaste. When compared by urinary triclosan level, agnostic to treatment arm, infants with higher triclosan levels also showed an enrichment of Proteobacteria species. Despite the minimal effects of TC exposure from wash products on the gut microbial community of infants and adults, detected taxonomic differences highlight the need for consumer safety testing of antimicrobial self-care products on the human microbiome and on antibiotic resistance.
Keywords: antibiotic; microbiome; resistance; triclosan.
© 2017 The Authors. Published under the terms of the CC BY 4.0 license.
Figures


PCoA of Bray–Curtis dissimilarity for all (n = 221) samples shows that gut communities cluster by mothers and infants.
PCoA separated by time and treatment.


Hierarchical clustering of Canberra distances shows that maternal samples from a given individual throughout the first year of life are more self‐similar than other household mothers at the same visit. The colors are representative of a single household, labeled by household and visit (B1 = 2 months, B2 = 6 months, B3 = 10 months), and node colors reflect TC grouping (red = nTC, blue = TC).
PCoA of Canberra distances shows 9.3% of the variance is explained by the first two principal components and the absence of TC treatment clustering for any visit among mothers.

- A–D
PCoA with Bray–Curtis dissimilarity of the infants at 2 months of age suggests factors known to impact the microbiome, such as (A) birth method (PERMANOVA R 2 = 0.0683, P = 0.011) and (B) formula (R 2 = 0.128, P = 0.041) drive minimal variation. However, (C) maternal ethnicity (R 2 = 0.0274, P = 0.505) and (D) pets (R 2 = 0.0310, P = 0.393) in the household are not sufficient to distinguish the infants at 2 months of age.


- A
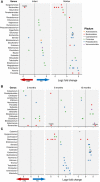
Differentially abundant taxa between nTC and TC households. Values left of the gray line indicate an enrichment in nTC household and values to the right indicate an enrichment in TC households. Analyses are separated by mothers and infants for all samples across the three time points (FDR‐adjusted P‐value < 0.01).
- B, C
Differentially abundant taxa are displayed for (B) infants and (C) mothers at per visit (FDR‐adjusted P‐value < 0.05).

References
-
- Braoudaki M, Hilton AC (2004) Low level of cross‐resistance between triclosan and antibiotics in Escherichia coli K‐12 and E. coli O55 compared to E. coli O157. FEMS Microbiol Lett 235: 305–309 - PubMed
Publication types
MeSH terms
Substances
Grants and funding
LinkOut - more resources
Full Text Sources
Other Literature Sources
Medical

