Single-cell RNA sequencing reveals developmental heterogeneity among early lymphoid progenitors
- PMID: 29030486
- PMCID: PMC5730887
- DOI: 10.15252/embj.201797105
Single-cell RNA sequencing reveals developmental heterogeneity among early lymphoid progenitors
Abstract
Single-cell RNA sequencing is a powerful technology for assessing heterogeneity within defined cell populations. Here, we describe the heterogeneity of a B220+CD117intCD19-NK1.1- uncommitted hematopoietic progenitor having combined lymphoid and myeloid potential. Phenotypic and functional assays revealed four subpopulations within the progenitor with distinct lineage developmental potentials. Among them, the Ly6D+SiglecH-CD11c- fraction was lymphoid-restricted exhibiting strong B-cell potential, whereas the Ly6D-SiglecH-CD11c- fraction showed mixed lympho-myeloid potential. Single-cell RNA sequencing of these subsets revealed that the latter population comprised a mixture of cells with distinct lymphoid and myeloid transcriptional signatures and identified a subgroup as the potential precursor of Ly6D+SiglecH-CD11c- Subsequent functional assays confirmed that B220+CD117intCD19-NK1.1- single cells are, with rare exceptions, not bipotent for lymphoid and myeloid lineages. A B-cell priming gradient was observed within the Ly6D+SiglecH-CD11c- subset and we propose a herein newly identified subgroup as the direct precursor of the first B-cell committed stage. Therefore, the apparent multipotency of B220+CD117intCD19-NK1.1- progenitors results from underlying heterogeneity at the single-cell level and highlights the validity of single-cell transcriptomics for resolving cellular heterogeneity and developmental relationships among hematopoietic progenitors.
Keywords: hematopoiesis; heterogeneity; lineage priming; multipotentiality; single‐cell RNA sequencing.
© 2017 The Authors.
Figures

- A
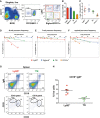
Representative FACS plots of EPLM from the bone marrow of WT mice with the addition of Ly6D, SiglecH, and CD11c identifying four subpopulations.
- B, C
Percentages (B) and absolute numbers (C) of WT EPLM subpopulations (n = 5).
- D–F
In vitro limiting dilution analysis of Ly6D+, TN, SiglecH+, and CD11c+ for B‐cell (D), T‐cell (E), or myeloid (F) potentials.
- G, H
B‐cell reconstitution of sub‐lethally irradiated Rag2‐deficient mice with 4 × 10³ Ly6D+ (n = 5) or TN (n = 4) cells from WT. (G) Representative FACS plots from spleens of reconstituted mice. (H) Quantification of CD19+IgM+ splenocytes.

- A
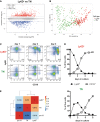
Representative FACS plots of EPLM from the bone marrow of Flt3Ltg mice with the addition of Ly6D, SiglecH, and CD11c identifying four subpopulations.
- B, C
Comparison of EPLM subpopulations from WT (n = 5, circles) and Flt3Ltg (n = 5, squares) mice in percentages (B) or absolute numbers (C).
- D–F
B‐cell, T‐cell, and myeloid precursor frequencies of EPLM subpopulations from Flt3Ltg mice obtained by limiting dilution performed as in Fig 1.

- A
Gene expression ratio of Ly6D+ versus TN cells from Flt3Ltg (vertical axis) plotted against the average expression intensity (horizontal axis), showing 1,008 differentially expressed genes (DEG, stars): 493 highly expressed in Ly6D+ (Up, red) and 515 highly expressed in TN (Down, blue) identified by bulk RNA‐seq (n = 4).
- B
PCA of 152 Ly6D+ and 213 TN single cells from Flt3Ltg using as gene set the DEG identified in (A) and colored according to the cell type. Average gene expression was centered to zero.
- C, D
Kinetics of CD19+ and Ly6D+ EPLM generation in vitro. (C) Ly6D/CD19 FACS plots of the in vitro progeny of Ly6D+ (upper row) and TN EPLM (lower row) at days 1–3 after initiation of culture. Cells shown are SiglecH−CD11c−NK1.1−. (D) Kinetics of Ly6D+ EPLM and CD19+ cell generation in vitro from Ly6D+ (top graph) and TN EPLM (bottom graph).
- E
Heatmap with pairwise Pearson's transcriptome correlation of Ly6D+, TN, and pro‐B averaged populations (bulk RNA‐seq, n = 4).

- A
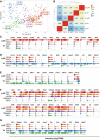
PCA generated as in Fig 3B showing the subgroups revealed by PAM clustering method (see Materials and Methods). Circles: Ly6D+, triangles: TN. G1 Ly6D+ (n = 56), G2 Ly6D+ (n = 82), G3 TN (n = 85), G4 TN (n = 52), G5 TN (n = 56).
- B
Heatmap with pairwise Pearson's transcriptome correlation of Ly6D+ and TN subgroups. The number of cells (n) per subgroup is specified in (A).
- C–G
Violin plots with genes highly expressed in G1 Ly6D+ (C), G4 TN (D), G5 TN (E), (G1, G2) Ly6D+ and G3 TN (F), or G4 and G5 TN (G) subgroups compared to the other subgroups. The median expression level is shown with a line when more than 50% of the cells express the indicated gene.

- A
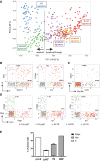
Same PCA plot as in Fig 4A summarizing the genetic signatures of the Ly6D+ and TN subgroups revealed by our in silico analysis.
- B–D
Scatter plots showing the expression levels in log2FPKM of selected B and T (B), neutrophil (Neu) and monocyte/macrophages (Mo/Mc) (C) or myeloid (Mye) and lymphoid (Lym) (D) lineage marker pairs in the Ly6D+ and TN subpopulations. Dotted vertical and horizontal lines delimit when the transcript of the indicated gene is detected (> 0). Percentages within the double‐positive area of the plot indicate the fraction of cells co‐expressing both genes to the number of cells expressing only one gene (top: gene on vertical axis; bottom: gene on horizontal axis).
- E
B‐cell, myeloid, and bipotent (B/Mye) developmental potential of the indicated single‐cell sorted populations from Flt3Ltg. Three independent experiments were performed for Ly6D+ and TN cells and one for the control pro‐B and GMP cells. Shown is mean ± SEM.
Comment in
-
Don't judge a cell by its cover: heterogeneity within early lymphoid progenitors.EMBO J. 2017 Dec 15;36(24):3552-3554. doi: 10.15252/embj.201798443. Epub 2017 Nov 30. EMBO J. 2017. PMID: 29192121 Free PMC article.
References
-
- Adolfsson J, Mansson R, Buza‐Vidas N, Hultquist A, Liuba K, Jensen CT, Bryder D, Yang L, Borge OJ, Thoren LA, Anderson K, Sitnicka E, Sasaki Y, Sigvardsson M, Jacobsen SE (2005) Identification of Flt3+ lympho‐myeloid stem cells lacking erythro‐megakaryocytic potential a revised road map for adult blood lineage commitment. Cell 121: 295–306 - PubMed
-
- Akashi K, Traver D, Miyamoto T, Weissman IL (2000) A clonogenic common myeloid progenitor that gives rise to all myeloid lineages. Nature 404: 193–197 - PubMed
-
- Balciunaite G, Ceredig R, Massa S, Rolink AG (2005) A B220+ CD117+ CD19− hematopoietic progenitor with potent lymphoid and myeloid developmental potential. Eur J Immunol 35: 2019–2030 - PubMed
-
- Barrett T, Wilhite SE, Ledoux P, Evangelista C, Kim IF, Tomashevsky M, Marshall KA, Phillippy KH, Sherman PM, Holko M, Yefanov A, Lee H, Zhang N, Robertson CL, Serova N, Davis S, Soboleva A (2013) NCBI GEO: archive for functional genomics data sets–update. Nucleic Acids Res 41: D991–D995 - PMC - PubMed
Publication types
MeSH terms
LinkOut - more resources
Full Text Sources
Other Literature Sources
Medical
Molecular Biology Databases
Research Materials

