. 2017 Oct 13;8(1):909.
doi: 10.1038/s41467-017-00867-z.

Inference of RNA decay rate from transcriptional profiling highlights the regulatory programs of Alzheimer's disease

Affiliations

Inference of RNA decay rate from transcriptional profiling highlights the regulatory programs of Alzheimer's disease

Rached Alkallas et al. Nat Commun. .

Erratum in

Abstract

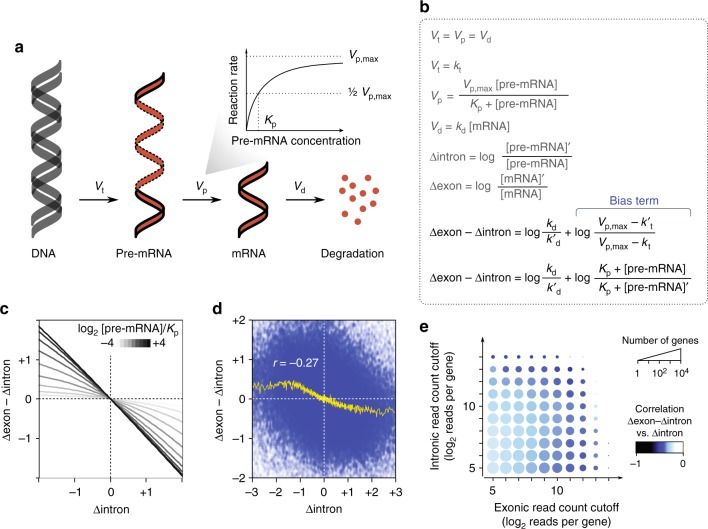
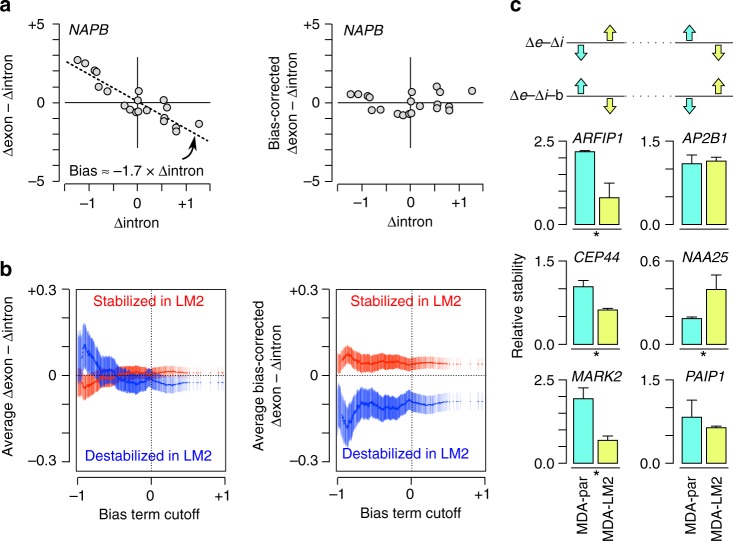
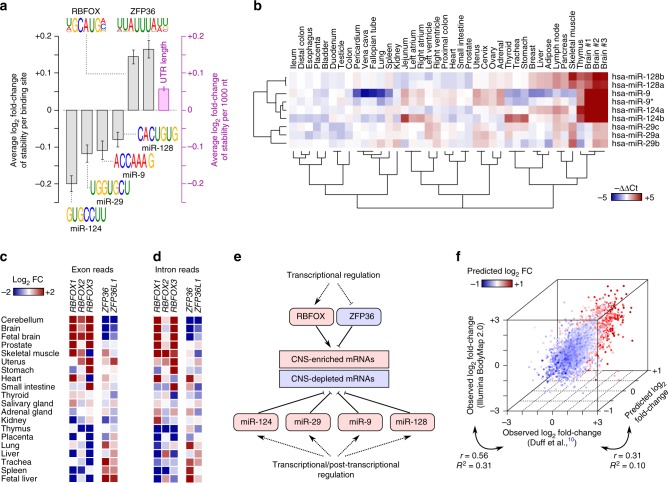
The abundance of mRNA is mainly determined by the rates of RNA transcription and decay. Here, we present a method for unbiased estimation of differential mRNA decay rate from RNA-sequencing data by modeling the kinetics of mRNA metabolism. We show that in all primary human tissues tested, and particularly in the central nervous system, many pathways are regulated at the mRNA stability level. We present a parsimonious regulatory model consisting of two RNA-binding proteins and four microRNAs that modulate the mRNA stability landscape of the brain, which suggests a new link between RBFOX proteins and Alzheimer's disease. We show that downregulation of RBFOX1 leads to destabilization of mRNAs encoding for synaptic transmission proteins, which may contribute to the loss of synaptic function in Alzheimer's disease. RBFOX1 downregulation is more likely to occur in older and female individuals, consistent with the association of Alzheimer's disease with age and gender."mRNA abundance is determined by the rates of transcription and decay. Here, the authors propose a method for estimating the rate of differential mRNA decay from RNA-seq data and model mRNA stability in the brain, suggesting a link between mRNA stability and Alzheimer's disease."


Conflict of interest statement

The authors declare no competing financial interests.

Figures

Fig. 1
Fig. 1
Δexon–Δintron is a biased estimate of mRNA stability. a A simplified schematic model of mRNA transcription and processing. The rate of RNA processing is modeled based on Michaelis–Menten kinetics, where the maximum rate is largely determined by the availability of the splicing machinery. Vt: transcription rate, Vp: RNA processing rate, Vd: RNA degradation rate, Kp: Michaelis constant for RNA processing. b The continuity and rate equations for RNA processing reactions, and the resulting equation for the relationship between Δexon–Δintron and the rates of different steps. kt: transcription rate constant, kd: mRNA decay rate constant, [pre-mRNA]: pre-mRNA concentration, [mRNA]: mature mRNA concentration. When comparing two samples, the parameters for the second sample are denoted with a prime (′) symbol. c The relationship between Δexon–Δintron and Δintron in the absence of differential decay rate, for various ratios of pre-mRNA abundance and Michaelis constant of RNA processing (Kp). Larger [pre-mRNA]/Kp ratios are shown with darker curves. Positive and negative Δintron values correspond to transcriptional upregulation and downregulation, respectively (Methods). Vp,max is assumed to be invariable. d The observed relationship between Δexon–Δintron and Δintron across 20 human tissues. Each data point represents the measurement for one gene in one tissue. The yellow curve denotes the trend line (average across sliding windows of 1000 data points). e The Pearson correlation coefficient between Δexon–Δintron and Δintron for genes with various read coverage. Each circle represents the set of genes that pass both the exonic and intronic read count cutoffs shown on the x axis and y axis (median read count across 20 tissues). The circle size represents the number of genes that pass the cutoffs, and the color shows the Pearson correlation between Δexon–Δintron and Δintron
Fig. 2
Fig. 2
Removing bias from Δexon–Δintron improves inference of differential mRNA stability a Example demonstration of estimating and subtracting bias from Δexon–Δintron. We assume that the true differential mRNA decay rate is overall not correlated with the bias term, allowing us to estimate the bias term using regression. b Uncorrected (left) and bias-corrected (right) Δexon–Δintron for mRNAs that were previously reported to be stabilized (red) or destabilized (blue) in metastatic MDA-LM2 cells compared to parental MDA cells (reported differential stability scores ≥ 0.95). Each point represents the set of genes that have a bias slope smaller than the corresponding cutoff on the x axis (points to the left correspond to more biased genes). The y axis corresponds to uncorrected or bias-corrected Δexon–Δintron for LM2 sub-line compared to parental MDA (positive means larger predicted stability in LM2). Error bars represent s.e.m. c Stability measurements for six mRNAs that were not previously detected as differentially regulated between MDA and LM2 cells. In each panel, the y axis represents the stability relative to 18 S rRNA. The top panel shows the predicted direction of change in stability based on uncorrected or bias-corrected Δexon–Δintron. Significant differences between the two cell types are marked with asterisks (*Mann–Whitney U-test on relative stabilities, P < 0.05). The error bars correspond to the s.d. (three biological replicates)
Fig. 3
Fig. 3
Factors that modulate mRNA stability in human brain. a Factors whose binding to the 3′ UTR is significantly associated with brain-specific mRNA stability are shown (FDR < 0.01, t-test of regression coefficients). The length of the 3′ UTR is also a significant predictor of mRNA stability, shown using the right axis. The error bars represent s.e.m. b Tissue-specific expression profiles of miRNAs that are associated with brain mRNA stability (data from ref. ). c Steady-state mRNA abundance of RBPs whose motif is associated with brain mRNA stability. d Transcriptional activity of RBPs, inferred from change in the abundance of intronic reads. e A schematic representation of the inferred mRNA stability model of human brain. f A 3D scatterplot of the brain mRNA stability profile based on RNA-seq data from ref. , RNA-seq data from Illumina BodyMap 2.0, and predictions based on presence of binding sites of miRNAs and RBPs (10-fold cross-validation). The latter is also represented by the color gradient. Each data point stands for one gene
Fig. 4
Fig. 4
A high-confidence network of brain mRNA stability. a The high-confidence network of RBPs, miRNAs and their targets in human brain. Node color represents the mRNA stability in brain relative to average tissue. b Venn diagram of the genes that contain a match to the RBFOX motif in their 3′ UTR, the subset that is in the high-confidence network (referred to as “stability targets”), and the genes whose orthologs in mouse are bound by Rbfox1/2/3 proteins. Only human genes that have a mouse ortholog are included in the analysis. c Overlap of high-confidence ZFP36 targets with experimentally identified functional targets of ZFP36. The color gradient represents fold-enrichment relative to the extent of overlap that would be expected by chance. Functional targets were defined as transcripts with at least one ZFP36 PAR-CLIP cluster in their 3′ UTRs that were > 2-fold downregulated after ectopic expression of ZFP36 in HEK293T cells. The bottom row represents transcripts without a significant PAR-CLIP cluster in 3′ UTR. d Venn diagram of genes with a match to miR-124 seed sequence, the subset in the high-confidence network, and genes that are downregulated when miR-124 is expressed in HeLa cells. e Enrichment of experimentally validated targets of miRNAs among our predicted high-confidence stability targets. The miRNA targets that are supported by literature are obtained from miRTarBase. The color gradient is similar to c. All P values are based on Fisher’s exact test
Fig. 5
Fig. 5
De-regulation of RBFOX stability programs in Alzheimer’s disease. a Enrichment of targets of brain stability factors among transcripts that are stabilized or destabilized in Alzheimer’s disease (AD). The heat map shows the stability of transcripts relative to average across all samples. Genes are sorted by t-score of difference between the AD (n = 6) and control (Ctrl, n = 5) groups. The unique targets of each factor (i.e., transcripts that are not targeted by any other factor) are shown on the right. The P value of enrichment of RBFOX targets among AD-destabilized genes is shown on the bottom right (Mann–Whitney U test). b Enrichment of synaptic transmission genes among the top 500 transcripts destabilized in AD, the high-confidence RBFOX stability targets, and the intersection of the two sets. c Comparison of abundance of RBFOX1 mRNA in the brain of AD and non-demented (Ctrl) individuals. The left panel compares the RBFOX1 mRNA abundance between 310 AD and 157 non-demented individuals (average of two RBFOX1 microarray probes), whereas other panels represent subgroups based on gender or age. P values are based on two-tailed Student’s t-test. d Correlation of AD-associated change in stability (x axis) with the change in expression after RBFOX1 knockdown (y axis, data from ref. ). The contours represent the probability density function for all genes, and the color gradient represents the density of genes that are RBFOX stability targets minus density of other genes (red: higher density of RBFOX targets). e Expression of synaptic transmission genes that are regulated by RBFOX proteins across 310 AD patients. Each row represents one individual, sorted by the ascending order of RBFOX1 expression (shown on the left). Each column represents one gene, sorted by the descending order of correlation with RBFOX1 expression (shown at the bottom). f Scatterplot of RBFOX1 abundance vs. age in 310 AD patients (blue dots, r = –0.1) and 157 non-demented individuals (green dots, r = –0.4). Overall Pearson correlation is –0.46 (P < 10–26)

References

    1. Wang Y, et al. Precision and functional specificity in mRNA decay. Proc. Natl Acad. Sci. USA. 2002;99:5860–5865. doi: 10.1073/pnas.092538799. - DOI - PMC - PubMed
    1. Yang E, et al. Decay rates of human mRNAs: correlation with functional characteristics and sequence attributes. Genome Res. 2003;13:1863–1872. doi: 10.1101/gr.997703. - DOI - PMC - PubMed
    1. Goodarzi H, et al. Systematic discovery of structural elements governing stability of mammalian messenger RNAs. Nature. 2012;485:264–268. doi: 10.1038/nature11013. - DOI - PMC - PubMed
    1. Munchel SE, Shultzaberger RK, Takizawa N, Weis K. Dynamic profiling of mRNA turnover reveals gene-specific and system-wide regulation of mRNA decay. Mol. Biol. Cell. 2011;22:2787–2795. doi: 10.1091/mbc.e11-01-0028. - DOI - PMC - PubMed
    1. Gaidatzis D, Burger L, Stadler MB. Analysis of intronic and exonic reads in RNA-seq data characterizes transcriptional and post-transcriptional regulation. Nat. Biotechnol. 2015;33:722–729. doi: 10.1038/nbt.3269. - DOI - PubMed

Publication types