. 2017 Oct 13;8(1):913.
doi: 10.1038/s41467-017-00695-1.

BAD-LAMP controls TLR9 trafficking and signalling in human plasmacytoid dendritic cells

Affiliations

BAD-LAMP controls TLR9 trafficking and signalling in human plasmacytoid dendritic cells

Alexis Combes et al. Nat Commun. .

Abstract

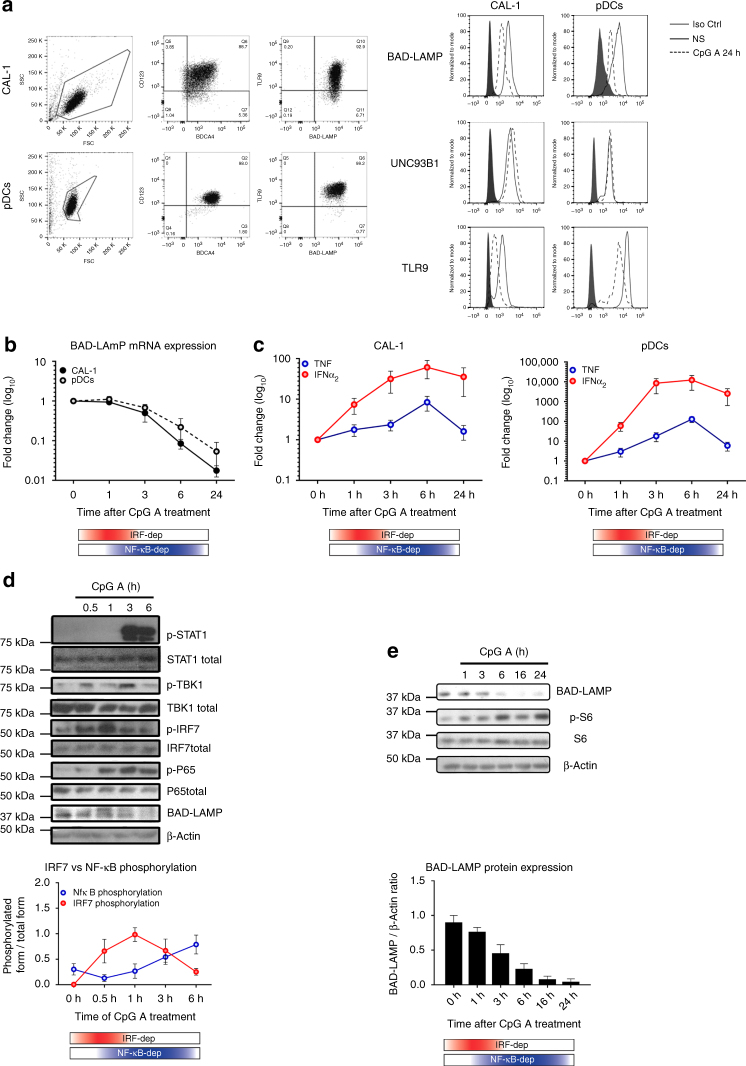
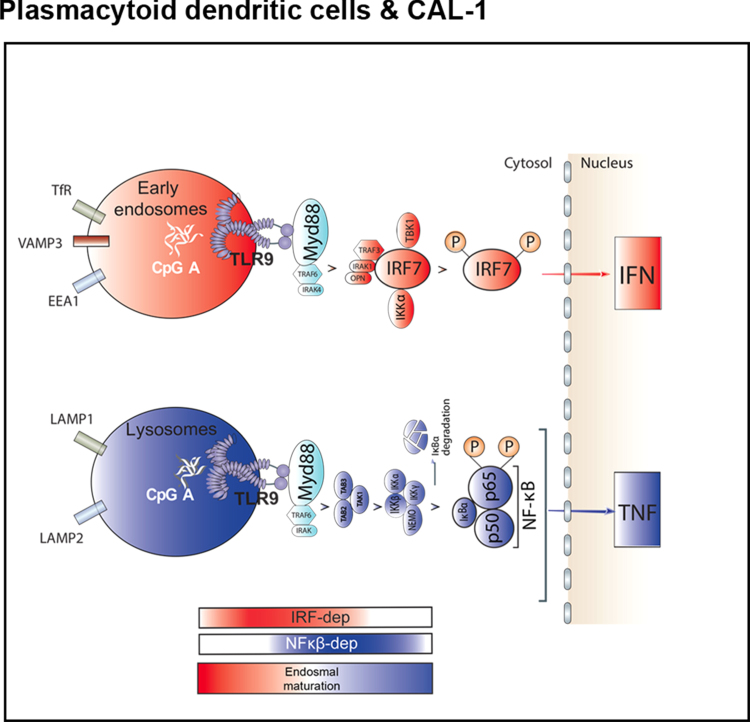
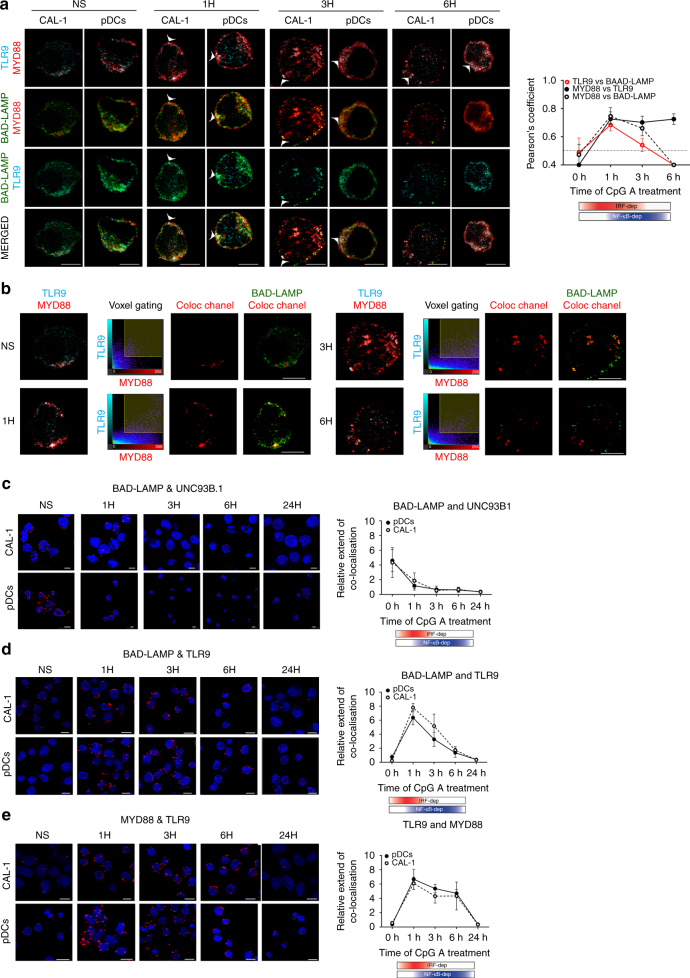
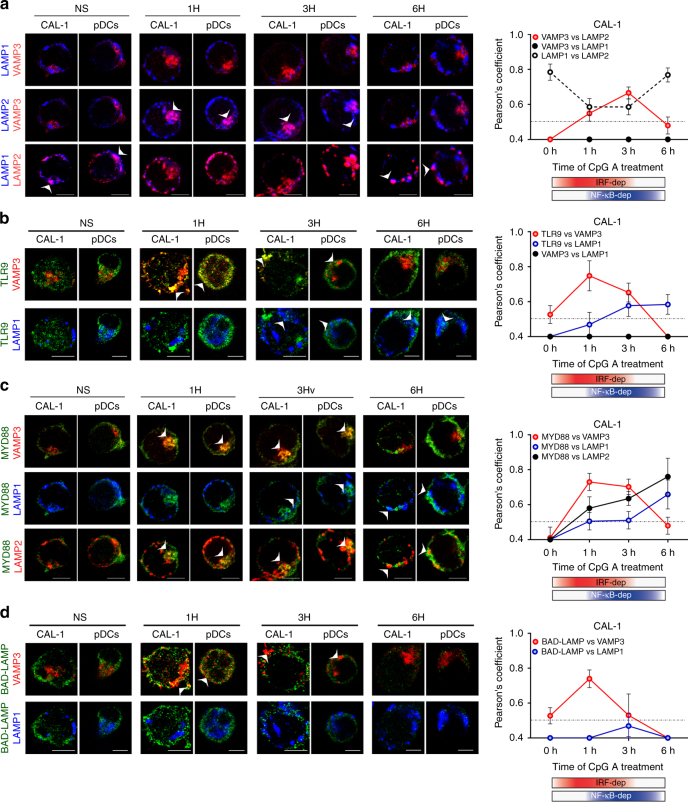
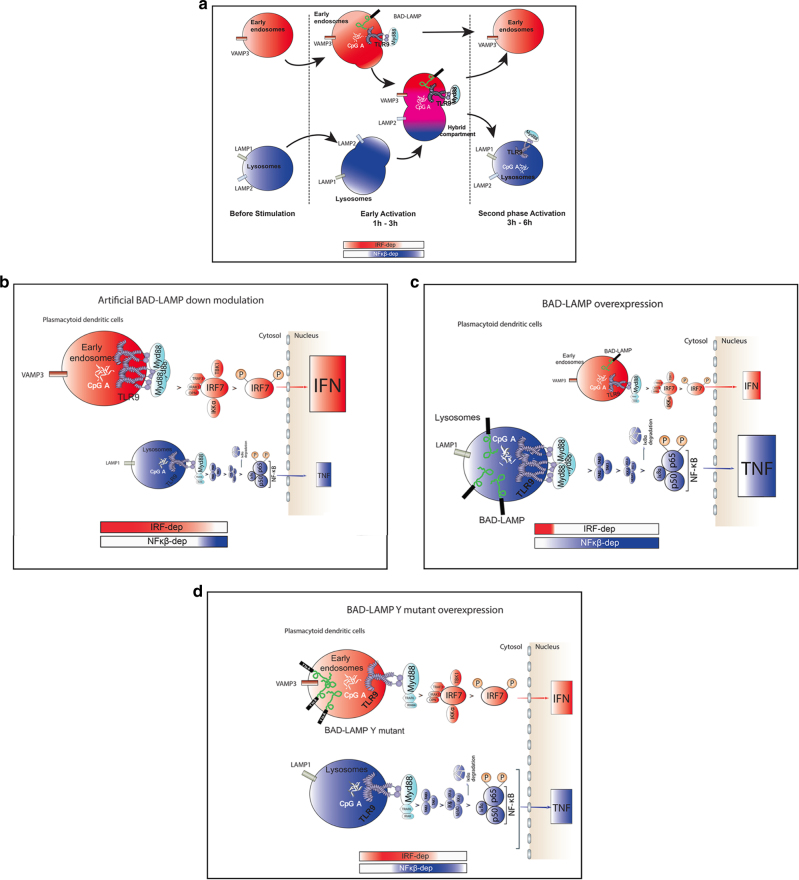
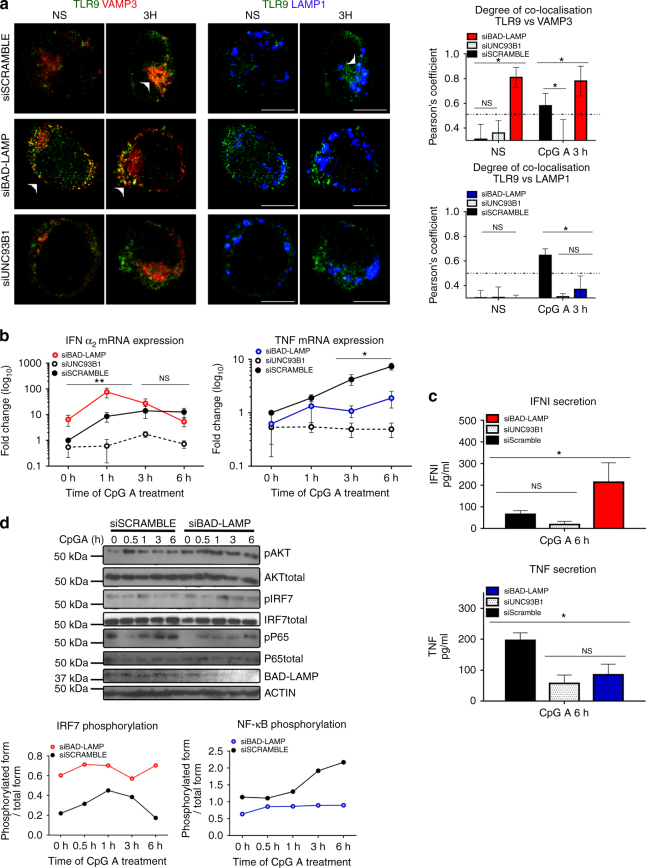
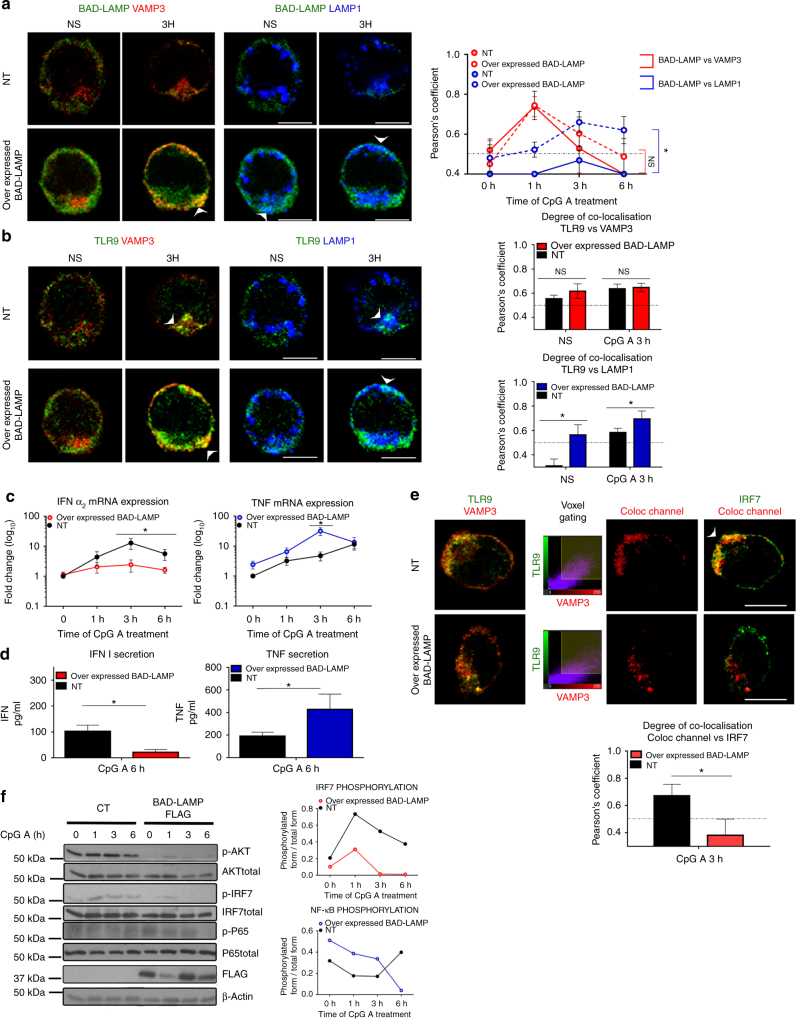
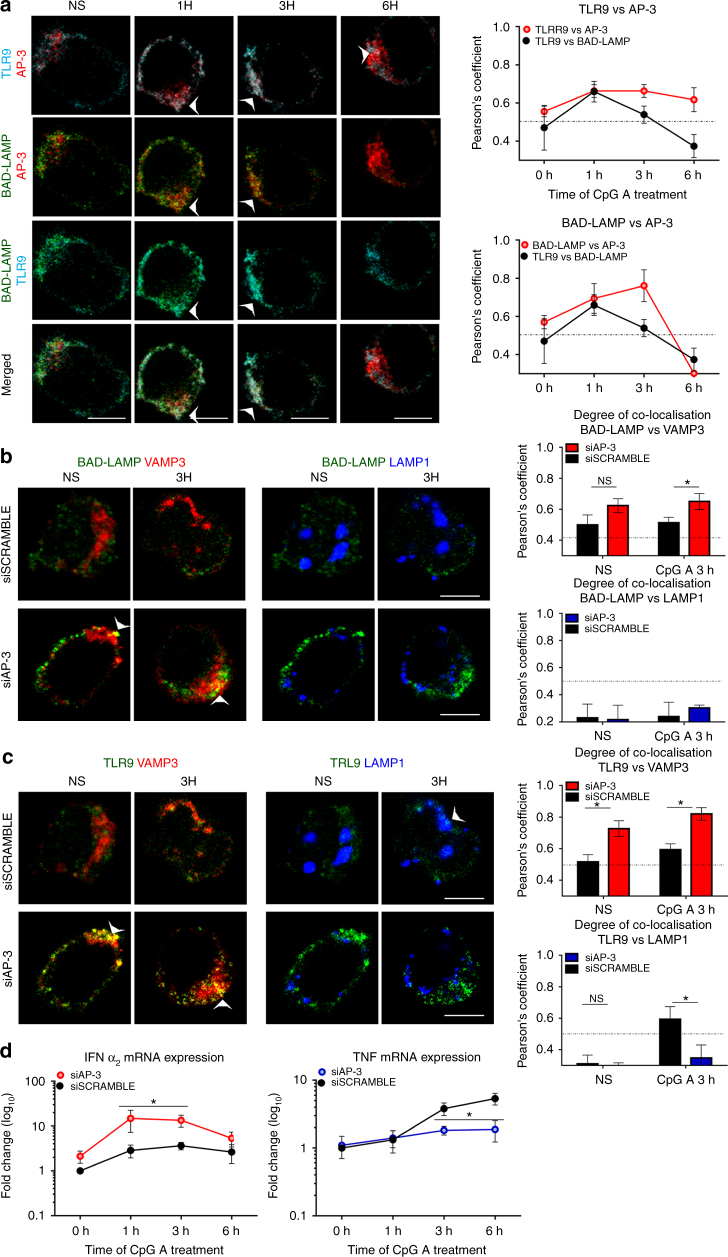
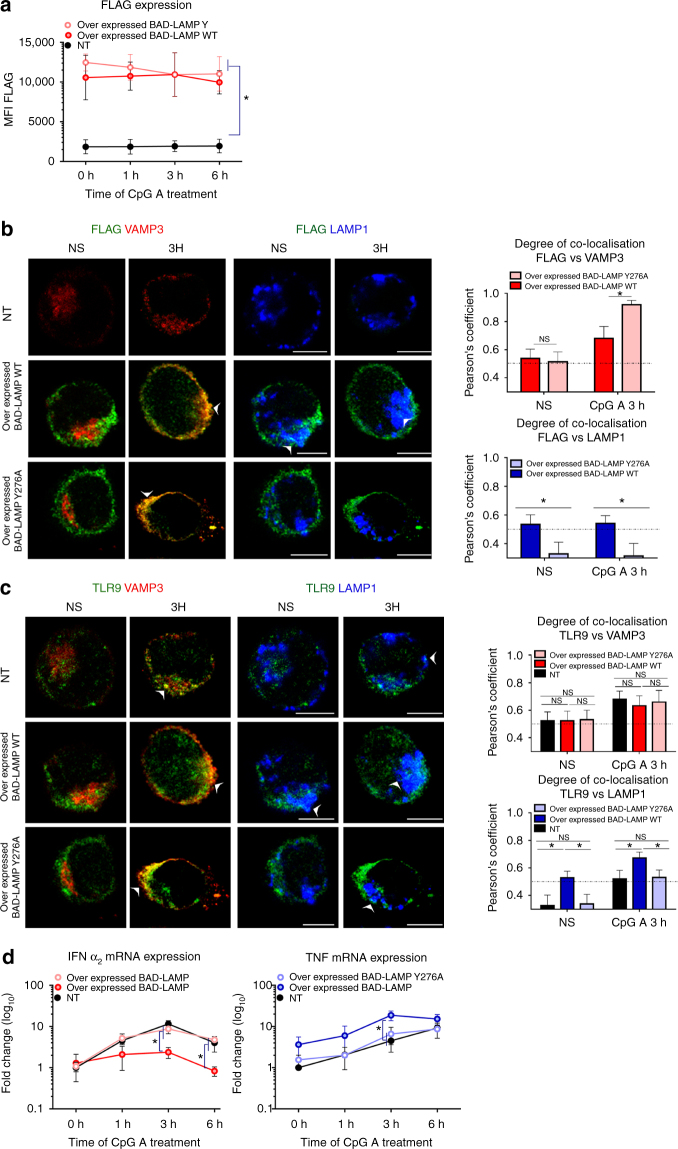
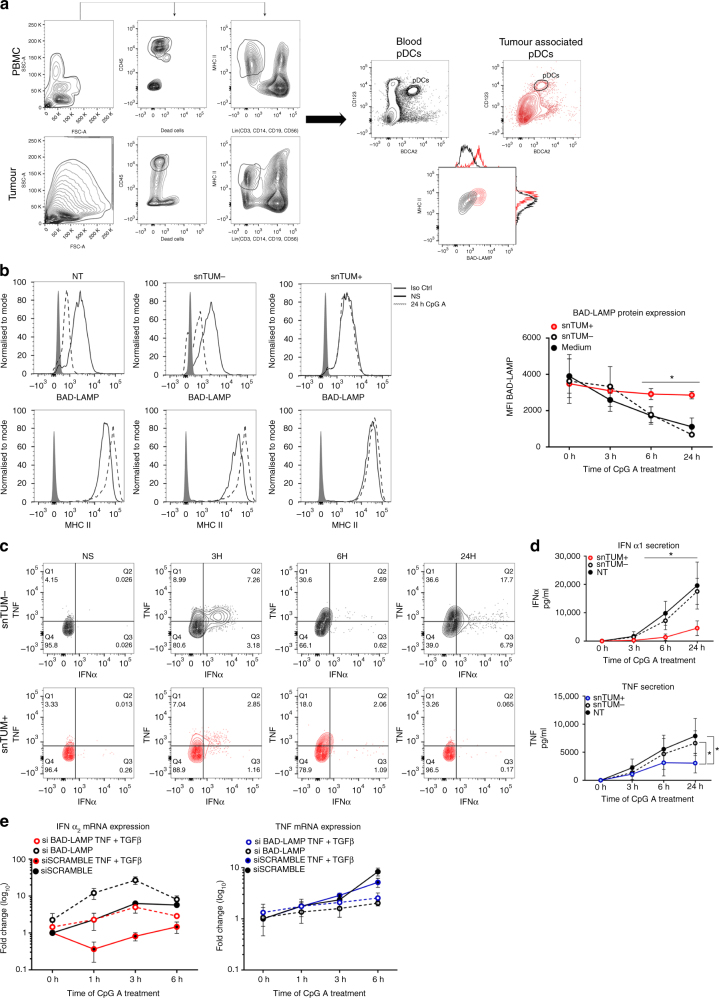
Toll-like receptors (TLR) are essential components of the innate immune system. Several accessory proteins, such as UNC93B1, are required for transport and activation of nucleic acid sensing Toll-like receptors in endosomes. Here, we show that BAD-LAMP (LAMP5) controls TLR9 trafficking to LAMP1+ late endosomes in human plasmacytoid dendritic cells (pDC), leading to NF-κB activation and TNF production upon DNA detection. An inducible VAMP3+/LAMP2+/LAMP1- endolysosome compartment exists in pDCs from which TLR9 activation triggers type I interferon expression. BAD-LAMP-silencing enhances TLR9 retention in this compartment and consequent downstream signalling events. Conversely, sustained BAD-LAMP expression in pDCs contributes to their lack of type I interferon production after exposure to a TGF-β-positive microenvironment or isolation from human breast tumours. Hence, BAD-LAMP limits interferon expression in pDCs indirectly, by promoting TLR9 sorting to late endosome compartments at steady state and in response to immunomodulatory cues.TLR9 is highly expressed by plasmacytoid dendritic cells and detects nucleic acids, but to discriminate between host and microbial nucleic acids TLR9 is sorted into different endosomal compartments. Here the authors show that BAD-LAMP limits type 1 interferon responses by sorting TLR9 to late endosomal compartments.


Conflict of interest statement

The authors declare no competing financial interests.

Figures

Fig. 1
Fig. 1
BAD-LAMP is down-modulated after IRF7 activation. a (left) Flow cytometry analysis of CAL-1 cells (top) and freshly isolated pDCs (bottom) from healthy donors stained for both extracellular (CD123 and BADCA4) and intracellular (TLR9 and BAD-LAMP) pDCs markers. (right) Flow cytometry histogram plots of intracellular staining for BAD-LAMP, TLR9 and UNC93B1 in both CAL-1 (left) and freshly isolated pDCs (right) at steady state (black line) and after 24 h of CpG-A stimulation (dashed line). Full grey histograms represent isotype controls staining. Data are representative of a minimum of three independent experiments. b CAL-1 (black line) and freshly isolated pDCs (dashed line) were treated with CpG-A for indicated times. BAD-LAMP mRNA levels were measured by RT-qPCR. Raw data have been normalised to housekeeping gene (GAPDH) and graphics represent fold change ± s.d. compared to non-stimulated cells from a minimum of three independent experiments. c IFNα2 (red) and TNF (blue) mRNA level from CAL-1 (left) and freshly isolated pDCs (right) were measured by RT-qPCR. Raw data have been normalised to housekeeping gene (GAPDH) and graphics represent fold change ± s.d. compared to non-stimulated cells from a minimum of three independent experiments. d (top) CAL-1 cells were treated with CpG-A for indicated times prior lysis and sodium dodecyl sulphate–polyacrylamide gel electrophoresis treatment. Expression of BAD-LAMP, TBK1, IRF7, STAT1, the p65 NF-κB subunit, Ribosomal S6 and their phosphorylated forms were detected by immunoblot. β-actin is shown as loading control. d (bottom) Quantification of IRF7 (red) and p65 (blue) phosphorylation levels. Graphics represents data normalised to total form levels for each protein ± s.d. from three independent experiments. e (bottom) Quantification of BAD-LAMP protein expression by Image J pixel quantification. Graphics represents data normalised β-actin levels ± s.d. from three independent experiments. The bimodal regulation of TLR9 signalling is represented with a shading red rectangle for its IRF7-dependent phase and blue for its NF-κB-dependent phase
Fig. 2
Fig. 2
Graphical abstract of TLR9 trafficking and signalling in human pDCs. a Graphical abstract summarizing the results shown in Fig. 1 on the spatiotemporal organisation of endosomal TLR9 signalling in human pDCs. The bimodal regulation of TLR9 signalling as well as endosomal maturation is represented using rectangles in shading red for IRF7-dependent phase and early endosome and in shading blue for NF-κB-dependent phase and late endosomes
Fig. 3
Fig. 3
BAD-LAMP is co-localised with TLR9 and MYD88 upon activation by CpG. a (left) Immunofluorescence confocal microscopy (ICM) of CAL-1 and freshly isolated pDCs stimulated or not (NS) with CpG-A for indicated times was performed to visualise BAD-LAMP (green), MYD88 (red) and TLR9 (cyan). Arrowheads point at co-localisation area. (right) Co-localisation quantifications using Pearson’s coefficient measurement (ImageJ) are shown for TLR9 and BAD-LAMP (red line), MYD88 and TLR9 (black line), MYD88 and BAD-LAMP (dashed line) during time. Graphics represent Pearson’s coefficient means of 50 different cells ± s.d. for each time point from at least three independent experiments. b Voxel gating analysis of immunofluorescence confocal images of CAL-1 cells presented in a. Voxel gating was performed on TLR9 (cyan) and MYD88 (red) channels to generate a ‘coloc channel’ picture only showing co-localisation areas between the two proteins. This ‘coloc channel’ was then merged with single BAD-LAMP staining to obtain simplified tri-localisation images, revealing strong BAD-LAMP co-localisation with TLR9/MYD88 after 1 h of CpG-A exposure. Scale bars = 5 μM. ce Immunofluorescence proximity ligation assay (iPLA) on CAL-1 or freshly isolated pDCs stimulated with CpG-A for indicated times performed for BAD-LAMP and UNC93B1 (c), BAD-LAMP and TLR9 (d), and TLR9 and MYD88 (e). (left) Confocal images are representative of at least three independent experiments in which the nucleus is stained by DAPI (blue) and proximity between the two proteins of interest is revealed by incorporation of labelled nucleotide (red) during the ligation reaction. Scale bars = 10 μM. (right) Quantification of iPLA for pDCs (black line) and CAL-1 (dashed line) by counting the number of red dots normalised to nucleus numbers using imageJ. Graphics are representing means of dots/cell for 150 different cells ± s.d. from at least three independent experiments. The bimodal regulation of TLR9 signalling is represented with a shading red rectangle for its IRF7-dependent phase and blue for its NF-κB-dependent phase
Fig. 4
Fig. 4
Upon activation TLR9 and BAD-LAMP are addressed to specialized endosomes. ad (left) Immunofluorescence confocal microscopy (ICM) on CAL-1 or freshly isolated pDCs stimulated with CpG-A for indicated times and stained of (a) LAMP1, LAMP2 and VAMP3; (b) TLR9, VAMP3 and LAMP1; (c) MYD88, LAMP1, LAMP2 and VAMP3; (d) BAD-LAMP, VAMP3 and LAMP1. Pictures are representative of at least three independent experiments. Arrows indicate co-localisation areas. Scale bars = 5 μM. (right) ad Quantification of the co-localisation between the different proteins across time was performed by Pearson’s coefficient measurement using ImageJ. Graphics represent Pearson’s coefficient means of 50 different cells ± s.d. from at least three independent experiments, significance of pixel correlation is only considered above a PCM of 0.5. The bimodal regulation of TLR9 signalling is represented with a shading red rectangle for its IRF7-dependent phase and blue for its NF-κB-dependent phase
Fig. 5
Fig. 5
Graphical abstracts of TLR9 trafficking and signalling in human pDCs upon activation or BAD-LAMP manipulation. a Graphical abstract summarizing the results shown in Fig. 4 on the spatiotemporal organisation of endosomes and TLR9 signalling in CpG-activated human pDCs. b Graphical abstract summarizing the results shown in Fig. 6 on the spatiotemporal organisation of endosomes and TLR9 signalling upon BAD-LAMP silencing. c Graphical abstract summarising the results shown in Fig. 7 on the spatiotemporal organisation of endosomes and TLR9 signalling upon overexpression of BAD-LAMP. d Graphical abstract summarising the results shown in Fig. 9 on the spatiotemporal organisation of endosomes and TLR9 signalling, upon overexpression of BAD-LAMP bearing a mutation in its YxxΦ addressing signal. The bimodal regulation of TLR9 signalling as well as endosomal maturation is represented using rectangles in shading red for IRF7-dependent phase and early endosome and in shading blue for NF-κB-dependent phase and late endosomes
Fig. 6
Fig. 6
BAD-LAMP silencing promotes TLR9-dependent type-I IFN expression. a. (left) Immunofluorescence confocal microscopy (ICM) on CAL-1 electroporated with the different indicated siRNA and stimulated with CpG-A for indicated times. Analyse at steady state (NS) or 3 h after CpG-A stimulation of LAMP1, VAMP3 and TLR9 distribution. Images are representative of at least three independent experiments. Arrowheads indicate co-localisation areas. Scale bars = 5 μM. (right) Quantification of co-localisation between TLR9 with VAMP3 (top), or with LAMP1 (bottom) at steady state (NS) or 3 h after CpG-A stimulation, was performed by Pearson’s coefficient measurement using ImageJ. Graphic represent Pearson’s coefficient means of 50 different cells ± s.d. from at least three independent experiments. b IFNα2 (left) and TNF (right) mRNA level were monitored by RT-QPCR. Raw data have been normalised to housekeeping gene (GAPDH) and graphics represent fold change ± s.d. compared to non-stimulated cells from three independent experiments minimum. c IFNα (top) and TNF (bottom) secretion were monitored by ELISA at 6 h after CpG-A stimulation. Graphics represent cytokines concentration ± s.d. from three independent experiments minimum. d (left) CAL-1 cells electroporated with siRNA scramble or siRNA BAD-LAMP were treated with CpG-A for indicated times prior lysis and SDS PAGE treatment. Expression of BAD-LAMP, AKT, IRF7, p65 NF-κB subunit and their phosphorylated forms were detected by immunoblot. β-actin is shown as loading control. (right) Quantification of IRF7 (top) and p65 (bottom) phosphorylation levels normalised to their total form by ImageJ quantification. *P < 0.05 by unpaired student’s t-test
Fig. 7
Fig. 7
BAD-LAMP expression promotes TLR9-dependent TNF expression. CAL-1 cells were electroporated with BAD-LAMP mRNA (overexpressed BAD-LAMP) or control non-relevant mRNA (NT) during 6 h before stimulation during indicated times with CpG. a, b (left) Immunofluorescence confocal microscopy (ICM) on CAL-1 electroporated with BAD-LAMP mRNA or not and stimulated with CpG-A for indicated times. Staining for LAMP1, VAMP3 and BAD-LAMP (a) or TLR9 (b) is shown. Pictures are representative of at least three independent experiments. White arrowheads identify co-localisation area. Scale bars = 5 µm. (right) Quantification of the co-localisation between BAD-LAMP (a) or TLR9 (b) and VAMP3 (red lines) or LAMP1 (blue lines) between control (full lines) and transfected cells (dashed lines) upon CpG-A stimulation was performed by Pearson’s coefficient measurement using ImageJ. Graphics represents mean of Pearson’s coefficient of at least 25 cells ± s.d. for any time point. c, d IFNα2 (left) and TNF (right) mRNA (c) or protein (d) level were monitored by RT-QPCR or ELISA respectively. e (top) Voxel gating analysis after ICM on control (NT) or transfected cells with BAD-LAMP mRNA and treated during 3 h with CpG-A. Voxel gating was performed on TLR9 (green) and VAMP3 (red) channels to generate a ‘Coloc channel’ picture only showing VAMP3+ TLR9-containing endosomes. This new ‘Coloc channel’ was then merged with single IRF7 staining. Arrowhead indicates co-localisation area. Scale bars = 5 µm. (bottom) Quantification was performed by Pearson’s coefficient measurement using ImageJ. Graphics represent Pearson’s coefficient means of 25 different cells ±  s.d. from two independent experiments. f (left) control CAL-1 cells or expressing FLAG-BAD-LAMP mRNA were treated with CpG-A for indicated times prior lysis and sodium dodecyl sulphate–polyacrylamide gel electrophoresis treatment. Expression of FLAG, AKT, IRF7, p65 NF-κB subunit and their phosphorylated forms were detected by immunoblot. β-actin is shown as loading control. (right) Quantification of IRF7 (top) and p65 (bottom) phosphorylation levels normalised to their total form by ImageJ quantification. *P < 0.05 by unpaired student’s t-test
Fig. 8
Fig. 8
AP-3 is necessary for TLR9 sorting to LAMP1 lysosomes and TNF induction. a (left) Immunofluorescence confocal microscopy (ICM) on CAL-1 stimulated with CpG-A for indicated times. Staining for BAD-LAMP, TLR9, and AP-3 is shown. Pictures are representative of at least three independent experiments. Arrowheads indicate co-localisation area. Scale bars = 5 μM. (right) Quantification of the co-localisation between TLR9 and BAD-LAMP (black line as reference), AP-3 and BAD-LAMP (top graph red line), and AP-3 and TLR9 (bottom graph red line) at different time was performed by Pearson’s coefficient measurement using ImageJ. b, c (left) Immunofluorescence confocal microscopy on CAL-1 electroporated with AP-3 siRNA or scramble siRNA and stimulated with CpG-A for indicated times. Stainings for LAMP1, VAMP3 and BAD-LAMP (b) or TLR9 (c) are shown. These pictures are representative of at least three independent experiments. White arrows identified co-localisation area. Scale bars = 5 Mm. right Quantification of the co-localisation between BAD-LAMP (b) or TLR9 (c) with VAMP3 (top) or LAMP1 (bottom) at steady state (NS) or 3 h upon CpG-A stimulation was performed by Pearson’s coefficient using ImageJ. Graphics represent Pearson’s coefficient means of 50 different cells ± s.d. from at least three independent experiments. d IFNα2 (left) and TNF (right) mRNA level were monitored by RT-QPCR. Raw data have been normalised to housekeeping gene (GAPDH) and graphics represent fold change ± s.d. compare to non-stimulated cells from three independent experiments minimum. *P < 0.05 by unpaired student’s t-test
Fig. 9
Fig. 9
BAD-LAMP YxxΦ motif is required for TLR9 transport to LAMP1+ late endosomes. CAL-1 cells were electroporated with FLAG BAD-LAMP WT or FLAG BAD-LAMP Y276A mRNAs for 6 h prior stimulation for indicated times with CpG-A. Mock electroporated cells (NT) are used as control. a BAD-LAMP ectopic protein expression were monitored by intracellular flow cytometry with FLAG tag antibody. Graphic represents means of MFI ± s.d. from at least two independent experiments. b, c (left) Immunofluorescence confocal microscopy on CAL-1 cells. Staining for LAMP1, VAMP3, FLAG (b) or TLR9 (c) are shown. Pictures are representative of at least two independent experiments. White arrows identify co-localisation area. Scale bars = 5 μM. (right) Quantification of the co-localisation between FLAG (b) or TLR9 (c) with VAMP3 (top) or LAMP1 (bottom) at steady state (NS) and 3 h after CpG-A stimulation was performed by Pearson’s coefficient measurement using ImageJ. Graphics represents mean of Pearson’s coefficient of at least 25 cells ± s.d. for all time points. d IFNα2 (left) and TNF (right) mRNA level were monitored by RT-QPCR. Raw data have been normalised to housekeeping gene (GAPDH) and graphics represent fold change ± s.d. compare to non-stimulated cells from two independent experiments. *P < 0.05 by unpaired student’s t-test
Fig. 10
Fig. 10
BAD-LAMP expression in tumour-associated pDCs correlates with low IFN-α production. a (left) Flow cytometry pDC gating strategy on both PBMC (top) and tumour (bottom) is shown. pDCs (BDCA2+; CD123+) were segregated from conventional dendritic cells (Lin, MHC II high) after identification of live hematopoietic cells (CD45+ Live Dead). (right) CD123+/BDCA4+ pDCs from blood (black) or from primary breast tumours (red) were further analysed for BAD-LAMP and MHC II expression. Data are representative of three patients. b Freshly isolated pDCs from healthy donors were treated for 16 h with tumour supernatant either devoid of (snTUM−) or enriched in (snTUM+) TNF and TGF-β. (left) BAD-LAMP and MHC II histogram plots from FACS staining at steady state (black line) or 24 h (dashed line) after CpG-A treatment. Full grey histogram represents isotype control. Data are representative for five independent experiments performed with eight different tumour supernatants. (right) Levels of BAD-LAMP shown as MFI from FACS intracellular staining in pDCs pre-treated with snTUM- (dashed line), snTUM + (red line) or with medium (black lines). MFI ± s.d. from five independent experiments. c Freshly isolated pDCs from heathy donors were treated for 16 h with tumour supernatant either devoid of (snTUM-; black) or enriched in (snTUM + ; red) in TNF and TGF-β. 2D FACS analysis of intracellular staining for IFN-α and TNF cytokines at different times after CpG-A stimulation. Data are representative for three independent experiments. d IFN-α (top) and TNF (bottom) production was monitored by ELISA at different times of CpG-A stimulation. Graphics represent cytokines concentration ±  s.d. from five independent experiments minimum. Eight different sets of tumour supernatants have been tested. e IFNα2 (left) and TNF (right) mRNA expression in CAL-1 electroporated with BAD-LAMP siRNA (dashed lines) or scramble siRNA (full lines) and stimulated for indicated times with CpG-A. CAL-1 were treated either with TNF + TGF-β (coloured) or with medium (black). Raw data have been normalised to housekeeping gene (GAPDH) and graphics represent fold ± s.d. compared to non-stimulated cells from two experiment. *P < 0.05 by unpaired student’s t-test

References

    1. Akira S, Uematsu S, Takeuchi O. Pathogen recognition and innate immunity. Cell. 2006;124:783–801. doi: 10.1016/j.cell.2006.02.015. - DOI - PubMed
    1. Yamamoto M, Takeda K, Akira S. TIR domain-containing adaptors define the specificity of TLR signaling. Mol. Immunol. 2004;40:861–868. doi: 10.1016/j.molimm.2003.10.006. - DOI - PubMed
    1. Honda K, et al. Role of a transductional-transcriptional processor complex involving MyD88 and IRF-7 in Toll-like receptor signaling. Proc. Natl Acad. Sci. USA. 2004;101:15416–15421. doi: 10.1073/pnas.0406933101. - DOI - PMC - PubMed
    1. Kawai T, Akira S. The role of pattern-recognition receptors in innate immunity: update on Toll-like receptors. Nat. Immunol. 2010;11:373–384. doi: 10.1038/ni.1863. - DOI - PubMed
    1. Ewald SE, et al. Nucleic acid recognition by Toll-like receptors is coupled to stepwise processing by cathepsins and asparagine endopeptidase. J. Exp. Med. 2011;208:643–651. doi: 10.1084/jem.20100682. - DOI - PMC - PubMed

Publication types

MeSH terms