. 2017 Oct 13;7(1):13137.
doi: 10.1038/s41598-017-13545-3.

Dielectric imaging for differentiation between cancer and inflammation in vivo

Affiliations

Dielectric imaging for differentiation between cancer and inflammation in vivo

Rimi Lee et al. Sci Rep. .

Abstract

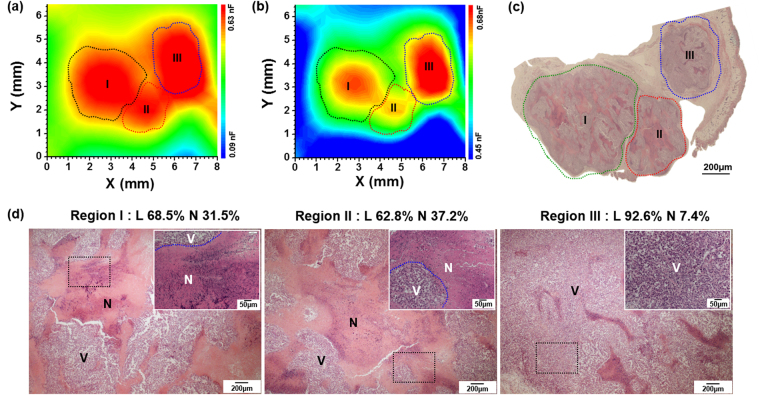
In this study, we develop an in vivo dielectric imaging technique that measures capacitance using pin-type electrode arrays. Compared to normal tissues, cancer tissues exhibit higher capacitance values, allowing us to image the cancer region and monitor the chemotherapeutic effects of cancer in real-time. A comparison with the histopathological results shows that the in vivo dielectric imaging technique is able to detect small tumors (<3 mm) and tumor-associated changes. In addition, we demonstrate that cancer and inflammation may be distinguished by measuring the capacitance images at different frequencies. In contrast, the positron emission tomography using 2-[18F]-fluoro-2-deoxy-D-glucose was not capable of discriminating between cancer and inflammation.


Conflict of interest statement

The authors declare that they have no competing interests.

Figures

Figure 1
Figure 1
(a) (Left) Schematic diagram of probe I spaced 0.5 mm apart. (Right) Frequency dependence of the capacitance measured for normal and cancer tissues from MCF-7, SK-BR-3, and A431 tumor-bearing mice. Data represent mean ± standard deviation (n = 5). (b) (Left, top) Image of probe II composed of 10 × 10 electrodes 1.5 mm in length and spaced 0.5 mm apart, and fabricated on a flexible substrate. (Left, bottom) Image of an SK-BR-3 tumor-bearing mouse (red dotted area). (Right) Capacitance image of the cancer region on a 50-color scale. The 9 × 9 capacitance values were measured using probe II with an AC voltage of 10 mV at 100 kHz. The color range was set between 0.09 and 0.63 nF with the red color denoting the highest capacitance. (c) Hematoxylin and eosin (H&E)-stained histological specimens obtained from cancer tissue (white dotted area) extracted from the SK-BR-3 tumor-bearing mice after the capacitance measurement. The right column shows the higher magnification of histological images of the blue dotted rectangles denoted by (top) A and (bottom) B. (d) MRI image of an SK-BR-3 tumor-bearing mouse.
Figure 2
Figure 2
(Left) Image of SK-BR-3 tumor-bearing mice showing different tumor volumes, as indicated by the red dotted area. The tumor volumes were (a) 18.84 mm3 and (b) 4.18 mm3. (Middle) Capacitance images of cancer regions on a 50-color scale for (a) large- and (b) small- sized cancers. A 9 × 9 capacitance array was measured using probe II with an AC voltage of 10 mV at 100 kHz. The color range was set between 0.09 and 0.63 nF, with the red color denoting the highest capacitance. (Right) H&E-stained histological specimens of cancer tissues extracted from the SK-BR-3 tumor-bearing mice with (a) large- and (b) small-sized cancers after the capacitance measurements. When compared with the histological results, the red region in the capacitance images corresponds to the cancer region (red dotted area).
Figure 3
Figure 3
Capacitance images measured with an AC voltage of 10 mV at 100 kHz for the cancer region, as obtained from the SK-BR-3 tumor-bearing mouse with a relatively large-sized cancer (38 mm3) on different capacitance scales: (a) 0.09 ~ 0.63 nF and (b) 0.45 ~ 0.63 nF. (c) H&E-stained histological specimens of cancer tissues extracted from the SK-BR-3 tumor-bearing mouse after the capacitance measurements. (d) Histopathologic sections of regions I, II, and III. Most tissues in regions I and II are necrotic, whereas tumor tissues in region III are viable without necrosis. The insets show the higher magnification microscopic features marked by black dotted rectangles. Vor L: Viable region, N: Necrotic region. The capacitance images in 15 × 15 mm are shown in Fig. S2.
Figure 4
Figure 4
18F-FDG-PET images obtained from (a) the SK-BR-3 tumor-bearing mouse, which was inoculated with 5×10⁵ and 1×10⁷ cells in the left (Lt) and right (Rt) flank regions, respectively, and from (b) the acute and (c) chronic inflamed regions in a mouse infected with S. aureus and a mouse with the induced granuloma, respectively.
Figure 5
Figure 5
Frequency dependence of the capacitance measured for the normal and cancer tissues of the SK-BR-3 tumor-bearing mouse, and the inflamed tissue of the S. aureus-inoculated mouse. The data are fitted to the relationship Cf −α with two different exponents at low frequencies (f l) and high frequencies (f h). For the normal and cancer tissues, l is larger than h, whereas for the inflamed tissue, h is larger than l.
Figure 6
Figure 6
The capacitance images measured at 10 and 100 kHz, the maps of l, h, and l/h, and the H&E-stained histological specimens for a normal region, the left (Lt) and right (Rt) cancer regions of the SK-BR-3 tumor-bearing mouse, and the acute and chronic inflamed regions in a mouse infected with S. aureus and a mouse with the induced granuloma. The color range was set between the minimum capacitance of the control mouse (C normal) and 7 × C normal at each frequency. The capacitance images were obtained from the same mice used to acquire the 18F-FDG-PET images (Fig. 4). The values of l and h were estimated from the plots of log(C) versus log (f) at low and high frequencies, respectively. In the map of l/h, l/h < 1 is denoted by blue color and l/h > 1 by orange color, and the dotted region represents the red color region in the capacitance image at 100 kHz, which corresponds to the cancer region.
Figure 7
Figure 7
Time-lapse capacitance images measured at (a) 10 and (b) 100 kHz, and (c) the time-lapse maps of l/h for the cancer region of the SK-BR-3 tumor-bearing mouse treated with 100 μg/ml of DOX. The values of l and h were estimated from the measured frequency dependence of the capacitance. In the map of l/h, l/h < 1 is denoted by blue color and l/h > 1 by orange color, and the dotted region represents the red color region in the capacitance image at 100 kHz, which corresponds to the cancer region. (d) H&E-stained specimen of cancer tissue extracted from the DOX treated SK-BR-3 tumor-bearing mouse on day 4. The white dotted area corresponds to the cancer region and the inset shows the enlarged histopathological image of the area denoted by an arrow. The black and white arrows in (b) and (c) are the same cancer region for histopathologic staining in (d).

References

    1. Warburg O. On the origin of cancer cells. Science. 1956;123:309–314. doi: 10.1126/science.123.3191.309. - DOI - PubMed
    1. Rosenbaum SJ, Lind T, Antoch G, Bockisch A. False-positive FDG PET uptake the role of PET-CT. Eur. Radiol. 2006;16:1054–1065. doi: 10.1007/s00330-005-0088-y. - DOI - PubMed
    1. Vaidyanathan S, Patel CN, Scarsbrook AF, Chowdhury FU. FDG PET/CT in infection and inflammation—current and emerging clinical applications. Clin. Radiol. 2015;70:787–800. doi: 10.1016/j.crad.2015.03.010. - DOI - PubMed
    1. Zhuang H, Alavi A. 18-Fluorodeoxyglucose positron emission tomographic imaging in the detection and monitoring of infection and inflammation. Semin. Nucl. Med. 2002;32:47–59. doi: 10.1053/snuc.2002.29278. - DOI - PubMed
    1. Fricke H, Morse S. The electric capacity of tumors of the breast. J. Cancer Res. 1926;10:340–376.

Publication types

Substances

LinkOut - more resources