. 2017 Oct 13;7(1):13124.
doi: 10.1038/s41598-017-12888-1.

Signatures of positive selection reveal a universal role of chromatin modifiers as cancer driver genes

Affiliations

Signatures of positive selection reveal a universal role of chromatin modifiers as cancer driver genes

Luis Zapata et al. Sci Rep. .

Abstract

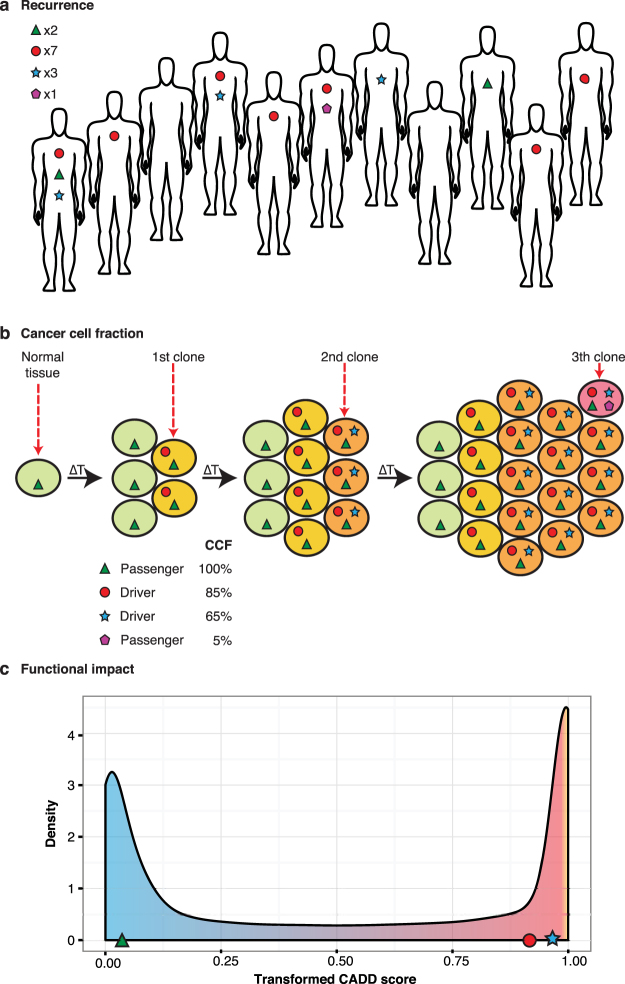
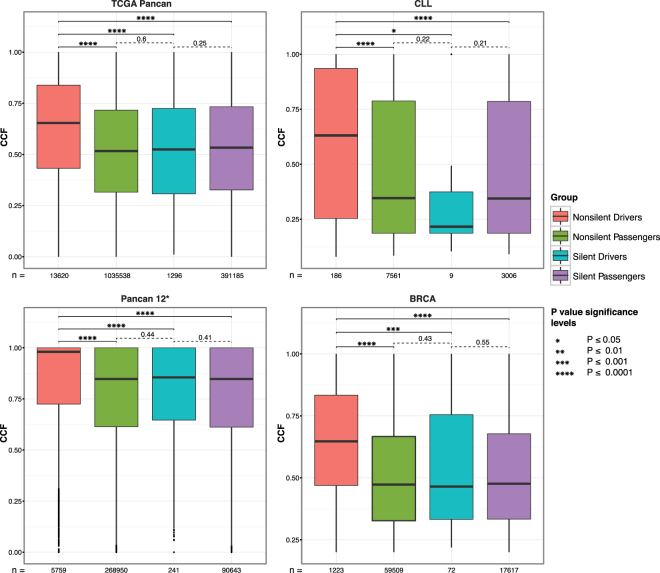
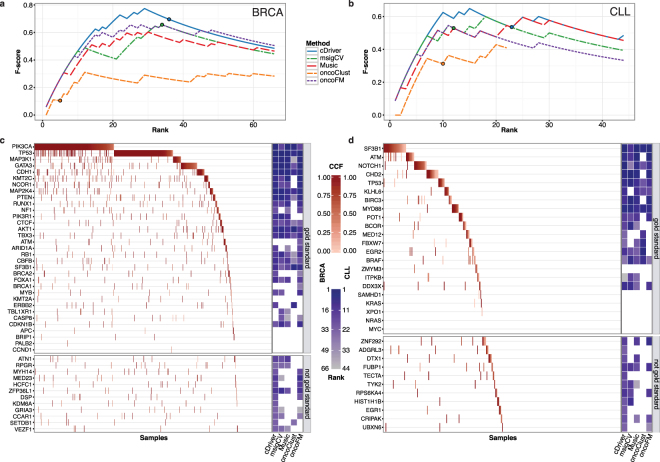
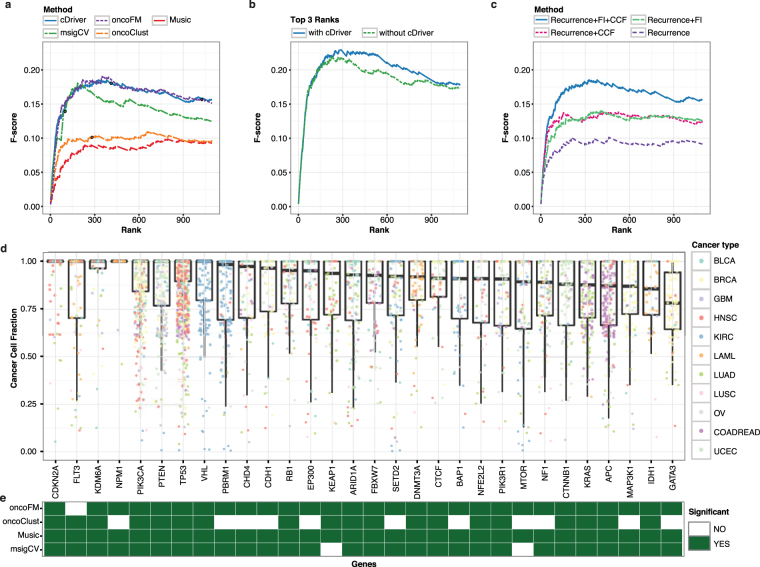
Tumors are composed of an evolving population of cells subjected to tissue-specific selection, which fuels tumor heterogeneity and ultimately complicates cancer driver gene identification. Here, we integrate cancer cell fraction, population recurrence, and functional impact of somatic mutations as signatures of selection into a Bayesian model for driver prediction. We demonstrate that our model, cDriver, outperforms competing methods when analyzing solid tumors, hematological malignancies, and pan-cancer datasets. Applying cDriver to exome sequencing data of 21 cancer types from 6,870 individuals revealed 98 unreported tumor type-driver gene connections. These novel connections are highly enriched for chromatin-modifying proteins, hinting at a universal role of chromatin regulation in cancer etiology. Although infrequently mutated as single genes, we show that chromatin modifiers are altered in a large fraction of cancer patients. In summary, we demonstrate that integration of evolutionary signatures is key for identifying mutational driver genes, thereby facilitating the discovery of novel therapeutic targets for cancer treatment.


Conflict of interest statement

The authors declare that they have no competing interests.

Figures

Figure 1
Figure 1
Signatures of positive selection observed from tumor sequencing data. (a) Large-scale sequencing experiments of patient cohorts reveal the mutational landscape of a cancer across a population. Somatic mutations under positive selection (circle and star) are expected to be more frequent than somatic mutations that confer no selective advantage (triangle and pentagon). As a result, most of the current algorithms consider recurrently mutated genes as drivers and randomly mutated genes as passengers. (b) Illustrative model of clonal evolution showing four time points. Each clone is represented by a unique genotype, and is depicted as a group of cells (ellipsoids) with the same background color. Shapes inside the cell represent mutations. Two types of mutations under positive selection are illustrated: a tumor-initiating driver (red circle) and a late-driver causing clonal expansion (blue star). The initial driver mutation causes the emergence of the first malignant clone (last onko-common ancestor, LOCA) and it propagates to all daughter cells, thus having a high cancer cell fraction (CCF) at all time points. The second driver mutation confers a selective advantage over the rest of the clones, generating a selective sweep in the last time point. Two types of passenger mutations are shown: early passengers or hitchhikers (green triangle) present at a high CCF since they appeared before the emergence of the LOCA and late passenger (purple pentagon) present only in a small fraction of cancer cells. The CCF value describes the total fraction for each mutation at the last time point. (c) Highly damaging mutations are expected to be under selection given they disrupt the normal protein function. In contrast, passenger mutations are mostly neutral and are not expected to have a bias towards high functional damage. In this study we integrate signals depicted in a-c in one model for driver gene identification.
Figure 2
Figure 2
CCF distribution for four groups of somatic mutations in four cancer datasets. We obtained the CCF distribution for nonsilent driver, nonsilent passenger, silent driver, and silent passenger gene mutations and compared the significance of the differences between each pair of them. CCF of nonsilent driver mutations is significantly higher compared to all other groups. Importantly, CCF of nonsilent drivers is significantly higher compared to silent mutations in driver genes and the latter were not significantly different from silent or nonsilent mutations in passenger genes (*Pancan12 represent the highly filtered dataset published in ref.).
Figure 3
Figure 3
Benchmarking of cDriver and other driver identification methods in breast cancer (BRCA) and chronic lymphocytic leukemia (CLL) datasets. F-score for cDriver (solid blue line) and four other driver identification algorithms using BRCA (a) and CLL (b) datasets. Results of each method were transformed to ranks by ordering P values or posterior probabilities. The P value cutoff for significance is shown as a circle in each of the curves. For visualization, F-score is shown to rank 66 for BRCA and 44 for CLL (twice the number of genes in the gold standards), since all methods reach the F-score peak before these ranks (c,d). We compared the results for all methods irrespective of the P value using only the ranking for BRCA (c) and CLL (d). Gold standard genes were ordered by mutation frequency and samples were ordered by cancer cell fraction (CCF). The CCF of each mutation in each gene-patient pair is indicated by the red color gradient. On the right, gene rankings of each algorithm are indicated by the blue color gradient. White means that this gene was not ranked under 66 for BRCA (c) and 44 for CLL (d). At the bottom of figures (c and d) results for genes not present in the gold standard but highly ranked by cDriver are shown.
Figure 4
Figure 4
cDriver results and comparison with other methods for a dataset composed of 12 cancers. (a) F-score for cDriver (solid blue line) and four other driver identification methods using the Pancan12 dataset (b) F-score for an ensemble approach of all tools with and without our Bayesian model, cDriver (blue and green lines respectively). (c) F-score for cDriver using: (i) only a published background model, (ii) including functional impact (FI), (iii) including cancer cell fraction, CCF, and (iv) a combination of all signals. (d) We ordered the top 30 cDriver- ranked genes on Pancan12 by their median CCF. (e) Matrix showing whether these top 30 genes were predicted as significant by the other four algorithms (Q value or FDR less than 0.1).
Figure 5
Figure 5
Novel tumor type - driver gene (TTDG) connections, CHD4 and SMARCA4. Distribution of somatic mutations found in (a) CHD4 and (b) SMARCA4. The domains are colored following the cBioPortal color scheme. Most of the mutations are evenly distributed in CHD4, except for two small clusters at the beginning of the protein. In the case of SMARCA4, mutations tend to accumulate in the domains for ATP hydrolysis or DNA unwinding. TTDG connection landscape for (c) CHD4 and (d) SMARCA4: the color indicates the number of pubmed hits related to each MeSH term. The shape indicates the frequency of patients affected by a mutation in the gene. Survival curves for (e) CHD4 in bladder carcinoma and for (f) SMARCA4 in liver hepatocellular carcinoma. Patients affected by a mutation are plotted in red.

Similar articles

Cited by

References

    1. Nowell PC. The clonal evolution of tumor cell populations. Science. 1976;194:23–28. doi: 10.1126/science.959840. - DOI - PubMed
    1. Stratton MR, Campbell PJ, Futreal PA. The cancer genome. Nature. 2009;458:719–724. doi: 10.1038/nature07943. - DOI - PMC - PubMed
    1. Vogelstein B, Papadopoulos N, Velculescu VE, Zhou S, et al. Cancer genome landscapes. science. 2013;339:1546–1558. doi: 10.1126/science.1235122. - DOI - PMC - PubMed
    1. Fearon ER, Vogelstein B. A genetic model for colorectal tumorigenesis. Cell. 1990;61:759–767. doi: 10.1016/0092-8674(90)90186-I. - DOI - PubMed
    1. Sakoparnig T, Fried P, Beerenwinkel N. Identification of constrained cancer driver genes based on mutation timing. PLoS Comput Biol. 2015;11:e1004027. doi: 10.1371/journal.pcbi.1004027. - DOI - PMC - PubMed

Publication types

LinkOut - more resources