

DNA methylation and transcriptional trajectories during human development and reprogramming of isogenic pluripotent stem cells
- PMID: 29030611
- PMCID: PMC5640655
- DOI: 10.1038/s41467-017-01077-3
DNA methylation and transcriptional trajectories during human development and reprogramming of isogenic pluripotent stem cells
Abstract
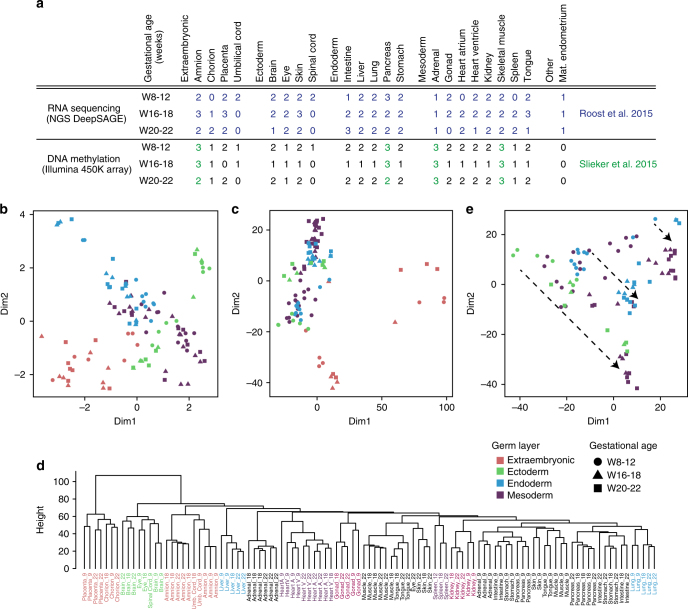
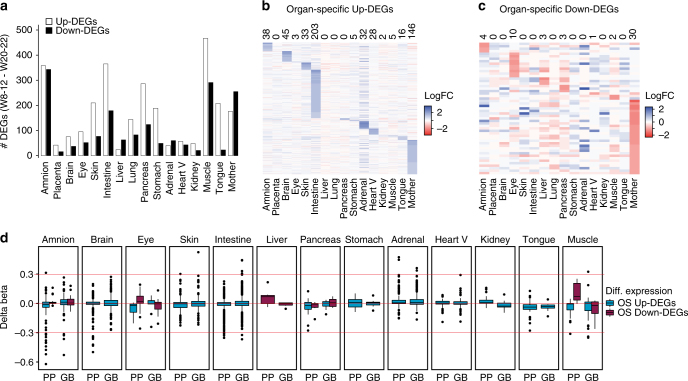
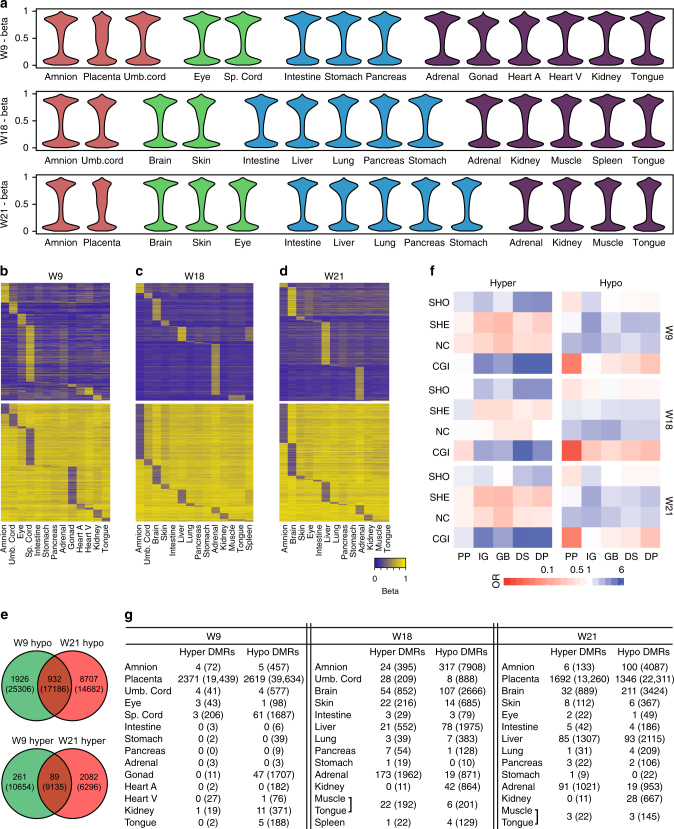
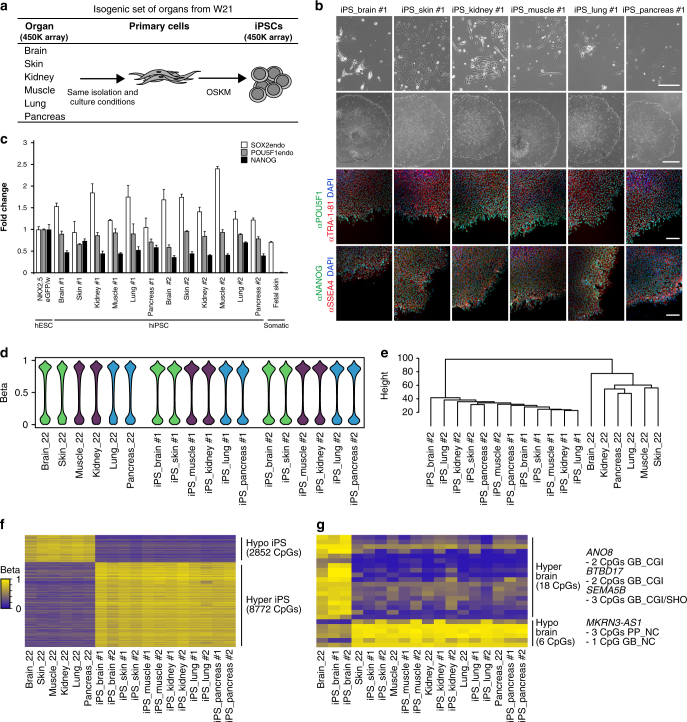
Determining cell identity and maturation status of differentiated pluripotent stem cells (PSCs) requires knowledge of the transcriptional and epigenetic trajectory of organs during development. Here, we generate a transcriptional and DNA methylation atlas covering 21 organs during human fetal development. Analysis of multiple isogenic organ sets shows that organ-specific DNA methylation patterns are highly dynamic between week 9 (W9) and W22 of gestation. We investigate the impact of reprogramming on organ-specific DNA methylation by generating human induced pluripotent stem cell (hiPSC) lines from six isogenic organs. All isogenic hiPSCs acquire DNA methylation patterns comparable to existing hPSCs. However, hiPSCs derived from fetal brain retain brain-specific DNA methylation marks that seem sufficient to confer higher propensity to differentiate to neural derivatives. This systematic analysis of human fetal organs during development and associated isogenic hiPSC lines provides insights in the role of DNA methylation in lineage commitment and epigenetic reprogramming in humans.While DNA methylation and gene expression data are widely available for animal models, comprehensive data from human development is rarer. Here, the authors generated transcriptional and DNA methylation data from 21 organs during human development and 6 isogenic induced pluripotent stem cell lines.
Conflict of interest statement
The authors declare no competing financial interests.
Figures
Similar articles
-
Epigenetic aberrations in human pluripotent stem cells.EMBO J. 2019 Jun 17;38(12):e101033. doi: 10.15252/embj.2018101033. Epub 2019 May 14. EMBO J. 2019. PMID: 31088843 Free PMC article. Review.
-
The Aberrant DNA Methylation Profile of Human Induced Pluripotent Stem Cells Is Connected to the Reprogramming Process and Is Normalized During In Vitro Culture.PLoS One. 2016 Jun 23;11(6):e0157974. doi: 10.1371/journal.pone.0157974. eCollection 2016. PLoS One. 2016. PMID: 27336948 Free PMC article.
-
Robust Differentiation of mRNA-Reprogrammed Human Induced Pluripotent Stem Cells Toward a Retinal Lineage.Stem Cells Transl Med. 2016 Apr;5(4):417-26. doi: 10.5966/sctm.2015-0093. Epub 2016 Mar 1. Stem Cells Transl Med. 2016. PMID: 26933039 Free PMC article.
-
Epigenetic Aberrations Are Not Specific to Transcription Factor-Mediated Reprogramming.Stem Cell Reports. 2016 Jan 12;6(1):35-43. doi: 10.1016/j.stemcr.2015.11.007. Epub 2015 Dec 17. Stem Cell Reports. 2016. PMID: 26711876 Free PMC article.
-
DNA methylation dynamics in human induced pluripotent stem cells.Hum Cell. 2016 Jul;29(3):97-100. doi: 10.1007/s13577-016-0139-5. Epub 2016 Apr 15. Hum Cell. 2016. PMID: 27083573 Review.
Cited by
-
SAMe, Choline, and Valproic Acid as Possible Epigenetic Drugs: Their Effects in Pregnancy with a Special Emphasis on Animal Studies.Pharmaceuticals (Basel). 2022 Feb 3;15(2):192. doi: 10.3390/ph15020192. Pharmaceuticals (Basel). 2022. PMID: 35215304 Free PMC article. Review.
-
Epigenetic aberrations in human pluripotent stem cells.EMBO J. 2019 Jun 17;38(12):e101033. doi: 10.15252/embj.2018101033. Epub 2019 May 14. EMBO J. 2019. PMID: 31088843 Free PMC article. Review.
-
A computer-guided design tool to increase the efficiency of cellular conversions.Nat Commun. 2021 Mar 12;12(1):1659. doi: 10.1038/s41467-021-21801-4. Nat Commun. 2021. PMID: 33712564 Free PMC article.
-
Tumorigenic and Immunogenic Properties of Induced Pluripotent Stem Cells: a Promising Cancer Vaccine.Stem Cell Rev Rep. 2020 Dec;16(6):1049-1061. doi: 10.1007/s12015-020-10042-5. Epub 2020 Sep 16. Stem Cell Rev Rep. 2020. PMID: 32939647 Free PMC article. Review.
-
Environmental exposures influence multigenerational epigenetic transmission.Clin Epigenetics. 2024 Oct 17;16(1):145. doi: 10.1186/s13148-024-01762-3. Clin Epigenetics. 2024. PMID: 39420431 Free PMC article. Review.
References
Publication types
MeSH terms
LinkOut - more resources
Full Text Sources
Other Literature Sources
Molecular Biology Databases
