

Decadal Western Pacific Warm Pool Variability: A Centroid and Heat Content Study
- PMID: 29030629
- PMCID: PMC5640631
- DOI: 10.1038/s41598-017-13351-x
Decadal Western Pacific Warm Pool Variability: A Centroid and Heat Content Study
Abstract
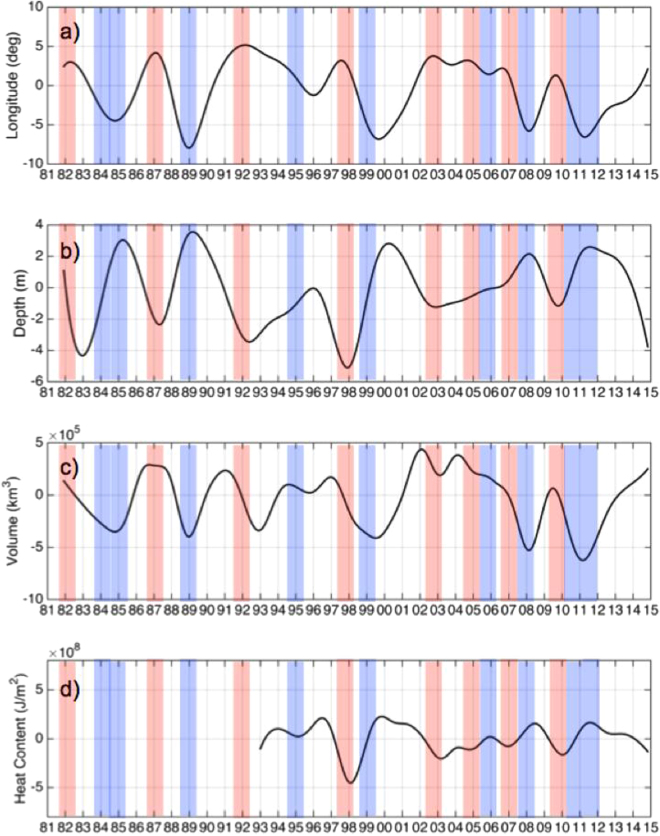
We examine several characteristics of the Western Pacific Warm Pool (WP) in the past thirty years of mixed interannual variability and climate change. Our study presents the three-dimensional WP centroid (WPC) movement, WP heat content anomaly (HC) and WP volume (WPV) on interannual to decadal time scales. We show the statistically significant correlation between each parameter's interannual anomaly and the NINO 3, NINO 3.4, NINO 4, SOI, and PDO indices. The longitudinal component of the WPC is most strongly correlated with NINO 4 (R = 0.78). The depth component of the WPC has the highest correlation (R = -0.6) with NINO3.4. The WPV and NINO4 have an R-Value of -0.65. HC has the highest correlation with NINO3.4 (R = -0.52). During the study period of 1982-2014, the non-linear trends, derived from ensemble empirical mode decomposition (EEMD), show that the WPV, WP depth and HC have all increased. The WPV has increased by 14% since 1982 and the HC has increased from -1 × 10⁸ J/m2 in 1993 to 10 × 108 J/m2 in 2014. While the largest variances in the latitudinal and longitudinal WPC locations are associated with annual and seasonal timescales, the largest variances in the WPV and HC are due to the multi-decadal non-linear trend.
Conflict of interest statement
The authors declare that they have no competing interests.
Figures


References
-
- Smith BD, Zeder MA. The onset of the Anthropocene. Anthropocene. 2013;4:8–13. doi: 10.1016/j.ancene.2013.05.001. - DOI
Publication types
LinkOut - more resources
Full Text Sources
Other Literature Sources
Miscellaneous
