

Nav1.8 neurons are involved in limiting acute phase responses to dietary fat
- PMID: 29031710
- PMCID: PMC5641637
- DOI: 10.1016/j.molmet.2017.07.012
Nav1.8 neurons are involved in limiting acute phase responses to dietary fat
Abstract
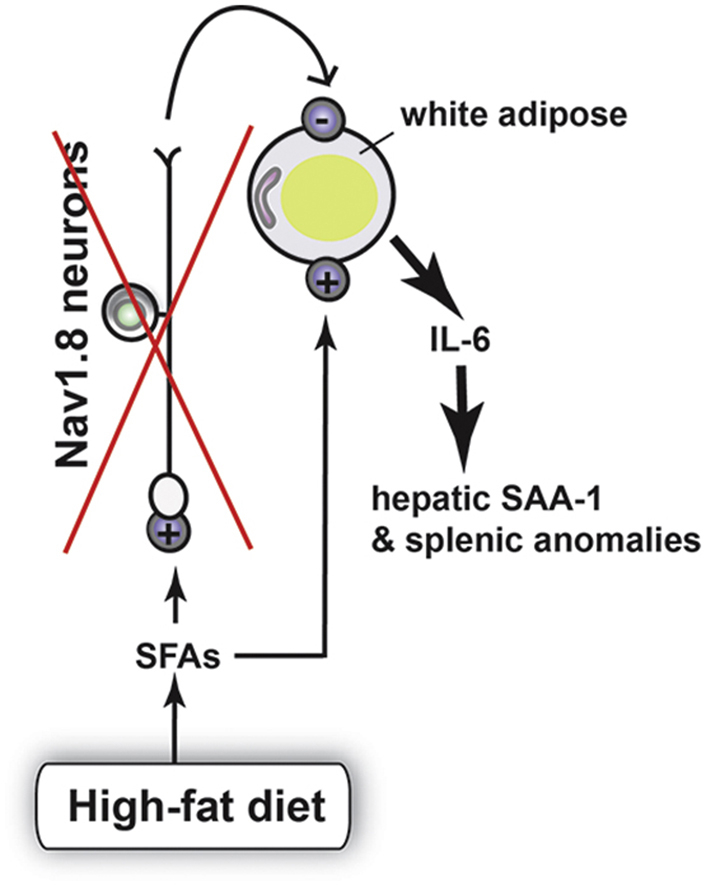
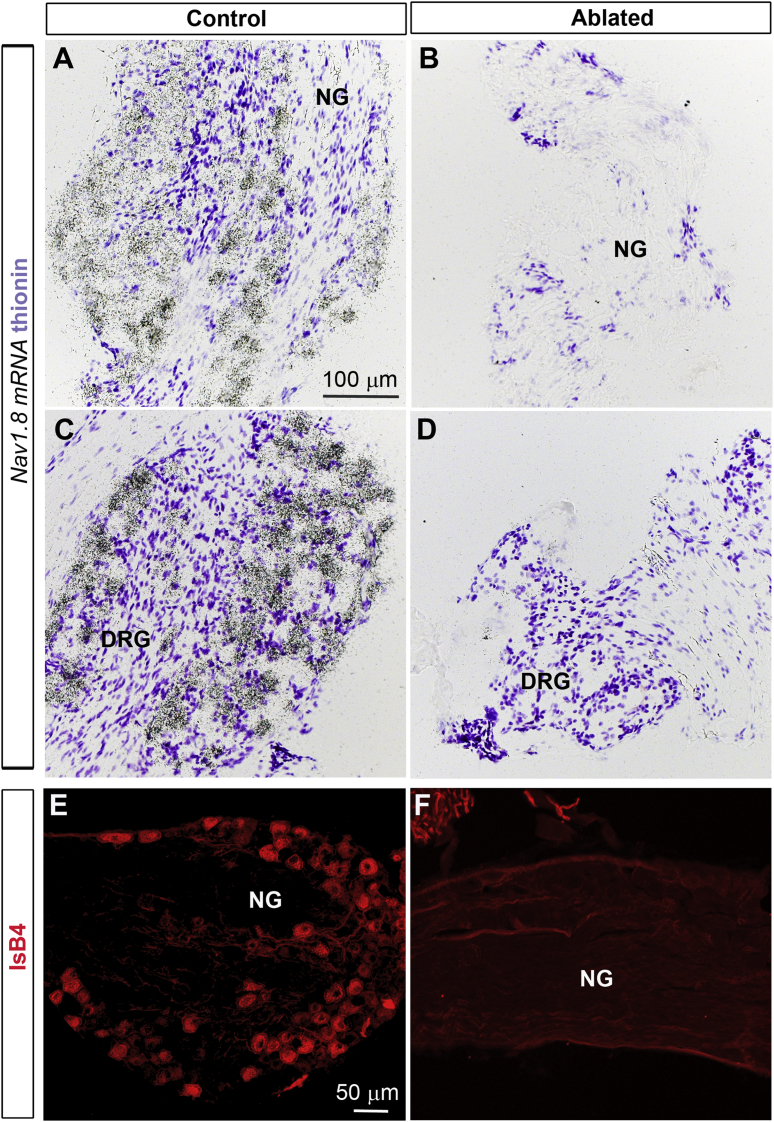
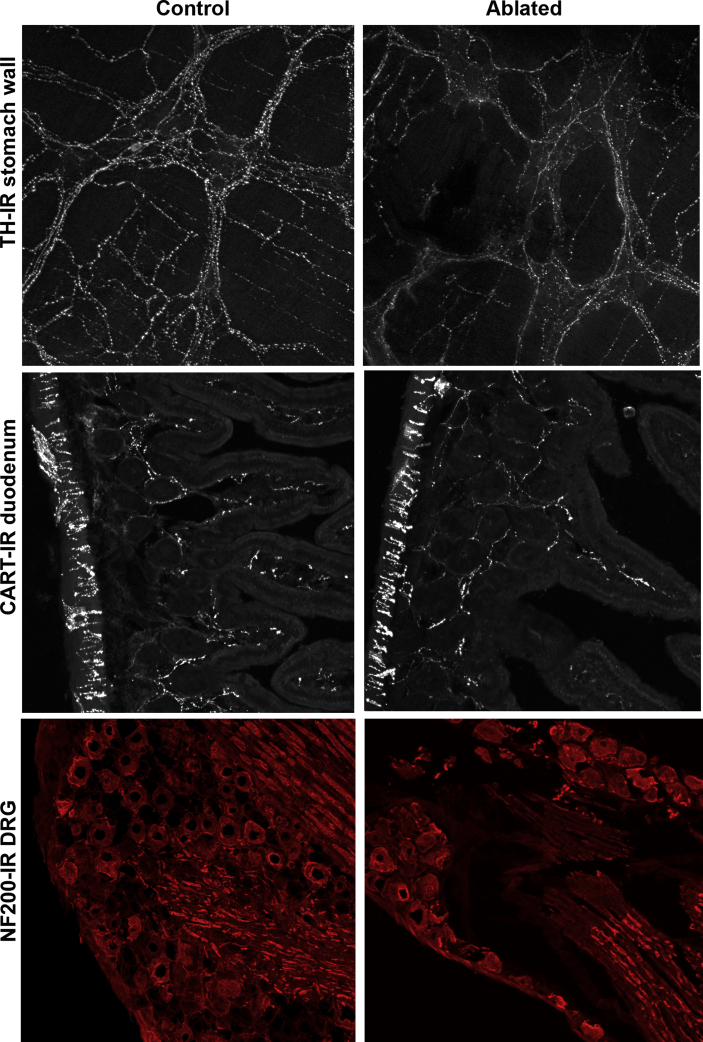
Objective and methods: Metabolic viscera and their vasculature are richly innervated by peripheral sensory neurons. Here, we examined the metabolic and inflammatory profiles of mice with selective ablation of all Nav1.8-expressing primary afferent neurons.
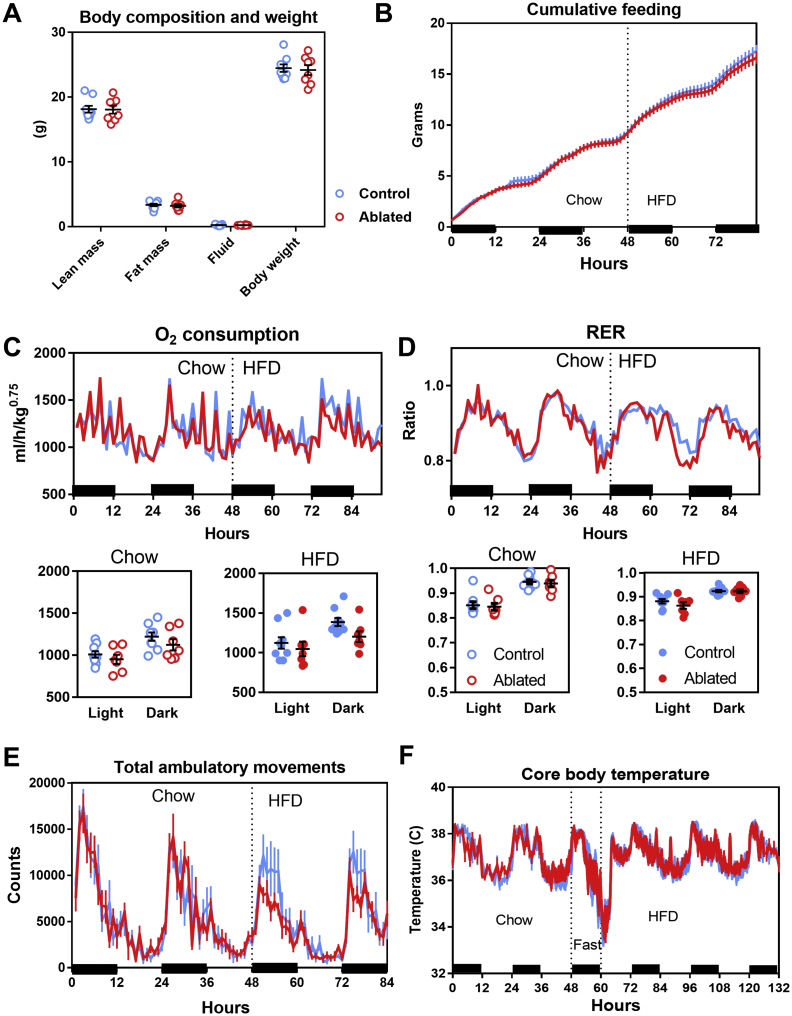
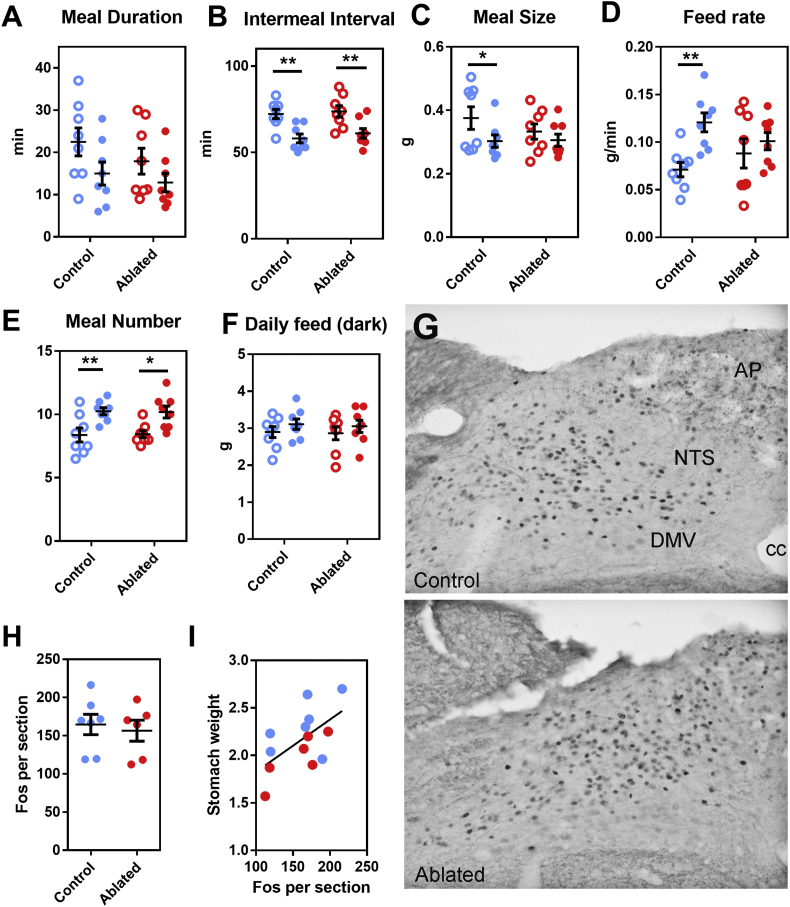
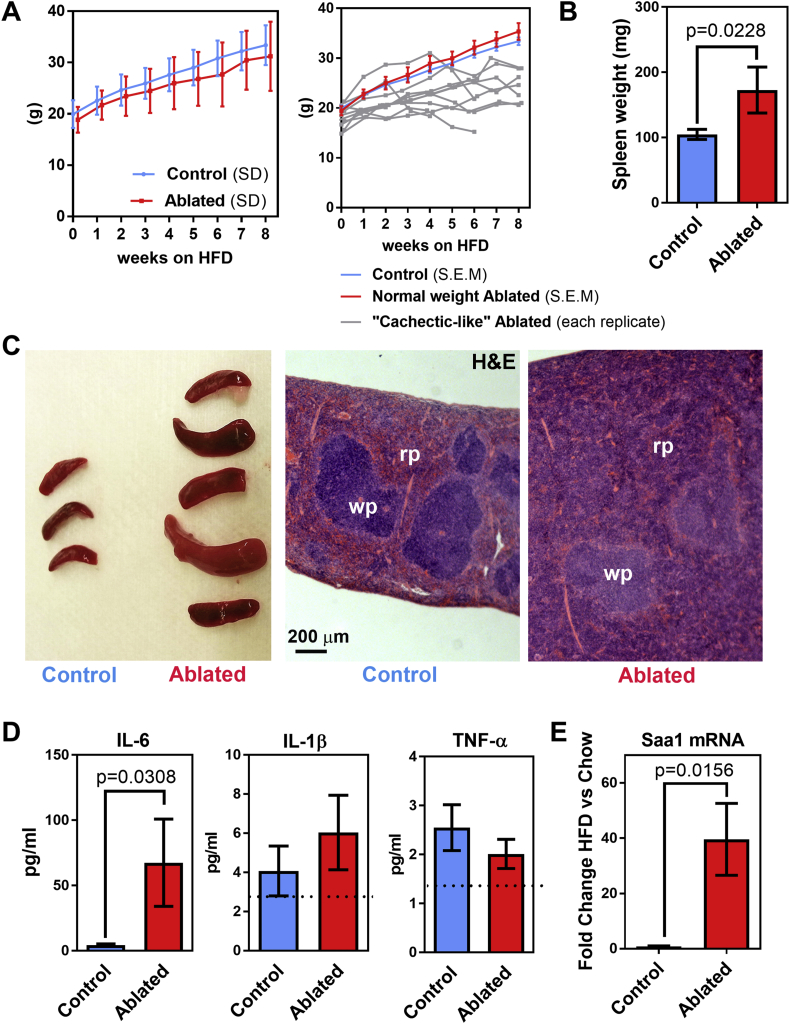
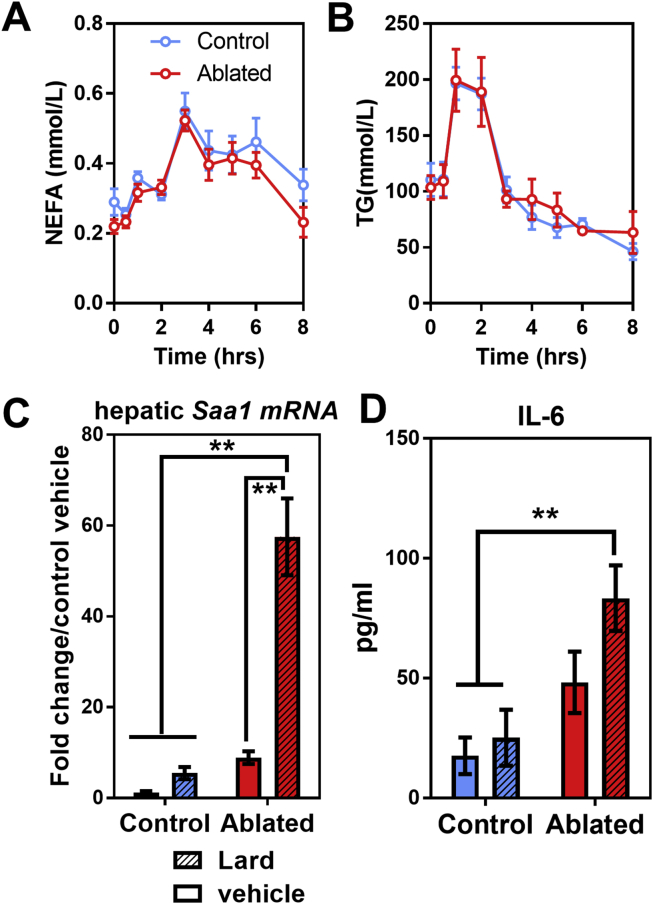
Results: While mice lacking sensory neurons displayed no differences in body weight, food intake, energy expenditure, or body composition compared to controls on chow diet, ablated mice developed an exaggerated inflammatory response to high-fat feeding characterized by bouts of weight loss, splenomegaly, elevated circulating interleukin-6 and hepatic serum amyloid A expression. This phenotype appeared to be directly mediated by the ingestion of saturated lipids.
Conclusions: These data demonstrate that the Nav1.8-expressing afferent neurons are not essential for energy balance but are required for limiting the acute phase response caused by an obesogenic diet.
Keywords: Deafferentation; Diphtheria toxin; Energy homeostasis; Inflammation; Nodose ganglion; Obesity.
Copyright © 2017 The Authors. Published by Elsevier GmbH.. All rights reserved.
Figures
Similar articles
-
Nav1.8-expressing neurons control daily oscillations of food intake, body weight and gut microbiota in mice.Commun Biol. 2024 Feb 22;7(1):219. doi: 10.1038/s42003-024-05905-3. Commun Biol. 2024. PMID: 38388698 Free PMC article.
-
The Ablation of Sensory Neurons Expressing the Nav1.8 Sodium Channel Improves Glucose Homeostasis and Amplifies the GLP-1 Signaling in Obese Female Mice.Mol Nutr Food Res. 2024 Feb;68(3):e2300474. doi: 10.1002/mnfr.202300474. Epub 2023 Dec 1. Mol Nutr Food Res. 2024. PMID: 38038153
-
An obligate role of oxytocin neurons in diet induced energy expenditure.PLoS One. 2012;7(9):e45167. doi: 10.1371/journal.pone.0045167. Epub 2012 Sep 18. PLoS One. 2012. PMID: 23028821 Free PMC article.
-
Fat intake and energy-balance effects.Physiol Behav. 2004 Dec 30;83(4):579-85. doi: 10.1016/j.physbeh.2004.07.027. Physiol Behav. 2004. PMID: 15621063 Review.
-
Dietary fat sensing via fatty acid oxidation in enterocytes: possible role in the control of eating.Am J Physiol Regul Integr Comp Physiol. 2011 Mar;300(3):R554-65. doi: 10.1152/ajpregu.00610.2010. Epub 2010 Dec 9. Am J Physiol Regul Integr Comp Physiol. 2011. PMID: 21148477 Review.
Cited by
-
Profiling of G protein-coupled receptors in vagal afferents reveals novel gut-to-brain sensing mechanisms.Mol Metab. 2018 Jun;12:62-75. doi: 10.1016/j.molmet.2018.03.016. Epub 2018 Apr 3. Mol Metab. 2018. PMID: 29673577 Free PMC article.
-
Chronic VEGFR-3 signaling preserves dendritic arborization and sensitization under stress.Brain Behav Immun. 2021 Nov;98:219-233. doi: 10.1016/j.bbi.2021.08.007. Epub 2021 Aug 11. Brain Behav Immun. 2021. PMID: 34389489 Free PMC article.
-
Dorsal Root Ganglia Macrophages Maintain Osteoarthritis Pain.J Neurosci. 2021 Sep 29;41(39):8249-8261. doi: 10.1523/JNEUROSCI.1787-20.2021. Epub 2021 Aug 16. J Neurosci. 2021. PMID: 34400519 Free PMC article.
-
Subdiaphragmatic Vagotomy With Pyloroplasty Ameliorates the Obesity Caused by Genetic Deletion of the Melanocortin 4 Receptor in the Mouse.Front Neurosci. 2018 Mar 1;12:104. doi: 10.3389/fnins.2018.00104. eCollection 2018. Front Neurosci. 2018. PMID: 29545738 Free PMC article.
-
Dissecting the Role of Subtypes of Gastrointestinal Vagal Afferents.Front Physiol. 2020 Jun 11;11:643. doi: 10.3389/fphys.2020.00643. eCollection 2020. Front Physiol. 2020. PMID: 32595525 Free PMC article. Review.
References
-
- Hotamisligil G.S. Inflammation and metabolic disorders. Nature. 2006;444(7121):860–867. - PubMed
-
- Roytblat L., Rachinsky M., Fisher A., Greemberg L., Shapira Y., Douvdevani A. Raised interleukin-6 levels in obese patients. Obesity Research. 2000;8(9):673–675. - PubMed
-
- Bastard J.P., Jardel C., Bruckert E., Blondy P., Capeau J., Laville M. Elevated levels of interleukin 6 are reduced in serum and subcutaneous adipose tissue of obese women after weight loss. Journal of Clinical Endocrinology & Metabolism. 2000;85(9):3338–3342. - PubMed
-
- Kern P.A., Ranganathan S., Li C., Wood L., Ranganathan G. Adipose tissue tumor necrosis factor and interleukin-6 expression in human obesity and insulin resistance. American Journal of Physiology – Endocrinology and Metabolism. 2001;280(5):E745–E751. - PubMed
Publication types
MeSH terms
Substances
Grants and funding
LinkOut - more resources
Full Text Sources
Other Literature Sources
Medical
Molecular Biology Databases
