Review
. 2017 Dec:113:311-322.
doi: 10.1016/j.freeradbiomed.2017.10.003. Epub 2017 Oct 13.

Limitations of oxygen delivery to cells in culture: An underappreciated problem in basic and translational research

Affiliations
Review

Limitations of oxygen delivery to cells in culture: An underappreciated problem in basic and translational research

Trenton L Place et al. Free Radic Biol Med. 2017 Dec.

Erratum in

Abstract

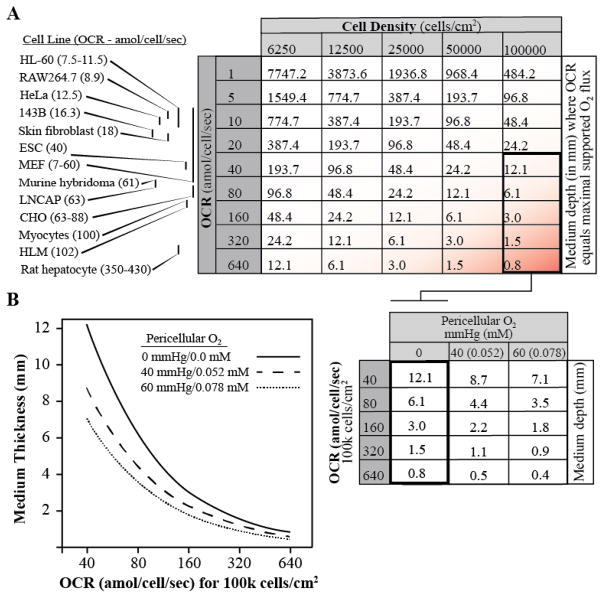
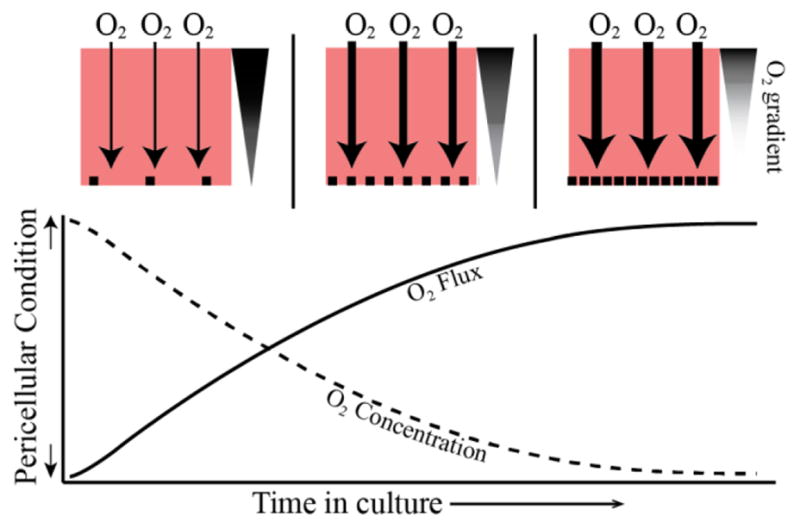
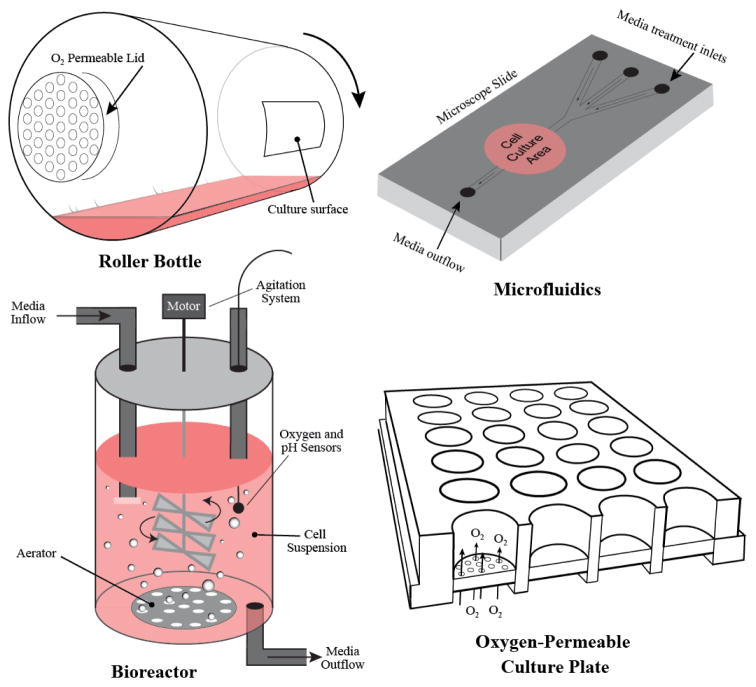
Molecular oxygen is one of the most important variables in modern cell culture systems. Fluctuations in its concentration can affect cell growth, differentiation, signaling, and free radical production. In order to maintain culture viability, experimental validity, and reproducibility, it is imperative that oxygen levels be consistently maintained within physiological "normoxic" limits. Use of the term normoxia, however, is not consistent among scientists who experiment in cell culture. It is typically used to describe the atmospheric conditions of a standard incubator, not the true microenvironment to which the cells are exposed. This error may lead to the situation where cells grown in a standard "normoxic" oxygen concentration may actually be experiencing a wide range of conditions ranging from hyperoxia to near-anoxic conditions at the cellular level. This apparent paradox is created by oxygen's sluggish rate of diffusion through aqueous medium, and the generally underappreciated effects that cell density, media volume, and barometric pressure can have on pericellular oxygen concentration in a cell culture system. This review aims to provide an overview of this phenomenon we have termed "consumptive oxygen depletion" (COD), and includes a basic review of the physics, potential consequences, and alternative culture methods currently available to help circumvent this largely unrecognized problem.

Keywords: Anoxia; Carbon dioxide; Cell culture; Cell lines; Diffusion constant; Diffusion gradients; Gasses; Glycolysis; HIF; Hyperoxia; Hypoxia; Hypoxia-inducible factor; Metabolism; Mitochondria; Nitrogen; Oxidative phosphorylation; Oxygen; Prolyl-hydroxylase; Reactive oxygen species; Respiration.


Conflict of interest statement

Conflict of Interest/Disclosure

None

Figures

Figure 1
Figure 1
The volume/volume ratio of oxygen to other gasses in a typical cell culture incubator is decreased compared to that of dry air. The left graph depicts the relative gas concentrations in dry air. The graph on the right is representative of the relative gas concentrations in a typical incubator where there is addition of CO2 gas and water vapor at 100% humidity.
Figure 2
Figure 2
The relationship between elevation above sea level and oxygen conditions in cell culture. This figure depicts the expected partial pressures as well as the corresponding molar concentrations of dissolved oxygen in cell culture medium under typical incubator settings* (5% CO2, 100% humidity, 37 ºC) in laboratories at different elevations. The predicted total atmospheric pressure (atm) at the atmospheric pressure of each location listed. At equilibrium, the amount of oxygen dissolved in the medium of a laboratory in Los Alamos is 76% of the amount of oxygen dissolved at sea level. The PO2 of oxygen at Los Alamos is just above that of normal human arterial blood (80–100 mm Hg). PV=nRT was used to calculate the corresponding molar concentrations of oxygen in air. Henry’s Law C=P/H (Equation #2) was used to calculate oxygen concentrations in culture medium using H = 7716.5 mm Hg/mM.
Figure 3
Figure 3
Relationship between molar concentration of O2 in air and cell culture medium under the same atmospheric conditions: PO2 = 149.7 mm Hg (sea level; 100% humidity; without added 5% CO2) and temperature = 37°C. Values for air were calculated using the Ideal Gas Law (Equation 2). Values for cell culture medium are assumed equivalent to those experimentally determined in a NaCl solution at an ionic strength of 175 mM (see Table 1) equilibrated with air under the above conditions.
Figure 4
Figure 4
A) A simplified graphical depiction of Fick’s Law in both physiological in vivo (alveoli; left) and in vitro (cell culture) examples. The barrier to oxygen diffusion is represented in pink, the oxygen supply is depicted in blue. B) The driving force for oxygen flux through the barrier is proportional to the degree of slope (y) of the oxygen gradient through the barrier. Slope is defined by the difference in oxygen concentration across the diffusion barrier (ΔC) divided by the thickness of the diffusion barrier (Δx). Of note, the concentration of oxygen represented as CA should be the expected value of dissolved oxygen in the medium when fully equilibrated with gaseous oxygen at the surface of the diffusion barrier as calculated by Henry’s Law, not the concentration of oxygen in the gaseous form above the medium.
Figure 5
Figure 5
A) Medium depths at which OCR of corresponding cells at different densities equals the maximal oxygen flux supported by the medium under typical incubator conditions. Oxygen flux was calculated using Fick’s Law (F = D × ΔCx) with D=2.69 × 10⁻⁵ cm2/s. The [O2] at the top of the medium was assumed to be in equilibration with typical incubator oxygen conditions (PO2=141.4 mm Hg/0.18 mM) and the perimitochondrial [O2] was set to zero (maximum gradient; ΔC = 0.018 mM). The OCR values for various cell lines listed, with ranges represented by bars corresponding to the numbers on the leftmost column of the table, were obtained from Wagner et. al [1]. For reference, 100,000 cells/cm2 is the density of a typical adherent cell line at 100% confluence [2]. B) Medium thicknesses (graphical view and corresponding chart) that are predicted produce steady-state pericellular O2 conditions of 0, 40 and 60 mm Hg respectively in cells with various OCRs grown at a fixed density of 100,000 cells/cm2. 40 and 60 mmHg are meant to be representative of physiologic conditions of various tissues [3].
Figure 6
Figure 6
The change in pericellular oxygen concentration (dotted line) and oxygen flux (solid line) through cell culture medium with a constant incubator oxygen concentration is depicted over time. At the top of the figure, pink boxes represent a cell culture dish at three time points after cells are seeded. At first (top left), cells are sparse and oxygen flux (downward arrows) is minimal. The oxygen gradient from the top of the medium to the bottom is also minimal as depicted by the triangle to the right. With time, the cells become denser and oxygen flux increases until cells reach confluency and oxygen flux is maximal and pericellular oxygen is at its minimum.
Figure 7
Figure 7
Alternative technology for cell culture that aim to improve control of oxygen delivery to cells in culture. The roller bottle (top left) is spun on its longitudinal axis so that the cells attached maintain a thin layer of medium on their surface that allows for rapid oxygen diffusion between the cells and the gas that passively diffuses into the bottle through the permeable lid. In the bioreactor (bottom left) well oxygenated medium is stirred continuously by an agitator to abolish oxygen gradients. Sensors allow for precise monitoring of dissolved oxygen concentrations and pH. For experiments involving cell imaging, microfluidic slides (top right) can be utilized to flow oxygenated medium that has been equilibrated with precise oxygen concentrations over cells attached to the microscope slide. The oxygen and nutrient content of the medium can be controlled by mixing medium through various ports or inlets. Finally, cells can be cultured on oxygen permeable plastic membranes (bottom right) that allow direct diffusion of oxygen from the bottom of the wells, bypassing the diffusion barrier created by the medium above and allowing for more precise control of oxygen conditions at the cellular level.

References

    1. Earle WR, Schilling EL, Stark TH, Straus NP. Production of malignancy in vitro. IV. The mouse fibroblast cultures and changes seen in the living cells. J Natl Cancer Inst. 1943
    1. Knoll AH. The Multiple Origins of Complex Multicellularity. Annu Rev Earth Planet Sci. 2011;39:217–239. doi: 10.1146/annurev.earth.031208.100209. - DOI
    1. Kety SS. The theory and applications of the exchange of inert gas at the lungs and tissues. Pharmacol Rev. 1951;3:1–41. - PubMed
    1. Krogh A. The supply of oxygen to the tissues and the regulation of the capillary circulation. J Physiol (Lond) 1919;52:457–474. - PMC - PubMed
    1. Krogh A. The rate of diffusion of gases through animal tissues, with some remarks on the coefficient of invasion. J Physiol (Lond) 1919;52:391–408. - PMC - PubMed