. 2017 Dec 8;292(49):20218-20227.
doi: 10.1074/jbc.M117.816702. Epub 2017 Oct 15.

Nanodisc-based kinetic assays reveal distinct effects of phospholipid headgroups on the phosphoenzyme transition of sarcoplasmic reticulum Ca2+-ATPase

Affiliations

Nanodisc-based kinetic assays reveal distinct effects of phospholipid headgroups on the phosphoenzyme transition of sarcoplasmic reticulum Ca2+-ATPase

Kazuo Yamasaki et al. J Biol Chem. .

Abstract

Sarco(endo)plasmic reticulum Ca2+-ATPase catalyzes ATP-driven Ca2+ transport from the cytoplasm to the lumen and is critical for a range of cell functions, including muscle relaxation. Here, we investigated the effects of the headgroups of the 1-palmitoyl-2-oleoyl glycerophospholipids phosphatidylcholine (PC), phosphatidylethanolamine (PE), phosphatidylserine (PS), and phosphatidylglycerol (PG) on sarcoplasmic reticulum (SR) Ca2+-ATPase embedded into a nanodisc, a lipid-bilayer construct harboring the specific lipid. We found that Ca2+-ATPase activity in a PC bilayer is comparable with that of SR vesicles and is suppressed in the other phospholipids, especially in PS. Ca2+ affinity at the high-affinity transport sites in PC was similar to that of SR vesicles, but 2-3-fold reduced in PE and PS. Ca2+ on- and off-rates in the non-phosphorylated ATPase were markedly reduced in PS. Rate-limiting phosphoenzyme (EP) conformational transition in 0.1 m KCl was as rapid in PC as in SR vesicles, but slowed in other phospholipids, especially in PS. Using kinetic plots of the logarithm of rate versus the square of mean activity coefficient of solutes in 0.1-1 m KCl, we noted that PC is optimal for the EP transition, but PG and especially PS had markedly unfavorable electrostatic effects, and PE exhibited a strong non-electrostatic restriction. Thus, the major SR membrane lipid PC is optimal for all steps and, unlike the other headgroups, contributes favorable electrostatics and non-electrostatic elements during the EP transition. Our analyses further revealed that the surface charge of the lipid bilayer directly modulates the transition rate.

Keywords: calcium ATPase; kinetics; lipid-protein interaction; membrane enzyme; phospholipid; sarcoplasmic reticulum (SR).


Conflict of interest statement

The authors declare that they have no conflicts of interest with the contents of this article

Figures

Figure 1.
Figure 1.
Crystal structure and reaction scheme of SERCA1a. The coordinates for the structure E1Ca2 were obtained from the Protein Data Bank (accession code 1SU4 (4)). The cytoplasmic domains A, P, and N are colored yellow, cyan, and pink, respectively, and transmembrane helices are shown in gray with the two bound Ca2+ ions in red. The approximate position of the membrane region is shown by horizontal lines.
Figure 2.
Figure 2.
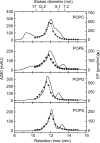
Elution profiles in size-exclusion column chromatography. The profile on the ENrich SEC 650 column for CNDs constructed with the indicated lipid is shown. The closed circles show the EP formation activity of each fraction. The Stokes diameter scale calibrated by standard proteins (bovine thyroglobulin, 17 nm; horse spleen apoferritin, 12.2 nm; yeast alcohol dehydrogenase, 9.1 nm; and bovine serum albumin, 7.2 nm) is shown in the top panel. mAU, milliabsorbance units.
Figure 3.
Figure 3.
PAGE analyses of empty and SERCA1a-containing nanodiscs. A, CND samples collected at 11.5–12 min and empty nanodisc samples collected at 12.2–13.3 min in the size-exclusion chromatography were subjected to native PAGE. The MSP1D1 protein (right lane) and marker proteins generally used (left lane) were applied in the gel. These marker proteins are bovine thyroglobulin (Rf = 0.13 ± 0.01), sweet potato β-amylase (Rf = 0.21 ± 0.01), and bovine serum albumin (Rf = 0.42 ± 0.02). + and −, (+)-electrode and (−)-electrode, respectively. B, molar ratio of MSP1D1/SERCA1a in CNDs. CNDs constructed with the indicated lipid and collected in the column chromatography were subjected to SDS-PAGE and protein staining as described under “Experimental procedures.” PG/PC and PS/PC in the two lanes are for CNDs made with the lipids in a 1:1 molar ratio. For quantification of protein contents, SERCA1a purified by deoxycholate treatment of SR vesicles (38) and purified MSP1D1 were applied on the same gel as standards. The molar protein ratios thus obtained are shown above each lane. C, second size-exclusion column chromatography and MSP1D1/SERCA1a molar ratio. CND with PC collected in the first size-exclusion column chromatography in Fig. 2 at 11.5–12.0-min retention time (min) was concentrated and applied to the second size-exclusion column chromatography. The molar ratio of MSP1D1/SERCA1a was determined in each fraction and shown with gray bars.
Figure 4.
Figure 4.
Visualization of PC CND and PC empty nanodisc by transmission electron microscopy. Negative staining with uranyl acetate of a field of empty nanodiscs (A) and CND (B) made with PC is shown. Scale bars, 50 nm. C, histograms show the Feret diameters of nanodiscs determined with the empty nanodiscs (open bars) and CNDs (gray bars). The diameters are 14.9 ± 1.5 nm (n = 100) of CND and 11.9 ± 1.2 nm (n = 100) of the empty nanodisc. D, a SERCA1a molecule in nanodisc is shown as a schematic.
Figure 5.
Figure 5.
A, Ca2+-ATPase turnover rate was determined with SR vesicles (SRV) and CND samples constructed with SRL, PC, PE, PG, and PS, as shown in the presence (gray bars) or absence (open bars) of 3 μm Ca2+ ionophore A23187. B, the turnover rate was determined without A23187 in the presence (gray bars) or absence (open bars) of 2 mm C12E8 and 1 mm POPC. Values are the mean ± S.D. (error bars) from at least three experiments.
Figure 6.
Figure 6.
Ca2+ dependence of EP formation and Ca2+ release rate from E1Ca2. A, samples were incubated with various concentrations of CaCl2 as indicated for 10 s or with CND constructed with POPS for 120 s in the EP formation solution containing 50 mm MOPS/Tris (pH 7.0), 0.1 m KCl, 7 mm MgCl2, 1 mm EGTA, and 3 μm A23187. Then EP formation was performed by the addition of 10 μm [γ-32P]ATP for 3 s. The values are the means ± S.D. (error bars) in at least three experiments. The solid lines show the least-squares fit to the Hill equation with the fitting parameters Kd and Hill coefficient (nH) listed in Table 1. The amount of EP was normalized to the maximum level of EP. B, samples were incubated with 0.2 mm CaCl2, otherwise as described above, and mixed with an equal volume of 2 mm EGTA in the same buffer without added CaCl2. At the indicated times after the EGTA addition, the reaction mixture was further mixed with the same volume of a solution containing 20 μm [γ-32P]ATP and 2 mm EGTA without added CaCl2, otherwise as above. Then the reaction was terminated by acid at 2 s after the ATP addition. The solid lines show the least-squares fit to a single exponential decay. The rate thus obtained represents Ca2+ off-rate, and is listed in Table 1 together with the Ca2+ on-rate calculated with the off-rate and Kd.
Figure 7.
Figure 7.
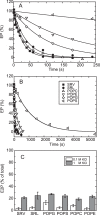
Time course of rate-limiting EP transition in EP decay. A, EP was formed with 10 μm [γ-32P]ATP for 10 s in 10 μm CaCl2 and 0.1 m KCl, and the reaction was chased by the addition of the same volume of 4 mm EGTA solution, otherwise as described under “Experimental procedures.” At the indicated times after the EGTA addition, the reaction was terminated by acid, and the amount of EP was determined. Almost all of the EP formed at 10 s (steady state) is E1P (C); therefore, the EP decay represents the rate-limiting EP transition. B, EP decay time course over a period long enough for EP decay in CND with POPS to be nearly completed. The solid lines show the least-squares fit to a single exponential decay, and the rate constants thus obtained (mean ± S.E.) in s−1 are for SR vesicles (0.0388 ± 0.0020) and for CNDs with SRL (0.02503 ± 0.0012), with POPC (0.0325 ± 0.0012), with POPE (0.00528 ± 0.00019), with POPG (0.00988 ± 0.00017), and with POPS (0.000838 ± 0.000044). C, the amount of E2P was determined by adding an equal volume of a solution containing 2 mm ADP and 2 mm EGTA, followed by the trichloroacetic acid addition at 1 s after the ADP addition. The amount of E2P is indicated as a percentage of total EP.
Figure 8.
Figure 8.
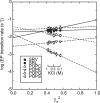
Relationship between logarithm of EP transition rate and square of mean activity coefficient γ±2. A, EP transition rates were determined with SR vesicles and CNDs in various concentrations of KCl as indicated, otherwise as described in Fig. 7, and their logarithms are plotted versus γ±2. The values presented are the mean ± S.D. (error bars) (n = 3–5). Solid lines (SR vesicles and CND with SR lipids SRL) and dashed lines (other CNDs) show the least-squares fit in a linear regression, and the fitting parameters, the slope and the intercept at γ±2 = 0, are listed in Table 2.
Figure 9.
Figure 9.
Effects of lipid composition in CND on the slope in the log(rate) versus γ±2 plot and Rf value in native PAGE. A, the log(EP transition rate) versus γ±2 was determined as in Fig. 8 with CND constructed with various molar ratios of a mixture of PG and PC, and representative data are shown. The values presented are the mean ± S.D. (error bars) (n = 3–5). Solid lines show the least-squares fit in a linear regression. B, CNDs constructed with various molar ratios of PG/PC mixture and of PS/PC mixture were subjected to native PAGE. The marker proteins are applied in the left and right lanes (denoted as M) as in Fig. 3A. C, the Rf values thus obtained are shown. D, the analysis as in A was performed with CNDs of PC, PG, PS, and various molar ratios of PG/PC mixture and PS/PC mixture, and the slope in the plot log(rate) versus γ±2 was determined and plotted against the Rf value in the native PAGE. The values are the mean ± S.D. (n ≥ 3) for the Rf and the mean ± S.E. (n ≥3) for the slope in the plot.

References

    1. Toyoshima C. (2008) Structural aspects of ion pumping by Ca2+-ATPase of sarcoplasmic reticulum. Arch. Biochem. Biophys. 476, 3–11 - PubMed
    1. Toyoshima C. (2009) How Ca2+-ATPase pumps ions across the sarcoplasmic reticulum membrane. Biochim. Biophys. Acta 1793, 941–946 - PubMed
    1. Møller J. V., Olesen C., Winther A.-M. L., and Nissen P. (2010) The sarcoplasmic Ca2+-ATPase: design of a perfect chemi-osmotic pump. Q. Rev. Biophys. 43, 501–566 - PubMed
    1. Toyoshima C., Nakasako M., Nomura H., and Ogawa H. (2000) Crystal structure of the calcium pump of sarcoplasmic reticulum at 2.6 Å resolution. Nature 405, 647–655 - PubMed
    1. Danko S., Yamasaki K., Daiho T., and Suzuki H., and Toyoshima C. (2001) Organization of cytoplasmic domains of sarcoplasmic reticulum Ca2+-ATPase in E1P and E1ATP states: a limited proteolysis study. FEBS Lett. 505, 129–135 - PubMed

Associated data