

Ultra-processed foods, protein leverage and energy intake in the USA
- PMID: 29032787
- PMCID: PMC10260799
- DOI: 10.1017/S1368980017001574
Ultra-processed foods, protein leverage and energy intake in the USA
Abstract
Objective: Experimental studies have shown that human macronutrient regulation minimizes variation in absolute protein intake and consequently energy intake varies passively with dietary protein density ('protein leverage'). According to the 'protein leverage hypothesis' (PLH), protein leverage interacts with a reduction in dietary protein density to drive energy overconsumption and obesity. Worldwide increase in consumption of ultra-processed foods (UPF) has been hypothesized to be an important determinant of dietary protein dilution, and consequently an ecological driving force of energy overconsumption and the obesity pandemic. The present study examined the relationships between dietary contribution of UPF, dietary proportional protein content and the absolute intakes of protein and energy.
Design: National representative cross-sectional study.
Setting: National Health and Nutrition Examination Survey 2009-2010.
Subjects: Participants (n 9042) aged ≥2 years with at least one day of 24 h dietary recall data.
Results: We found a strong inverse relationship between consumption of UPF and dietary protein density, with mean protein content dropping from 18·2 to 13·3 % between the lowest and highest quintiles of dietary contribution of UPF. Consistent with the PLH, increase in the dietary contribution of UPF (previously shown to be inversely associated with protein density) was also associated with a rise in total energy intake, while absolute protein intake remained relatively constant.
Conclusions: The protein-diluting effect of UPF might be one mechanism accounting for their association with excess energy intake. Reducing UPF contribution in the US diet may be an effective way to increase its dietary protein concentration and prevent excessive energy intake.
Keywords: Dietary protein content; NHANES; Protein leverage hypothesis; Ultra-processed foods.
Figures
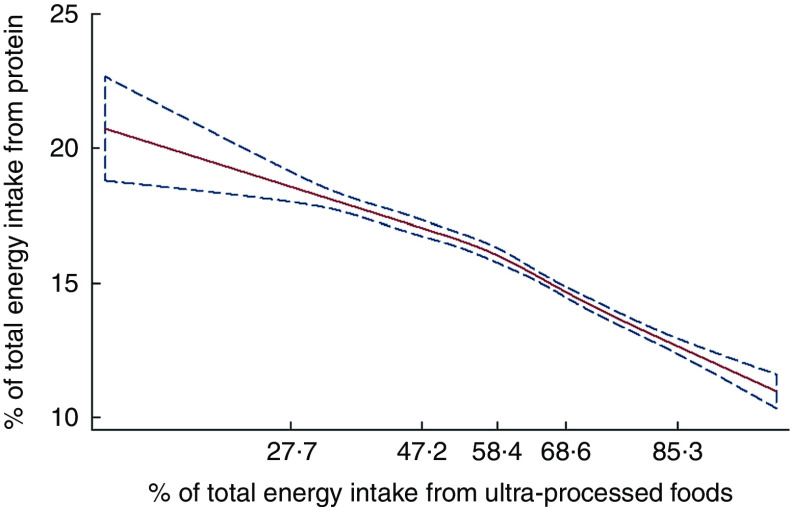
 , predicted values;
  , 95 % CI), among the US population aged ≥2 years (n 9042), National Health and Nutrition Examination Survey 2009–2010. The values shown on the x-axis correspond to the 5th, 27·5th, 50th, 72·5th and 95th percentiles for percentage of total energy from ultra-processed foods (knots). Coefficient for linear term=−0·08 (95 % CI −0·13, −0·03). There was little evidence of non-linearity in the restricted cubic spline model (Wald test for linear term P=0·006; Wald test for all non-linear terms P=0·07)
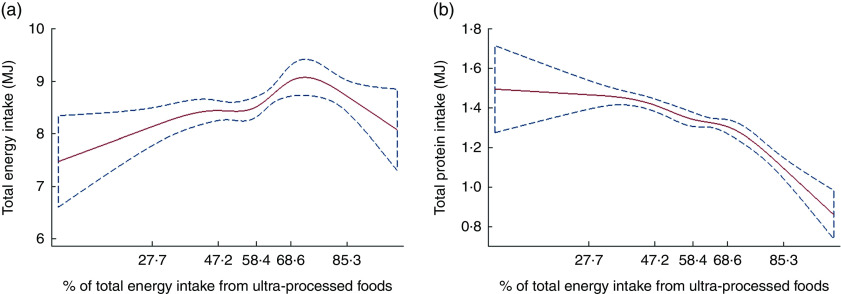 , predicted values; , 95 % CI), among the US population aged ≥2 years (n 9042), National Health and Nutrition Examination Survey 2009–2010. (a) The values shown on the x-axis correspond to the 5th, 27·5th, 50th, 72·5th and 95th percentiles for percentage of total energy from ultra-processed foods (knots). Coefficient for linear term=0·024 (95 % CI 0·002, 0·046). There was little evidence of linearity in the restricted cubic spline model (Wald test for linear term P=0·035; Wald test for all non-linear terms P=0·049). (b) The values shown on the x-axis correspond to the 5th, 27·5th, 50th, 72·5th and 95th percentiles for percentage of total energy from ultra-processed foods (knots). Coefficient for linear term=−0·001 (95 % CI −0·007, 0·004). There was little evidence of linearity in the restricted cubic spline model (Wald test for linear term P=0·7; Wald test for all non-linear terms P=0·0009; Wald test for all terms P<0·001)
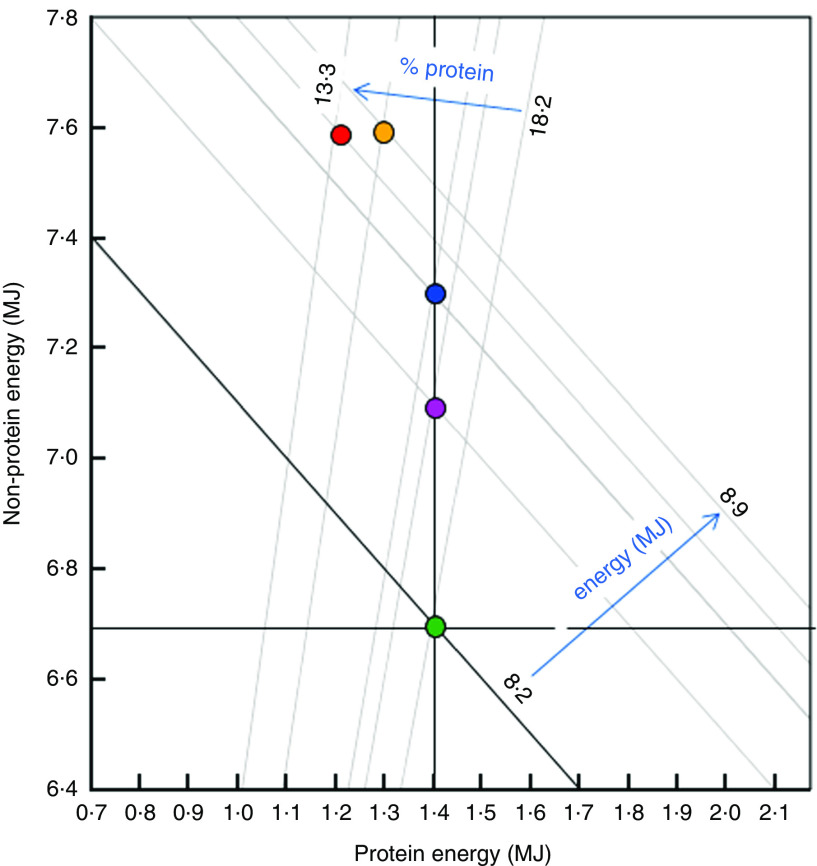
 , 1;
, 1;  , 2;
, 2;  , 3;
, 3;  , 4;
, 4;  , 5). The negatively sloped diagonals represent daily total energy intakes (calculated as the sum of X +Y) and the positive radials represent the ratio of dietary protein energy to non-protein energy (X/Y). The dark vertical, horizontal and diagonal lines represent alternative models to explain the data. Vertical: complete protein prioritization, in which absolute protein energy intake remains constant with decreasing dietary percentage of protein. Under this scenario, a decrease in dietary percentage of protein (upper blue arrow) leads to an increase in total energy intake (lower blue arrow). Horizontal: complete non-protein prioritization, in which non-protein energy intake remains constant and protein energy intake changes with decreasing dietary percentage of protein. Diagonal: total energy prioritization, in which decreasing dietary percentage of protein is associated with counter-balancing changes in protein and non-protein energy intakes, such that total energy intake is not affected by increasing ultra-processed food contribution in the diet. The data closely fit the protein prioritization model
References
-
- Scrinis G (2013) Nutritionism: The Science and Politics of Dietary Advice. New York: Columbia University Press.
-
- Bray GA & Popkin BM (1998) Dietary fat intake does affect obesity! Am J Clin Nutr 68, 1157–1173. - PubMed
-
- Stubbs RJ, Mazlan N & Whybrow S (2001) Carbohydrates, appetite and feeding behavior in humans. J Nutr 131, issue 10, 2775S–2781S. - PubMed
-
- Willet WC (1998) Dietary fat and obesity: an unconvincing relation. Am J Clin Nutr 68, 1149–1150. - PubMed
-
- Simpson SJ & Raubenheimer D (2005) Obesity: the protein leverage hypothesis. Obes Rev 6, 133–142. - PubMed
MeSH terms
Substances
LinkOut - more resources
Full Text Sources
Other Literature Sources
Medical
