. 2017 Oct 19;171(3):573-587.e14.
doi: 10.1016/j.cell.2017.09.018. Epub 2017 Oct 12.

Genome-Nuclear Lamina Interactions Regulate Cardiac Stem Cell Lineage Restriction

Affiliations

Genome-Nuclear Lamina Interactions Regulate Cardiac Stem Cell Lineage Restriction

Andrey Poleshko et al. Cell. .

Abstract

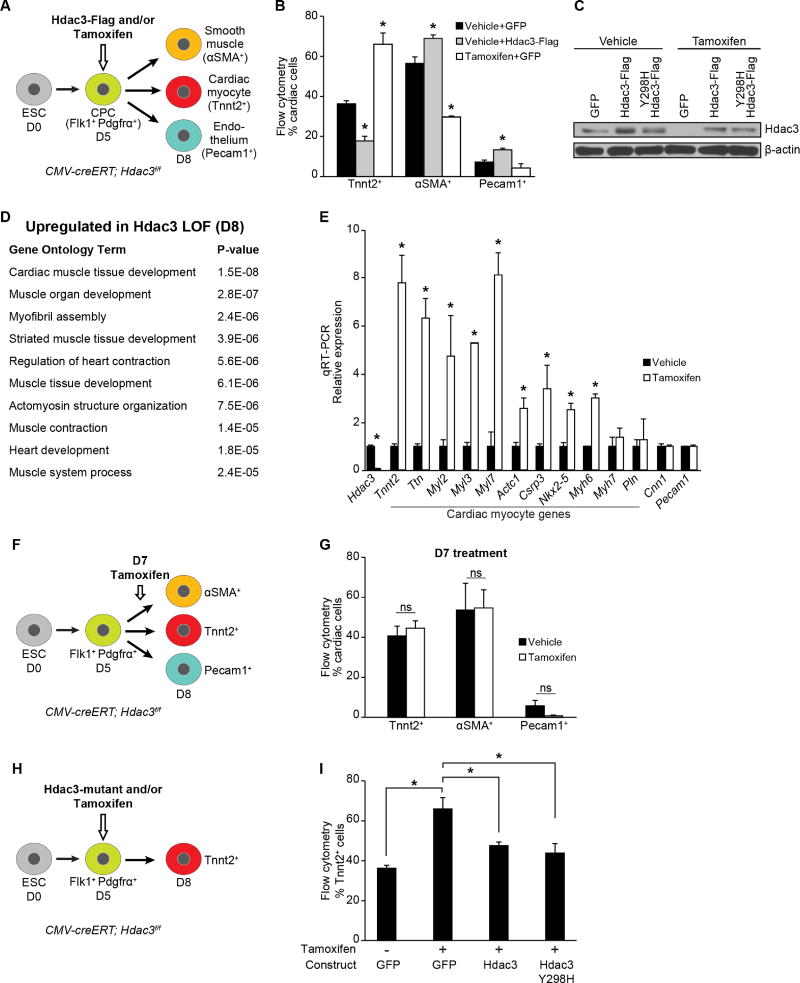
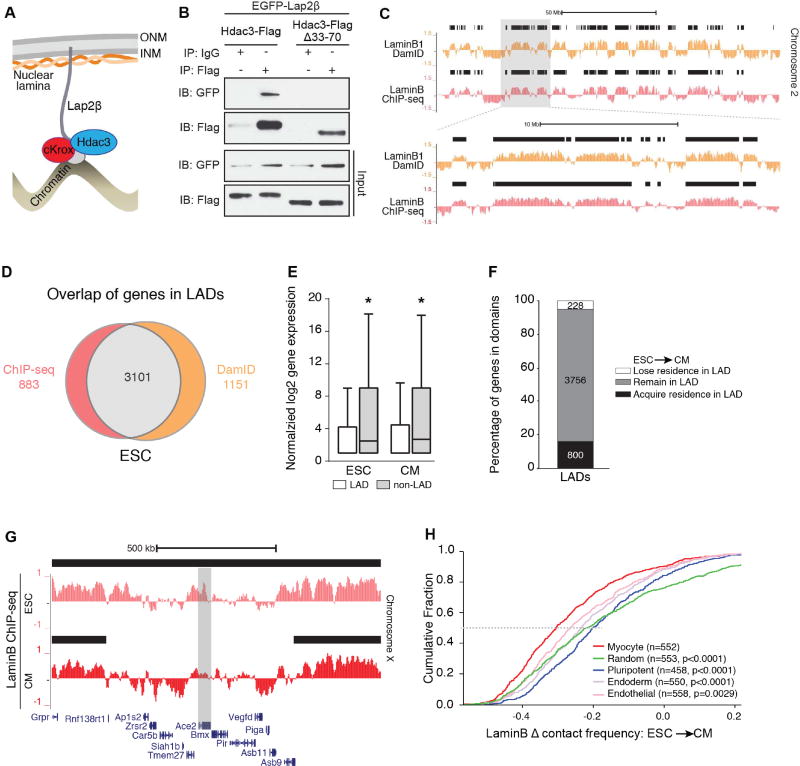
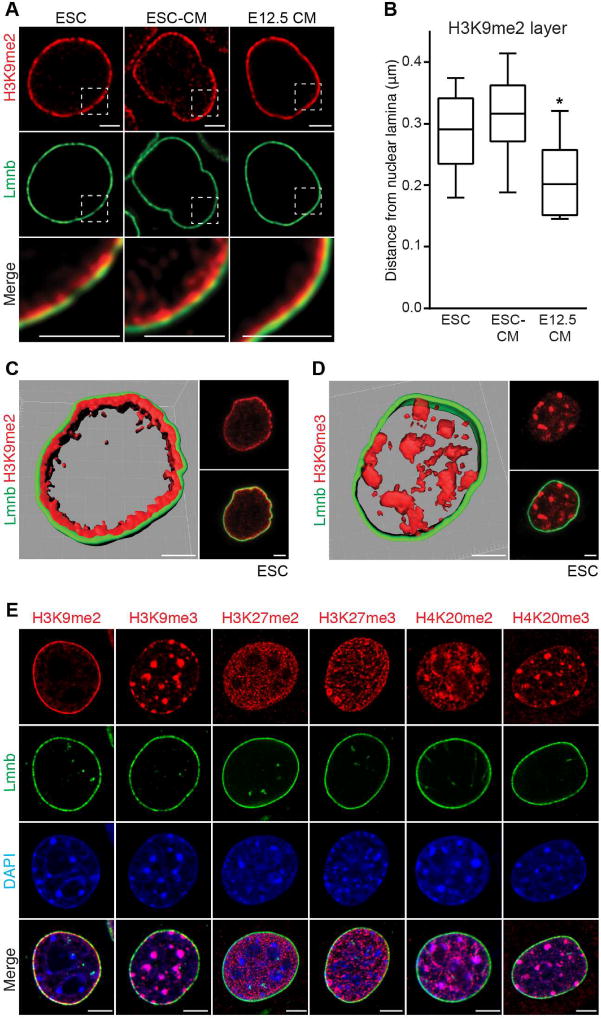
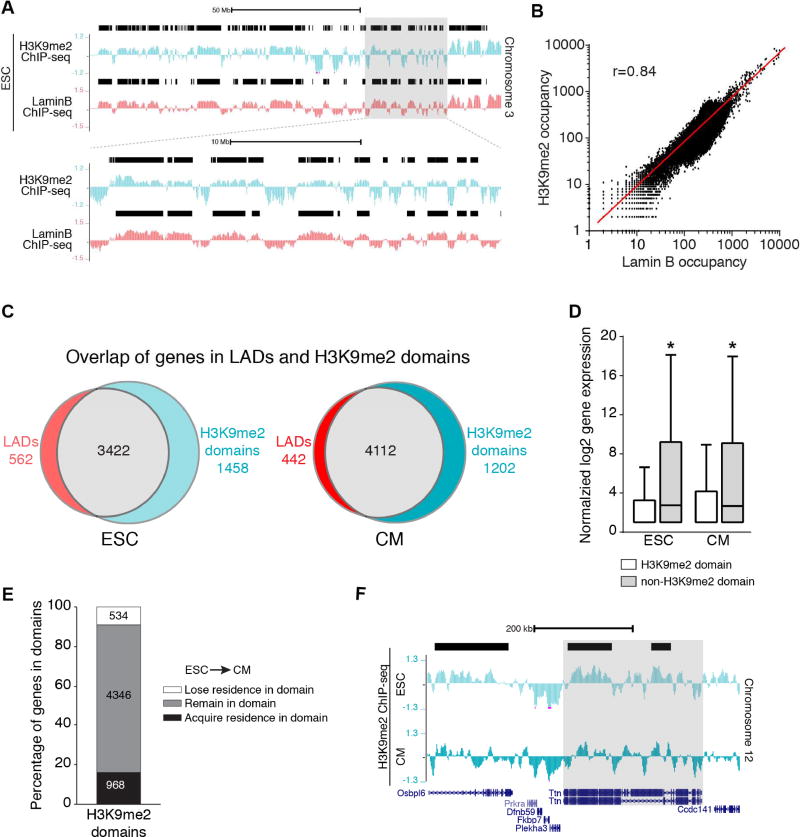
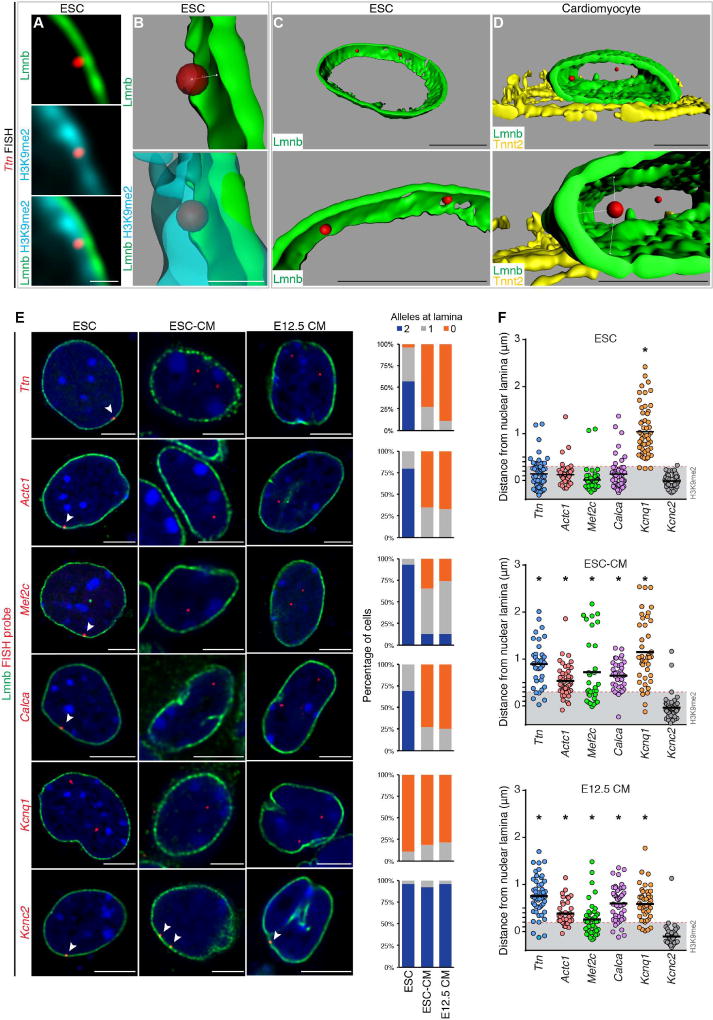
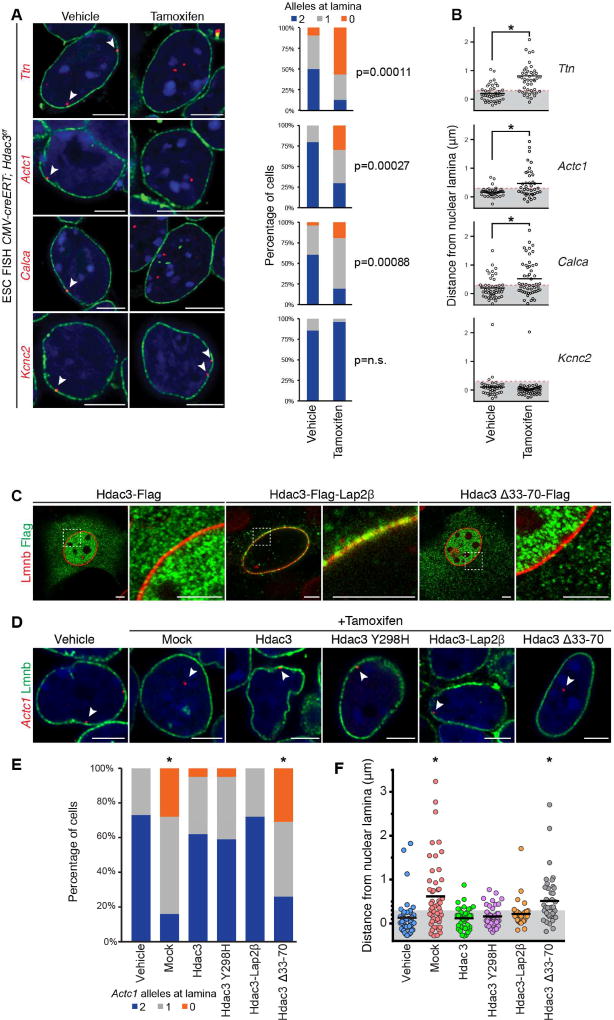
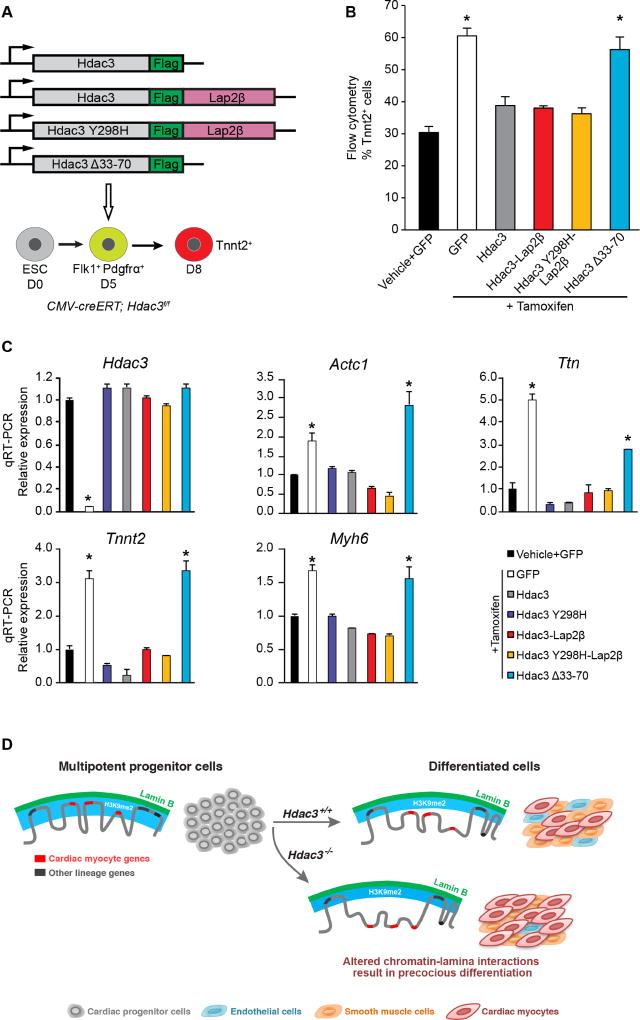
Progenitor cells differentiate into specialized cell types through coordinated expression of lineage-specific genes and modification of complex chromatin configurations. We demonstrate that a histone deacetylase (Hdac3) organizes heterochromatin at the nuclear lamina during cardiac progenitor lineage restriction. Specification of cardiomyocytes is associated with reorganization of peripheral heterochromatin, and independent of deacetylase activity, Hdac3 tethers peripheral heterochromatin containing lineage-relevant genes to the nuclear lamina. Deletion of Hdac3 in cardiac progenitor cells releases genomic regions from the nuclear periphery, leading to precocious cardiac gene expression and differentiation into cardiomyocytes; in contrast, restricting Hdac3 to the nuclear periphery rescues myogenesis in progenitors otherwise lacking Hdac3. Our results suggest that availability of genomic regions for activation by lineage-specific factors is regulated in part through dynamic chromatin-nuclear lamina interactions and that competence of a progenitor cell to respond to differentiation signals may depend upon coordinated movement of responding gene loci away from the nuclear periphery.

Keywords: cardiac specification; cellular competence; genome organization; lineage restriction; nuclear lamina.


Figures

Figure 1
Figure 1. Hdac3 represses differentiation of cardiac progenitor into cardiomyocytes
(A) Schema of cardiac differentiation of mouse ESCs into multipotent progenitors that give rise to indicated differentiated cell types. (B) Percentage of each cell type measured by flow cytometry at day 8. Cells overexpressing Hdac3 (vehicle+Hdac3-Flag) at day 5 of differentiation show a decrease in Tnnt2+ CMs; tamoxifen-mediated Hdac3 deletion (Tamoxifen+GFP) increases the number of Tnnt2+ CMs. (C) Immunoblot of total Hdac3 and loading control (β-actin) following transduction of CMV-creERT; Hdac3f/f ESCs with GFP control or indicated Hdac3 construct with vehicle or tamoxifen treatment. (D) GO analysis of gene expression data from day 8 tamoxifen-mediated Hdac3 deletion compared to control cultures identifies cardiac-specific GO terms associated with Hdac3 loss-of-function. (E) Gene expression (qRT-PCR) of candidate genes chosen from GO terms in (D) relative to Gapdh. (F) Schema of tamoxifen-mediated Hdac3 deletion at day 7 of differentiation. (G) Tamoxifen-mediated Hdac3 deletion starting at day 7 of cardiac differentiation shows no difference in percentage of each cell type measured by flow cytometry at day 8 compared to vehicle. (H) Schema of tamoxifen-mediated Hdac3 deletion and transduction of wildtype or mutant constructs at day 5 of differentiation. (I) Percentage of Tnnt2+ CMs measured by flow cytometry at day 8 (cells treated at day 5 with tamoxifen and transduced with wild-type Hdac3 or Hdac3Y298H mutant). Data represent mean ± SEM, n≥3 replicates for (B, E, G, I). (B, I) analyzed by one-way ANOVA, with a Tukey post-hoc test. (E, G) analyzed by two-tailed Student’s t-test; statistical comparisons are to vehicle. * p< 0.05. See Fig. S1, Table S1.
Figure 2
Figure 2. Reorganization of lamina-bound chromatin during cardiogenesis
(A) Model of Hdac3 interaction with components of the nuclear periphery; ONM: outer nuclear membrane; INM: inner nuclear membrane. (B) Immunoblots of co-IP and input lysates from 293T cells transfected with indicated constructs; IP: antibody used for immunoprecipitation; IB: antibody used for immunoblot. (C) Representative genome tracks of LaminB1 DamID (Peric-Hupkes et al., 2010) and input-normalized Lamin B ChIP-seq from ESCs. Area in gray box is magnified in lower set of tracks. Black bars indicate regions defined as LADs by EDD. (D) Overlap of genes defined in LADs using LaminB ChIP-seq and LaminB1 DamID (Peric-Hupkes et al., 2010). (E) Comparison of normalized log2 gene expression (Wamstad et al., 2012) of genes in LADs and non-LAD regions in ESCs and CMs (median expression with Tukey confidence intervals). (F) Stacked bar graph: number of genes that acquire, remain, or lose LAD residence in CMs compared to ESCs. (G) LaminB ChIP-seq tracks from ESC and CM show the cardiac gene Ace2 losing residence in a LAD in CM compared to ESC; black bars: LADs. (H) Change in Lamin B contact frequency between ESCs and CMs for myocyte signature genes compared to gene set signatures from pluripotent, endoderm, and endothelial cells, and a random gene set; n=number of genes in each set; p: significance of fold change differences between each gene set compared to the myocyte genes analyzed by one-way ANOVA Kruskal-Wallis Test. See Fig. S2, Tables S2, S3.
Figure 3
Figure 3. H3K9me2 marks peripheral heterochromatin
(A) H3K9me2 and Lamin B (Lmnb) immunostaining of indicated cell types. Areas in dotted boxes highlighted in bottom row. (B) Depth of H3K9me2-marked layer of chromatin at nuclear lamina in indicated cell types. 30 locations measured in each cell type, plot shows median distance with Tukey confidence intervals. Analyzed by one-way ANOVA Kruskal-Wallis Test. (C, D) H3K9me2 (C) or H3K9me3 (D) alongside LaminB IF and 3D reconstruction of Z-stack of images in pluripotent ESCs; scale bars: 2.5 µm. (E) IF of skeletal myoblasts with indicated repressive chromatin marks and LaminB. See Fig. S3, Table S4.
Figure 4
Figure 4. H3K9me2-marked chromatin mirrors lamina bound chromatin
(A) Representative H3K9me2 and LaminB ChIP-seq tracks from ESCs (Chr 3). Black bars represent LADs. Area in gray box is magnified below top set of tracks. (B) Correlation of LaminB and H3K9me2 occupancy in the genome in 10 kb bins; Pearson’s correlation r = 0.84. (C) Overlap of genes in LADs and H3K9me2 domains. (D) Distribution of normalized log2 gene expression (Wamstad et al., 2012) of genes in H3K9me2 domains and non-H3K9me2 regions in ESC and CMs; median expression with Tukey confidence intervals; significance determined with one-way ANOVA Kruskal-Wallis Test. (E) Number of genes that acquire, remain, or lose residence in H3K9me2 domains in CMs compared to ESCs. (F) H3K9me2 ChIP-seq tracks in ESC and CMs, highlighting Ttn losing residence in a H3K9me2 domain (black bar) in CM compared to ESC. See Fig. S4, Table S2.
Figure 5
Figure 5. Cardiac genes are released from the nuclear lamina during cardiac differentiation
(A–C) Immunostaining (A) and 3D reconstruction (B, C) showing Ttn locus in relation to nuclear lamina and H3K9me2-marked chromatin in ESC. (D) 3D reconstruction showing Ttn locus in relation to nuclear lamina in CM. Bottom panels in (C, D) are higher magnification, slightly rotated images, demonstrating distance of each Ttn allele from lamina (Lmnb). Ttn is located further away from the nuclear periphery in CM (C versus D). (E) Immuno-FISH of indicated loci (red) in each cell type co-stained for LaminB (Lmnb). Number of alleles per cell per locus shown adjacent to immuno-FISH images; 20–30 cells were quantified per condition per locus. Thresholding: see methods. (F) Quantitation of distance (E) performed on an individual locus basis in each cell type as indicated. Scale bars: (A, B) 0.5 µm; (C–E) 5 µm. * p< 0.001. Statistical comparisons analyzed by (E) Fisher’s Exact test; (F) one-way ANOVA with a Tukey post-hoc test, comparisons shown in reference to Kcnc2 loci. See Fig. S5, Table S5.
Figure 6
Figure 6. Hdac3 is required to retain candidate loci at the nuclear lamina
(A) Immuno-FISH of indicated loci (red) in CMV-creERT; Hdac3f/f ESCs treated with vehicle or tamoxifen and co-stained for LaminB (Lmnb). Cardiac genes (Ttn, Actc1, Calca) show precocious release from the nuclear periphery upon tamoxifen-mediated Hdac3 deletion. Scoring of number of alleles at the nuclear lamina per cell for each locus is adjacent to immuno-FISH images; 20–30 nuclei were quantified for each condition, for each gene. Thresholding: see methods. (B) Quantitation of distance from the nuclear lamina as observed in immuno-FISH (A) on an individual locus basis in each treatment condition shows significant relocation of cardiac gene loci upon Hdac3 deletion. (C) IF of localization of indicated Hdac3 construct (Flag); Lap2β fusion tethers Hdac3 to the nuclear periphery; Hdac3Δ33-70 loses peripheral localization; right panel of paired image is higher magnification of boxed area in left panel. (D) Immuno-FISH of Actc1 in CMV-creERT; Hdac3f/f ESCs, co-stained for Lmnb, treated with vehicle or tamoxifen, and indicated Hdac3 construct; all Hdac3 constructs rescue locus localization except Hdac3Δ33-70. (E) Scoring number of alleles at the nuclear lamina per cell for Actc1 per condition and construct for (D); 20–30 cells were quantified per condition. Thresholding: see methods. (F) Immuno-FISH (D) quantified on an individual locus basis. Scale bars: 5 µm. * p< 0.01. Statistical comparisons in (A, E) analyzed by Fisher’s Exact test. Statistical comparison in (B) by Student’s t-test, and in (F) by oneway ANOVA with a Tukey post-hoc test; comparison in reference to vehicle treatment. See Fig. S6, Table S5.
Figure 7
Figure 7. Hdac3 requires interaction with the nuclear lamina to repress cardiac differentiation
(A) Schema of Hdac3 constructs transduced at day 5 of differentiation with simultaneous tamoxifen-mediated Hdac3 deletion. (B) Percentage of Tnnt2+ cardiac myocyte cells on day 8 of differentiation measured by flow cytometry in cells with vehicle or tamoxifen and indicated constructs; all Hdac3 constructs rescue Hdac3 deletion precocious cardiogenesis phenotype, except Hdac3Δ33-70. (C) Gene expression analysis (qRT-PCR) of CM genes and Hdac3 from day 8 cells with vehicle or tamoxifen and indicated constructs; rescue of cardiac gene expression by all constructs, except Hdac3Δ33-70. Data represent mean ± SEM, n≥3 replicates in (B), (C). * p< 0.05, all statistical comparisons are to vehicle+GFP control, analyzed by one-way ANOVA with a Tukey post-hoc test. (D) Differentiation of multipotent CPCs depends on Hdac3 to orchestrate simultaneous release of genomic regions containing lineage-specific loci from the nuclear lamina. Hdac3 tethers chromatin to the lamina. Without Hdac3, cardiac-specific genes lose contact with the nuclear lamina, are less frequently found within the H3K9me2-marked layer of peripheral heterochromatin, and are more likely to be transcriptionally active.

References

    1. Bhaskara S, Chyla BJ, Amann JM, Knutson SK, Cortez D, Sun Z-W, Hiebert SW. Deletion of histone deacetylase 3 reveals critical roles in S phase progression and DNA damage control. Molecular cell. 2008;30:61–72. - PMC - PubMed
    1. Black JC, Whetstine JR. Chromatin landscape: methylation beyond transcription. Epigenetics. 2011;6:9–15. - PMC - PubMed
    1. Chen CK, Blanco M, Jackson C, Aznauryan E, Ollikainen N, Surka C, Chow A, Cerase A, McDonel P, Guttman M. Xist recruits the X chromosome to the nuclear lamina to enable chromosome-wide silencing. Science. 2016;354:468–472. - PubMed
    1. Filion GJ, van Steensel B. Reassessing the abundance of H3K9me2 chromatin domains in embryonic stem cells. Nat Genet. 2010;42:4. author reply 5–6. - PubMed
    1. Fuster JJ, MacLauchlan S, Zuriaga MA, Polackal MN, Ostriker AC, Chakraborty R, Wu CL, Sano S, Muralidharan S, Rius C, et al. Clonal hematopoiesis associated with TET2 deficiency accelerates atherosclerosis development in mice. Science. 2017;355:842–847. - PMC - PubMed