. 2017 Nov 16;171(5):1057-1071.e11.
doi: 10.1016/j.cell.2017.09.029. Epub 2017 Oct 12.

Oxysterol Restraint of Cholesterol Synthesis Prevents AIM2 Inflammasome Activation

Affiliations

Oxysterol Restraint of Cholesterol Synthesis Prevents AIM2 Inflammasome Activation

Eric V Dang et al. Cell. .

Abstract

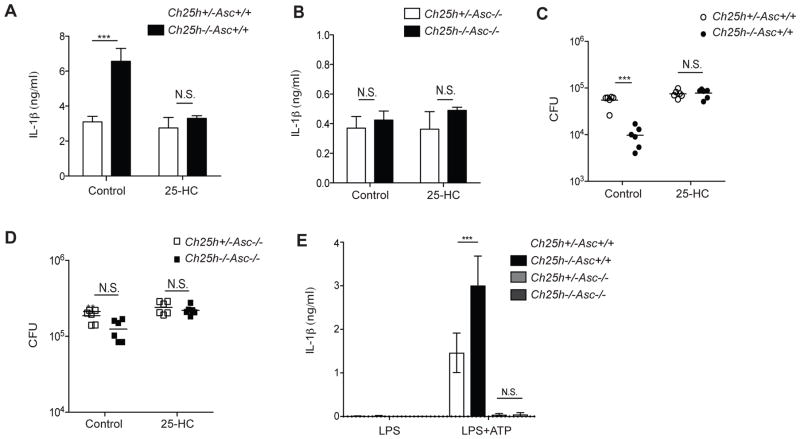
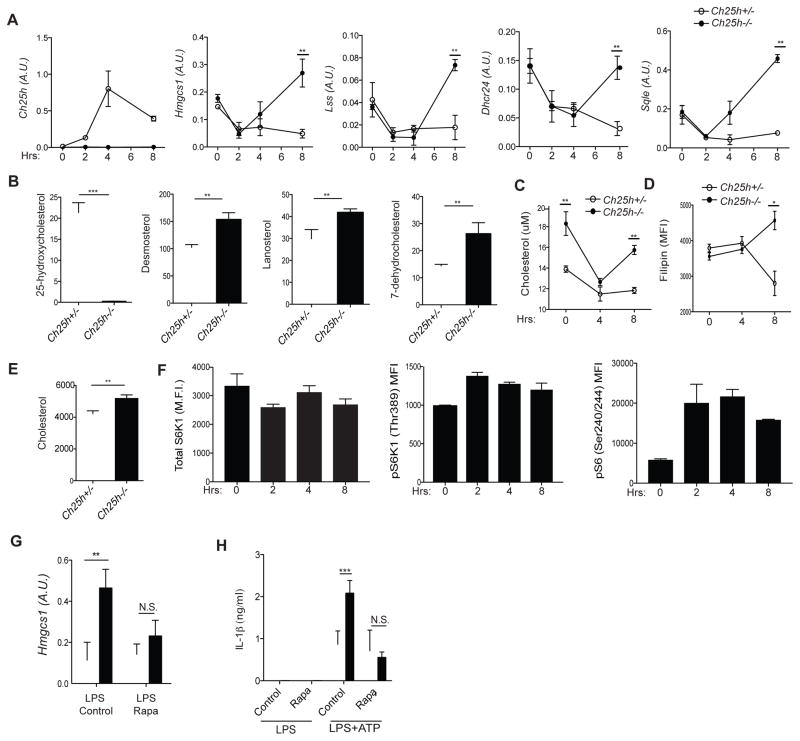
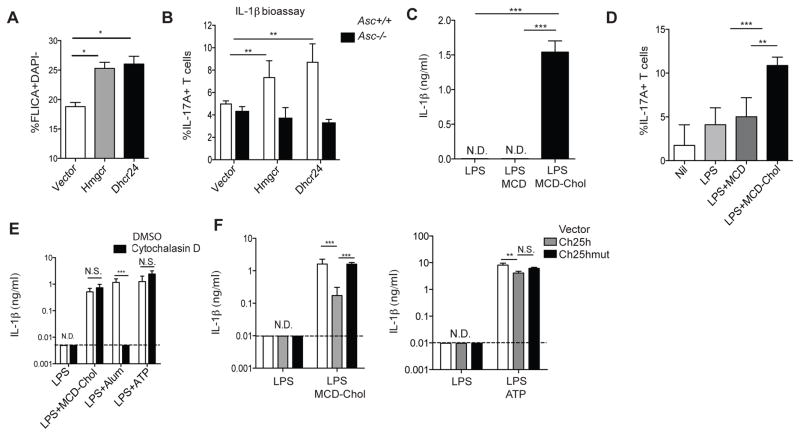
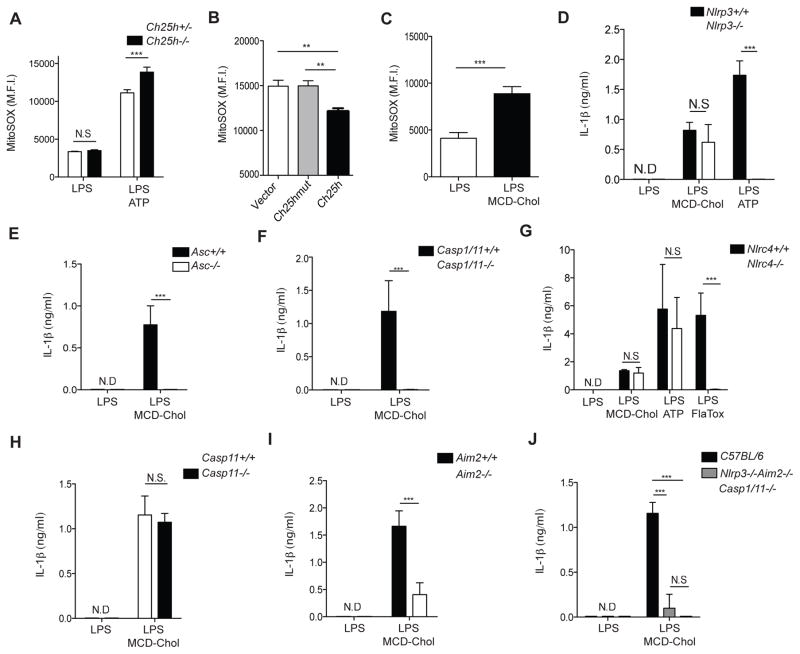
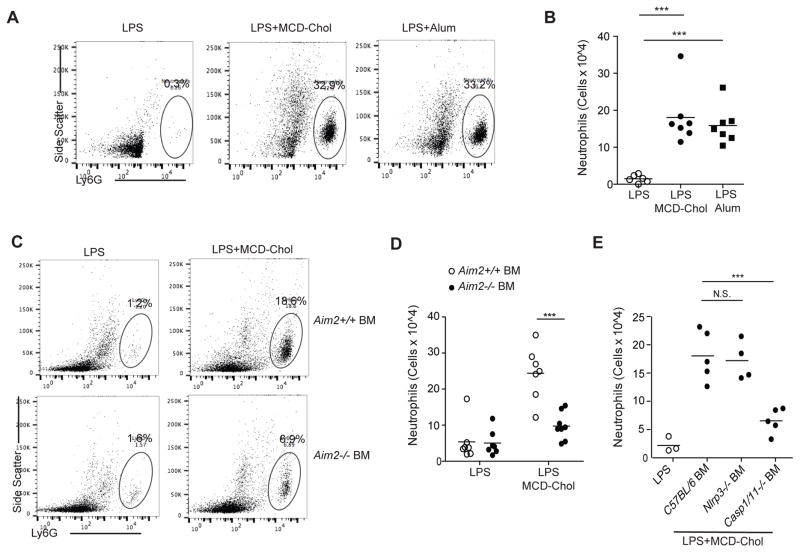
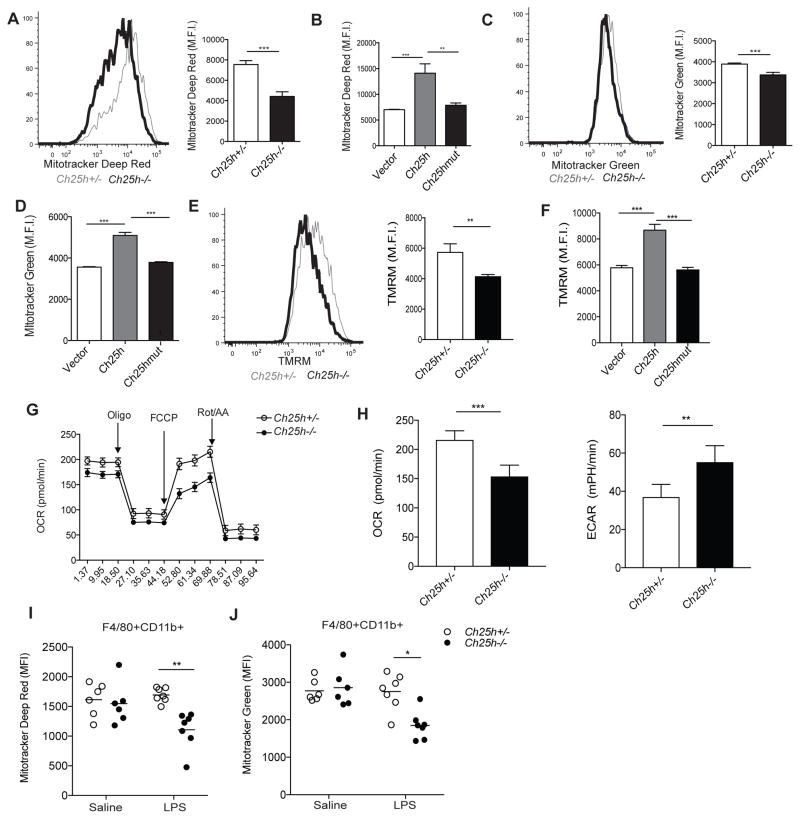
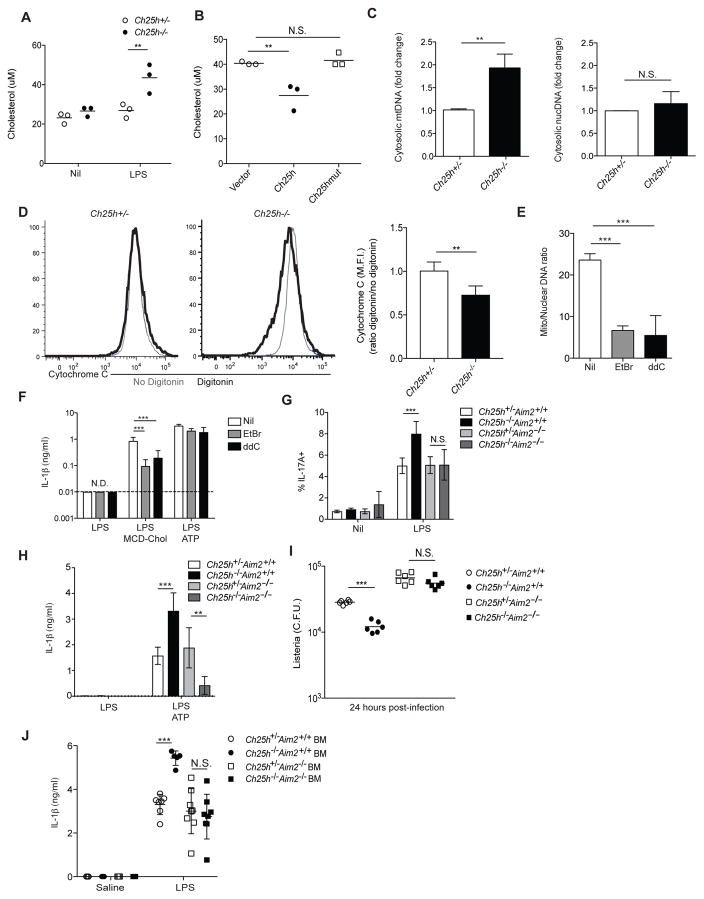
Type I interferon restrains interleukin-1β (IL-1β)-driven inflammation in macrophages by upregulating cholesterol-25-hydroxylase (Ch25h) and repressing SREBP transcription factors. However, the molecular links between lipid metabolism and IL-1β production remain obscure. Here, we demonstrate that production of 25-hydroxycholesterol (25-HC) by macrophages is required to prevent inflammasome activation by the DNA sensor protein absent in melanoma 2 (AIM2). We find that in response to bacterial infection or lipopolysaccharide (LPS) stimulation, macrophages upregulate Ch25h to maintain repression of SREBP2 activation and cholesterol synthesis. Increasing macrophage cholesterol content is sufficient to trigger IL-1β release in a crystal-independent but AIM2-dependent manner. Ch25h deficiency results in cholesterol-dependent reduced mitochondrial respiratory capacity and release of mitochondrial DNA into the cytosol. AIM2 deficiency rescues the increased inflammasome activity observed in Ch25h-/-. Therefore, activated macrophages utilize 25-HC in an anti-inflammatory circuit that maintains mitochondrial integrity and prevents spurious AIM2 inflammasome activation.

Keywords: 25-hydroxycholesterol; AIM2; Ch25h; IL-1β; SREBP; cholesterol; inflammasome; macrophage; mitochondria; oxysterol.


Figures

Figure 1
Figure 1. Increased IL-1β production and control of L. monocytogenes intracellular growth in Ch25h−/− macrophages involves ASC-dependent inflammasome activation
IL-1β enzyme-linked immunosorbent assay (ELISA) from supernatants (A, B) and bacterial colony forming units (CFU) from cell lysates (C, D) of control (EtOH) or 25-HC (1uM) treated Ch25h+/−Asc+/+ and Ch25h−/−Asc+/+ (A, C) or Ch25h+/−Asc−/− and Ch25h−/−Asc−/− (B, D) BMDMs after 24 hr of L. monocytogenes infection (M.O.I. 10:1). (E) IL-1β ELISA from supernatants of LPS and LPS+ATP stimulated BMDMs of the indicated genotypes. (n=3 per genotype, means+/−SD). *P<0.05, **P<0.01, ***P < 0.005 (unpaired Students t test). See also Figure S1.
Figure 2
Figure 2. Ch25h induction prevents cholesterol buildup in macrophages by enforcing repression of mTORC1-dependent SREBP activity
(A) RT-qPCR analysis of Ch25h, Hmgcs1, Lss, Dhcr24, and Sqle in Ch25h+/− and Ch25h−/− BMDMs stimulated with LPS. Data are standardized by comparison to Hprt, and A.U. indicates arbitrary unit (means+/−SD from 4 independent experiments). (B) LC-MS quantification of 25-HC, desmosterol, lanosterol, and 7-dehydrocholestrol in Ch25h+/− and Ch25h−/− BMDMs stimulated with LPS for 8 hr. Y-axis indicates ng/2×106 cells. Data from two independent experiments (mean+/−SD). (C) Quantification of cholesterol content by Amplex Red fluorescence in Ch25h+/− and Ch25h−/− BMDMs stimulated with LPS. Data from 4 independent experiments (mean+/−SD). (D) FACS-based readout of cholesterol content by Filipin staining. Representative of three independent experiments (mean+/−SD). (E) GC-MS quantification of cholesterol content in Ch25h+/− and Ch25h−/− BMDMs stimulated with LPS for 8 hr (n=3, mean+/−SD). (F) Flow cytometry for pS6K1 (Thr389) and pS6 (S240/244) from BMDMs stimulated with LPS. (G) RT-qPCR analysis of Hmgcs1 expression in Ch25h+/− and Ch25h−/− BMDMs treated with LPS and DMSO or rapamycin. Data from three independent experiments (mean+/−SD). (H) IL-1β ELISA from supernatants of Ch25h+/− and Ch25h−/− BMDMs treated with LPS and DMSO or rapamycin, and then with ATP. Data from two independent experiments (mean+/−SD). *P<0.05, **P<0.01, ***P < 0.005 (unpaired Students t test). See also Figure S1.
Figure 3
Figure 3. Increased macrophage cholesterol content promotes crystal-independent inflammasome activation
(A) FACS analysis of FLICA staining on BMDMs transduced with either MSCV-vector, -Hmgcr, or -Dhcr24 retrovirus and stimulated with LPS for 8 hr. Data from 3 independent experiments (mean+/−SD). (B) IL-1β bioactivity detected as percentage of CD4+ T cells producing IL-17A after culture for 4 days in supernatants from Asc+/+ or Asc−/− BMDMs transduced and stimulated as in A. Graph is representative of 3 independent experiments (mean+/−SD). (C) IL-1β ELISA of supernatants from BMDMs treated with 4 hr with LPS+MCD-Chol. Data from 6 independent experiments (mean+/−SD). (D) IL-1β bioactivity detected as in (B) with supernatants from BMDMs stimulated for 8 hr with either nil, LPS, LPS+MCD (10ug/ml), or LPS+MCD-Chol (10ug/ml). Data from three independent experiments (mean+/− SD). (E) IL-1β ELISA from supernatants of BMDMs treated with LPS, LPS+MCD-Chol, LPS+Alum or LPS+ATP and with DMSO or cytochalasin D. Data from 3 independent experiments (mean+/−SD). (F) IL-1β ELISA of supernatants from Ch25h−/− BMDMs transduced with MSCV-vector, −Ch25h, or −Ch25hmut and stimulated with either LPS, LPS+MCD-Chol, or LPS+ATP. Data from four independent experiments (mean+/−SD). *P<0.05, **P<0.01, ***P < 0.005 (unpaired Students t test or one way ANOVA with bonferroni test). See also Figure S2.
Figure 4
Figure 4. Cholesterol-dependent inflammasome activation requires AIM2 and redundantly involves NLRP3
(A) Mitochondrial superoxide levels determined by MitoSOX staining of Ch25h+/− and Ch25h−/− BMDMs stimulated for 8 hr with LPS, or LPS+ATP treatment. Data are representative of 6 independent experiments (mean+/−SD). (B) MitoSOX staining of Ch25h−/− BMDMs transduced with MSCV-vector, −Ch25h, or −Ch25hmut and stimulated as in A. Data from 2 independent experiments (mean+/−SD). (C) MitoSOX staining from BMDMs stimulated for with LPS or LPS+MCD-Chol. Data are representative of 3 independent experiments (mean +/− SD). (D-J) IL-1β ELISA of supernatants from Nlrp3+/+ and Nlrp3−/− (D), Asc+/+ and Asc−/− (E), Casp1/11+/+ and Casp1/11−/− (F), Nlrc4+/+ and Nlrc4−/− (G), Casp11+/+ and Casp11−/− (H), Aim2+/+ and Aim2−/− (I), or Nlrp3+/+Aim2+/+ and Nlrp3−/−Aim2−/− BMDMs treated as indicated. Data from 2 to 4 experiments (mean+/−SD). *P<0.05, **P<0.01, ***P < 0.005 (unpaired Students t test or one way ANOVA with bonferroni test). See also Figure S3.
Figure 5
Figure 5. AIM2 is required for cholesterol-dependent neutrophilic peritonitis
(A) Representative FACS plots of peritoneal Ly6G+ cells from mice injected I.P. 8 hr earlier with the indicated treatments displaying percentage of Ly6G+ cells. (B) Number of peritoneal neutrophils from mice as treated in A. (C) Representative FACS plots of peritoneal Ly6G+ cells from LPS or LPS+MCD-Chol treated wild type or Aim2−/− BM chimeras. (D) Number of peritoneal neutrophils from mice of the type in C treated with LPS or LPS+MCD-chol for 8 hr. (E) Number of peritoneal neutrophils from wild type mice irradiated and transplanted with either wild type, Nlrp3−/−, or Casp1/11−/− BM, and treated as in D. Each dot represents an individual mouse and data are pooled from 3 independent experiments (mean+/−SD). *P<0.05, **P<0.01, ***P < 0.005 (unpaired Students t test or one way ANOVA with bonferroni test).
Figure 6
Figure 6. Ch25h-deficient and cholesterol loaded macrophages have impaired mitochondrial metabolism
(A) (Left) Representative histogram of Mitotracker Deep Red staining on Ch25h+/− and Ch25h−/− BMDMs stimulated with LPS for 8 hr. (Right) Summary mean fluorescence intensity (MFI) data from 3 experiments (mean +/− SD). Representative of 8–10 independent experiments. (B) MFI of Mitotracker Deep Red staining on Ch25h−/− BMDMs transduced with MSCV-vector, −Ch25h, or −Ch25hmut. Data from 4 independent experiments (mean+/−SD). (C) (Left) Representative histogram of Mitotracker Green staining on Ch25h+/− and Ch25h−/− BMDMs stimulated as above. (Right) Summary MFI data from 3 experiments (mean+/−SD). Representative of 8–10 independent experiments (mean +/− SD). (D) MFI of Mitotracker Green staining on Ch25h−/− BMDMs transduced with MSCV-vector, −Ch25h, or −Ch25hmut. Data from 4 independent experiments (mean+/−SD). (E) Representative histogram of TMRM staining on Ch25h+/− and Ch25h−/− BMDMs stimulated with LPS for 8 hr. Graph shows summary MFI data from 3 experiments (mean+/−SD). (F) MFI of TMRM staining on Ch25h−/− BMDMs transduced with MSCV-vector, −Ch25h, or −Ch25hmut. Data from 2 independent experiments (mean+/−SD). (G) Seahorse analysis of oxygen consumption rate (OCR) over time from BMDMs pretreated for 8 hr with LPS and after the indicated additional treatments. Data are representative of 3 independent experiments (mean+/−SD). (H) Seahorse analysis of basal OCR and extracellular acidification rate (ECAR) of Ch25h+/− and Ch25h−/− BMDMs stimulated with LPS for 8 hr. Data from 3 independent experiments (mean+/−SD). (I, J) Mitotracker Deep Red (I) and Mitotracker Green (J) staining of Ch25h+/− and Ch25h−/− peritoneal macrophages 8 hr after I.P. saline or LPS injection. Data from 3 independent (n=6–7 mice per group). See also Figure S4.
Figure 7
Figure 7. Cholesterol buildup in mitochondrial causes cytosolic release of mtDNA
(A) Quantification of cholesterol in isolated mitochondria from Ch25h+/− and Ch25h−/− BMDMs either untreated or stimulated with LPS for 8 hr. Data from 3 independent experiments (mean+/−SD). (B) Quantification of cholesterol in Ch25h−/− BMDMs transduced with MSCV-vector, −Ch25h, or −Ch25hmut and treated for 8 hr with LPS. Data from three independent experiments (mean+/−SD). (C) mtDNA (Left) or nucDNA (Right) RT-qPCR from cytosolic extracts derived from Ch25h+/− and Ch25h−/− BMDMs treated as above. Data from 4 independent experiments (mean+/−SD). (D) Representation histograms (left) and summary graph (right) of intracellular cyt C staining in Ch25h+/− and Ch25h−/− BMDMs stimulated for 8 hr with LPS and either permeabilized with digitonin or not. Data from two independent experiments (mean+/−SD). (E) mtDNA RT-qPCR of total DNA extractions from BMDMs treated for 7 days with either nil, ethidium bromide (EtBr), or ddC. Data from 3 independent experiments (mean+/−SD). (F) IL-1β ELISA from supernatants of BMDMs depleted of mtDNA as described above, and stimulated with either LPS alone, LPS+MCD-Chol, or LPS+ATP. Data from 3 independent experiments (mean+/−SD). (G) IL-1β bioactivity detected as in Fig. 3 using supernatants from LPS-stimulated BMDMs of the indicated genotypes. Data from three independent experiments (mean+/−SD). (H) IL-1β ELISA of supernatants from BMDMs of the indicated genotypes stimulated with LPS or LPS+ATP. Data from three independent experiments (mean+/−SD). (I) L. monocytogenes CFU from BMDMs of the indicated genotypes infected for 24 hr. Data from three independent experiments (mean+/−SD). (J) IL-1β ELISA of serum from mice of the indicated genotypes injected with LPS (20mg/kg) I.V. for 8 hr. Data from three independent experiments (n = 5 to 8 mice per group, mean+/−SD). *P<0.05, **P<0.01, ***P < 0.005 (unpaired Students t test or one way ANOVA with bonferroni test). See also Figure S5.

References

    1. Aguirre S, Luthra P, Sanchez-Aparicio MT, Maestre AM, Patel J, Lamothe F, Fredericks AC, Tripathi S, Zhu T, Pintado-Silva J, et al. Dengue virus NS2B protein targets cGAS for degradation and prevents mitochondrial DNA sensing during infection. Nature Microbiology. 2017;2:17037. - PMC - PubMed
    1. Blanc M, Hsieh WY, Robertson KA, Kropp KA, Forster T, Shui G, Lacaze P, Watterson S, Griffiths SJ, Spann NJ, et al. The Transcription Factor STAT-1 Couples Macrophage Synthesis of 25-Hydroxycholesterol to the Interferon Antiviral Response. Immunity. 2013;38:106–118. - PMC - PubMed
    1. Bosch M, Marí M, Herms A, Fernández A, Fajardo A, Kassan A, Giralt A, Colell A, Balgoma D, Barbero E, et al. Caveolin-1 deficiency causes cholesterol-dependent mitochondrial dysfunction and apoptotic susceptibility. Curr Biol. 2011;21:681–686. - PMC - PubMed
    1. Campos CBL, Paim BA, Cosso RG, Castilho RF, Rottenberg H, Vercesi AE. Method for monitoring of mitochondrial cytochrome C release during cell death: Immunodetection of Cytochrome C by flow cytometry after selective permeabilization of the plasma membrane. Cytometry. 2006;69:515–523. - PubMed
    1. Chen CH, Cheng YC. Delayed cytotoxicity and selective loss of mitochondrial DNA in cells treated with the anti-human immunodeficiency virus compound 2”,3-“dideoxycytidine. J Biol Chem. 1989;264:11934–11937. - PubMed

MeSH terms