. 2017 Oct 23;27(20):3202-3208.e9.
doi: 10.1016/j.cub.2017.09.030. Epub 2017 Oct 12.

40,000-Year-Old Individual from Asia Provides Insight into Early Population Structure in Eurasia

Affiliations

40,000-Year-Old Individual from Asia Provides Insight into Early Population Structure in Eurasia

Melinda A Yang et al. Curr Biol. .

Abstract

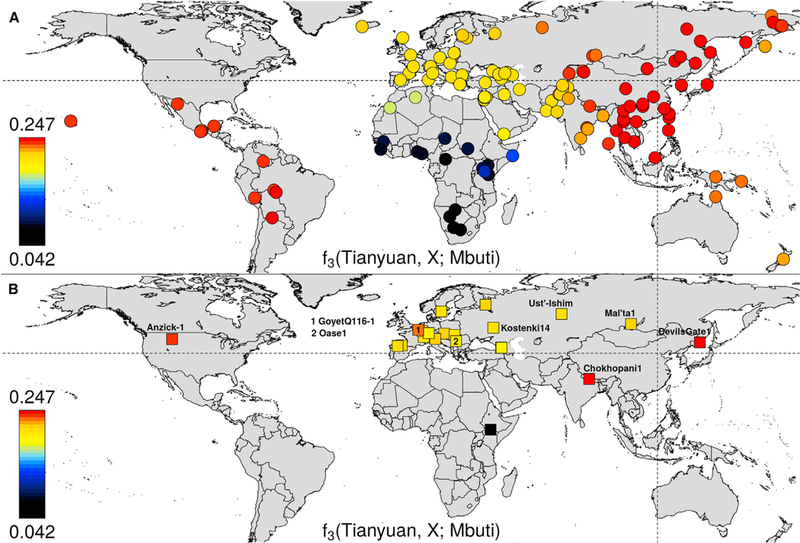
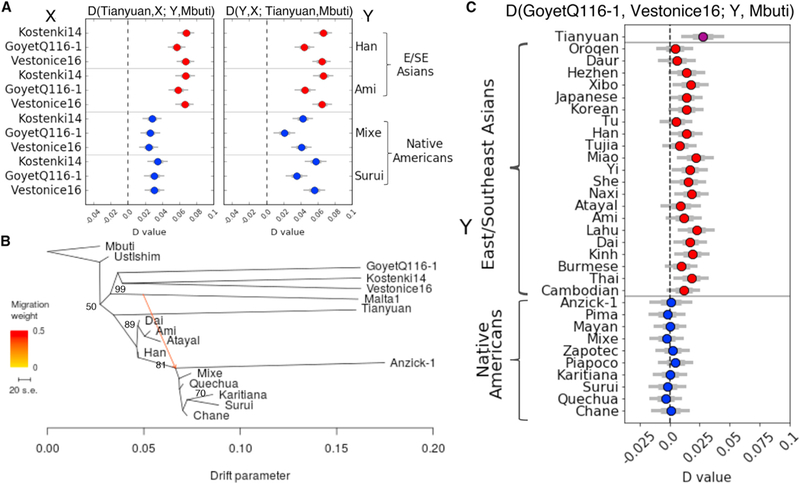
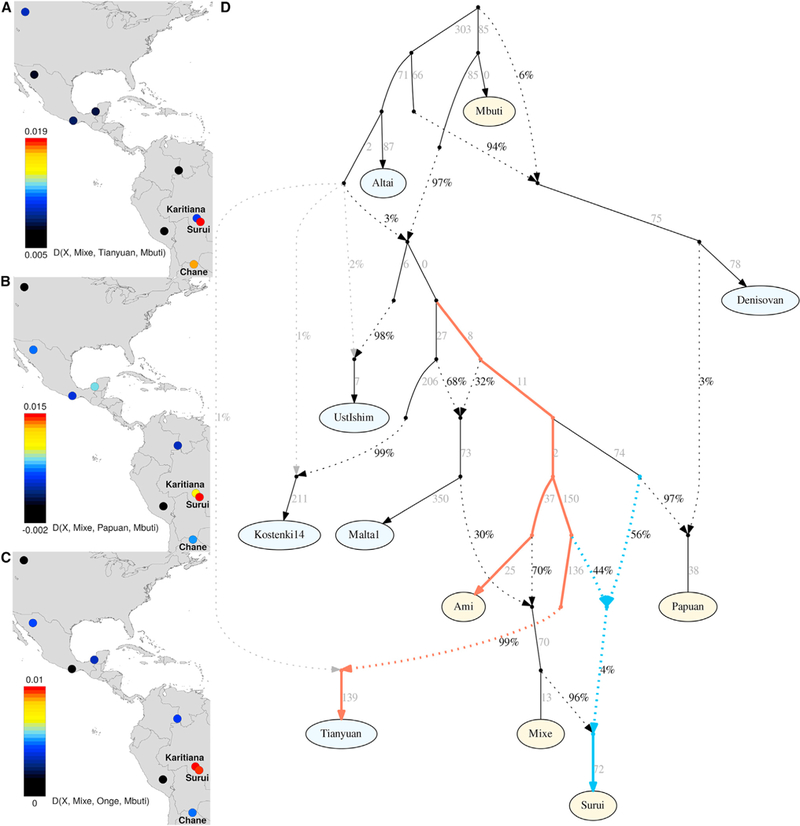
By at least 45,000 years before present, anatomically modern humans had spread across Eurasia [1-3], but it is not well known how diverse these early populations were and whether they contributed substantially to later people or represent early modern human expansions into Eurasia that left no surviving descendants today. Analyses of genome-wide data from several ancient individuals from Western Eurasia and Siberia have shown that some of these individuals have relationships to present-day Europeans [4, 5] while others did not contribute to present-day Eurasian populations [3, 6]. As contributions from Upper Paleolithic populations in Eastern Eurasia to present-day humans and their relationship to other early Eurasians is not clear, we generated genome-wide data from a 40,000-year-old individual from Tianyuan Cave, China, [1, 7] to study his relationship to ancient and present-day humans. We find that he is more related to present-day and ancient Asians than he is to Europeans, but he shares more alleles with a 35,000-year-old European individual than he shares with other ancient Europeans, indicating that the separation between early Europeans and early Asians was not a single population split. We also find that the Tianyuan individual shares more alleles with some Native American groups in South America than with Native Americans elsewhere, providing further support for population substructure in Asia [8] and suggesting that this persisted from 40,000 years ago until the colonization of the Americas. Our study of the Tianyuan individual highlights the complex migration and subdivision of early human populations in Eurasia.

Keywords: Tianyuan; Upper Paleolithic; ancient DNA; human prehistory; population structure.


Figures

Figure 1.
Figure 1.. f3(Tianyuan, X; Mbuti) for All Sites Where X Is a Present-Day Human Population or an Ancient Individual
The f3 statistic ranges from 0.04 to 0.25. A higher value (red) indicates higher shared genetic drift between the Tianyuan individual and the (A) present-day population or (B) ancient individual. The intersection of the dotted lines indicates where the Tianyuan Cave is located. See also Table S2A.
Figure 2.
Figure 2.. Comparisons Relating the Tianyuan Individual to Ancient and Present-Day Eurasians and Native Americans.
(A) D(Tianyuan, X; Y, Mbuti) and D(Y, X; Tianyuan, Mbuti), where Y is the East and Southeast Asian Han or Ami or the Native American Mixe or Surui and X is the ancient West Eurasian individual Kostenki14, GoyetQ116–1, or Vestonice16. (B) Maximum-likelihood tree showing East and Southeast Asians, Native Americans, and ancient Eurasians, with bootstrap support of 100% unless indicated otherwise. The scale bar shows the average standard error (SE) of the entries in the covariance matrix. (C) D(GoyetQ116–1, Vestonice16; Y, Mbuti), where Y is the Tianyuan individual, an East and Southeast Asian population, or a Native American population. For (A) and (C), thick bars are within 1 SE of the estimate, thin bars are within 1.96 SE of the estimate (95% confidence interval), and the dashed vertical line indicates D = 0. See also Figures S1 and S2 and Tables S2 and S3.
Figure 3.
Figure 3.. Heatmap of D Statistics and Admixture Graph Model Comparing Native Americans to the Tianyuan Individual.
(A–C) Heatmaps of (A) D(X, Mixe; Tianyuan, Mbuti), (B) D(X, Mixe; Papuan, Mbuti), and (C) D(X, Mixe; Onge, Mbuti), where X are non-Mixe Native American populations. (D) Admixture graph model that fits allele frequency patterns (all empirical f statistics are within 3 SEs of expectation). Branch lengths are shown in units of Fst × 1,000. Admixture from a population related to the Altai Neanderthal into ancient individuals (shaded gray) was collapsed into a single node, as were the original nodes atthetop ofthe graph (can be observed in Figure S4N). The orange lines indicate the edges leading totheTianyuan individual and the East and Southeast Asian Ami after splitting from the edge leading to Kostenki14. The blue lines indicate the edges showing ancestral components related totheTianyuan individual and the Papuan in the Native American Surui.See also Figure S4 and Table S2.

References

    1. Shang H, Tong H, Zhang S, Chen F, and Trinkaus E (2007). An early modern human from Tianyuan Cave, Zhoukoudian, China. Proc. Natl. Acad. Sci. USA 104, 6573–6578. - PMC - PubMed
    1. Hublin J-J (2015). The modern human colonization of western Eurasia: when and where? Quat. Sci. Rev. 118, 194–210.
    1. Fu Q, Li H, Moorjani P, Jay F, Slepchenko SM, Bondarev AA, Johnson PLF, Aximu-Petri A, Prüfer K, de Filippo C, et al. (2014). Genome sequence of a 45,000-year-old modern human from western Siberia. Nature 514, 445–449. - PMC - PubMed
    1. Fu Q, Posth C, Hajdinjak M, Petr M, Mallick S, Fernandes D, Furtwängler A, Haak W, Meyer M, Mittnik A, et al. (2016). The genetic history of Ice Age Europe. Nature 534, 200–205. - PMC - PubMed
    1. Seguin-Orlando A, Korneliussen TS, Sikora M, Malaspinas AS, Manica A, Moltke I, Albrechtsen A, Ko A, Margaryan A, Moiseyev V, et al. (2014). Paleogenomics. Genomic structure in Europeans dating back at least 36,200 years. Science 346, 1113–1118. - PubMed

LinkOut - more resources